Published at: 2025-10-30
Creating and Viewing Standard Reports
1. Creating Standard Reports
1.1 Choose from Preset Templates
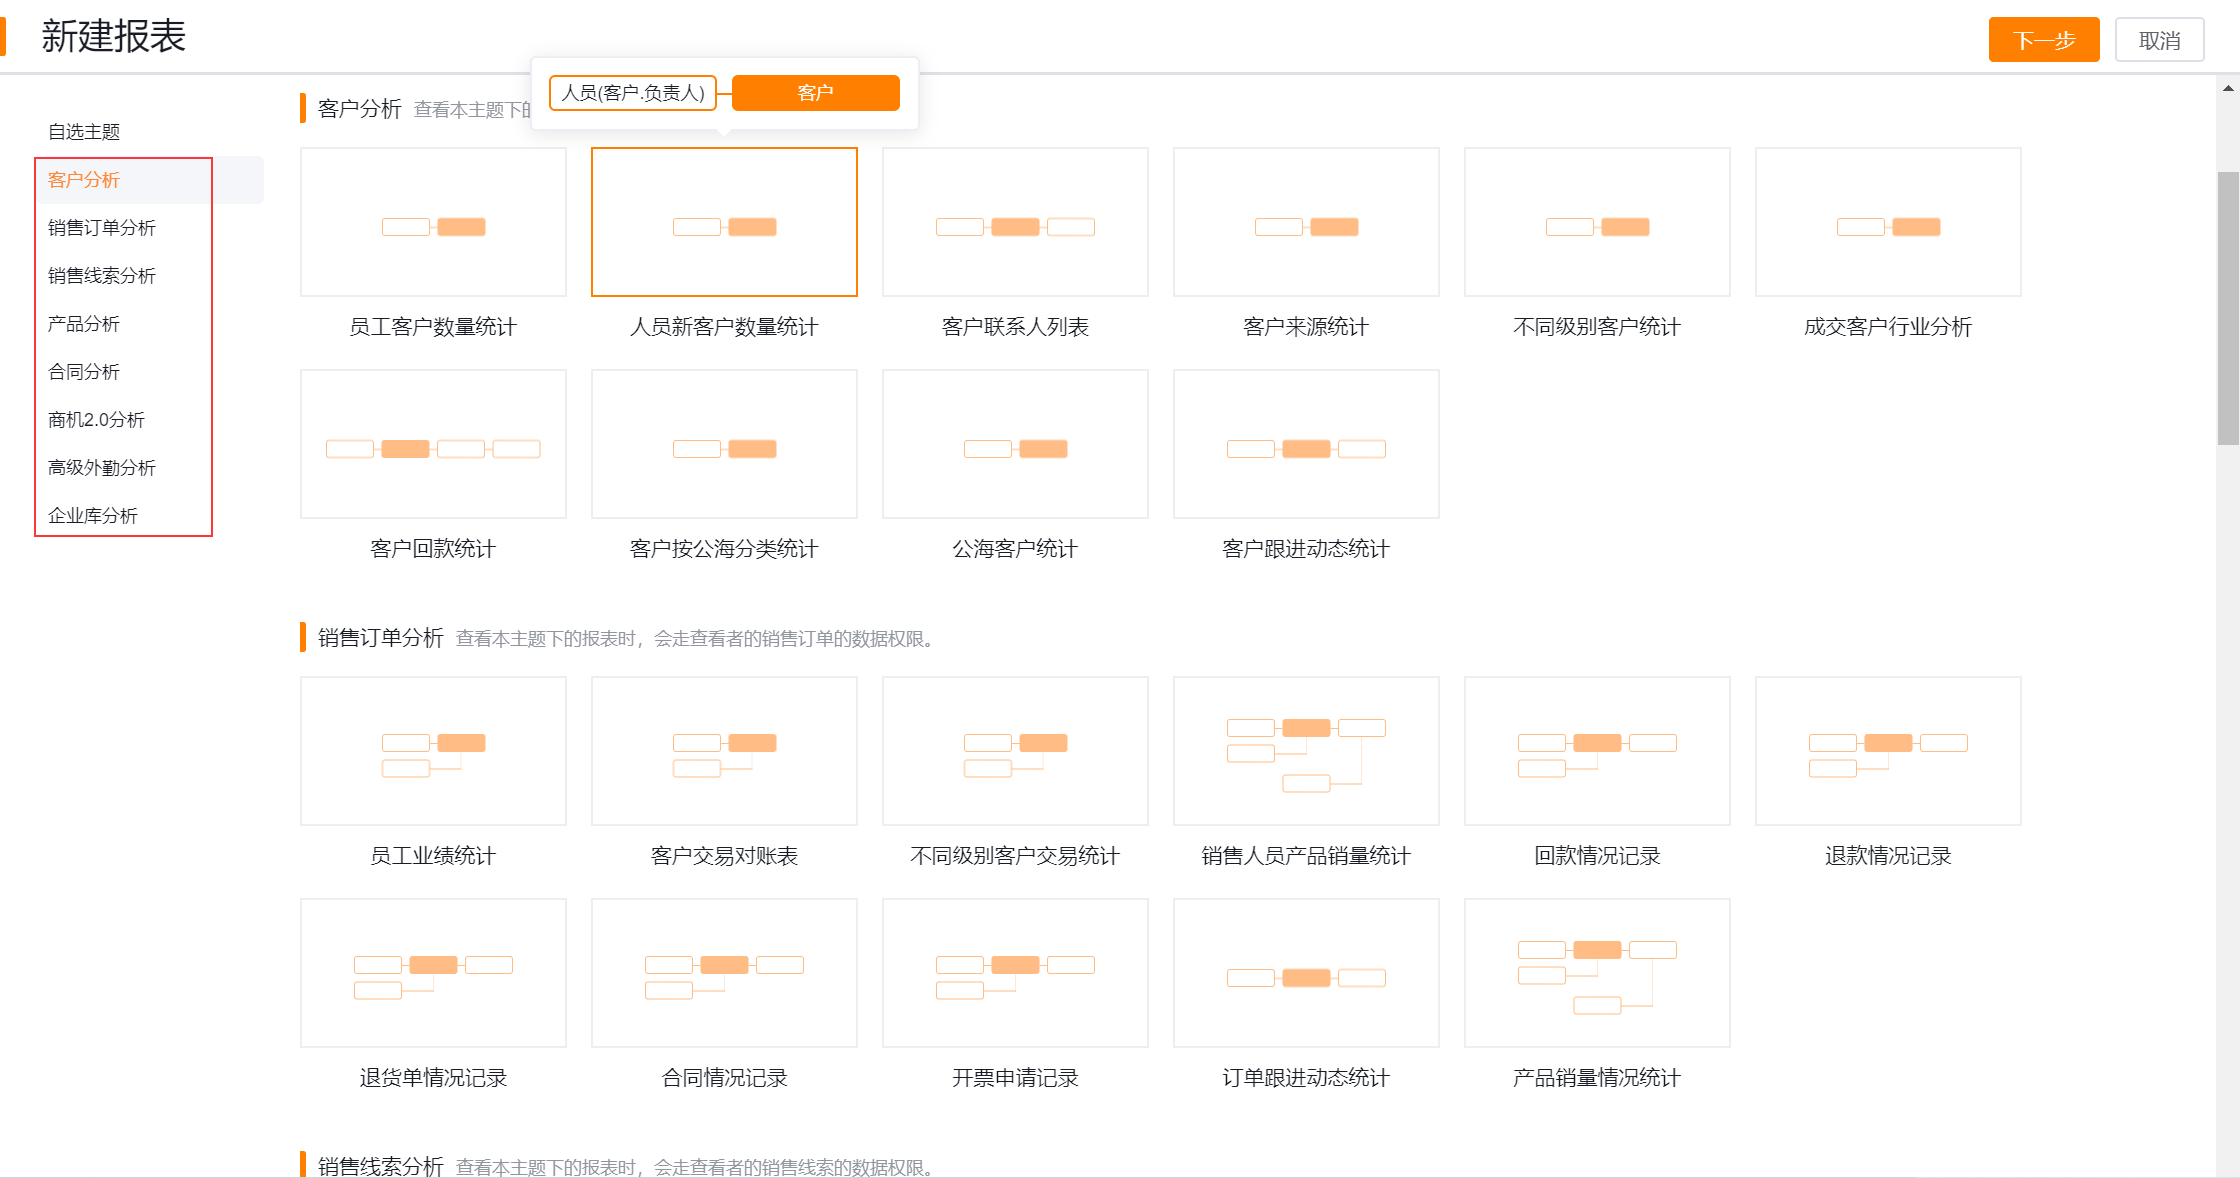
To create reports quickly, ShareCRM provides 8 themes and 51 preset templates organized by business domain. Hovering over a preset template displays the objects included in that template: solid nodes indicate the Primary Object, hollow nodes indicate related objects. You can pick fields for your report from those objects included in the template.
- Template description: Every report is based on a business domain. For example, the "Account Analysis" domain focuses on Accounts and includes reports such as new Account counts by owner, Account source distribution, and counts by Account tier.
- Using report templates: When you create a new report, the system opens the preset templates. Select a business domain and a template that match your scenario to create the report.
- Create all reports: This creates reports for all system templates. If a report category already exists, creation will fail for that category. When you add the ShareCRM application, the system automatically creates all reports using the system presets for your organization — the first time you open the Reports menu you will see those default categories and reports, so you do not need to run this action manually.
 </img>
1.2 Create from a Blank Template
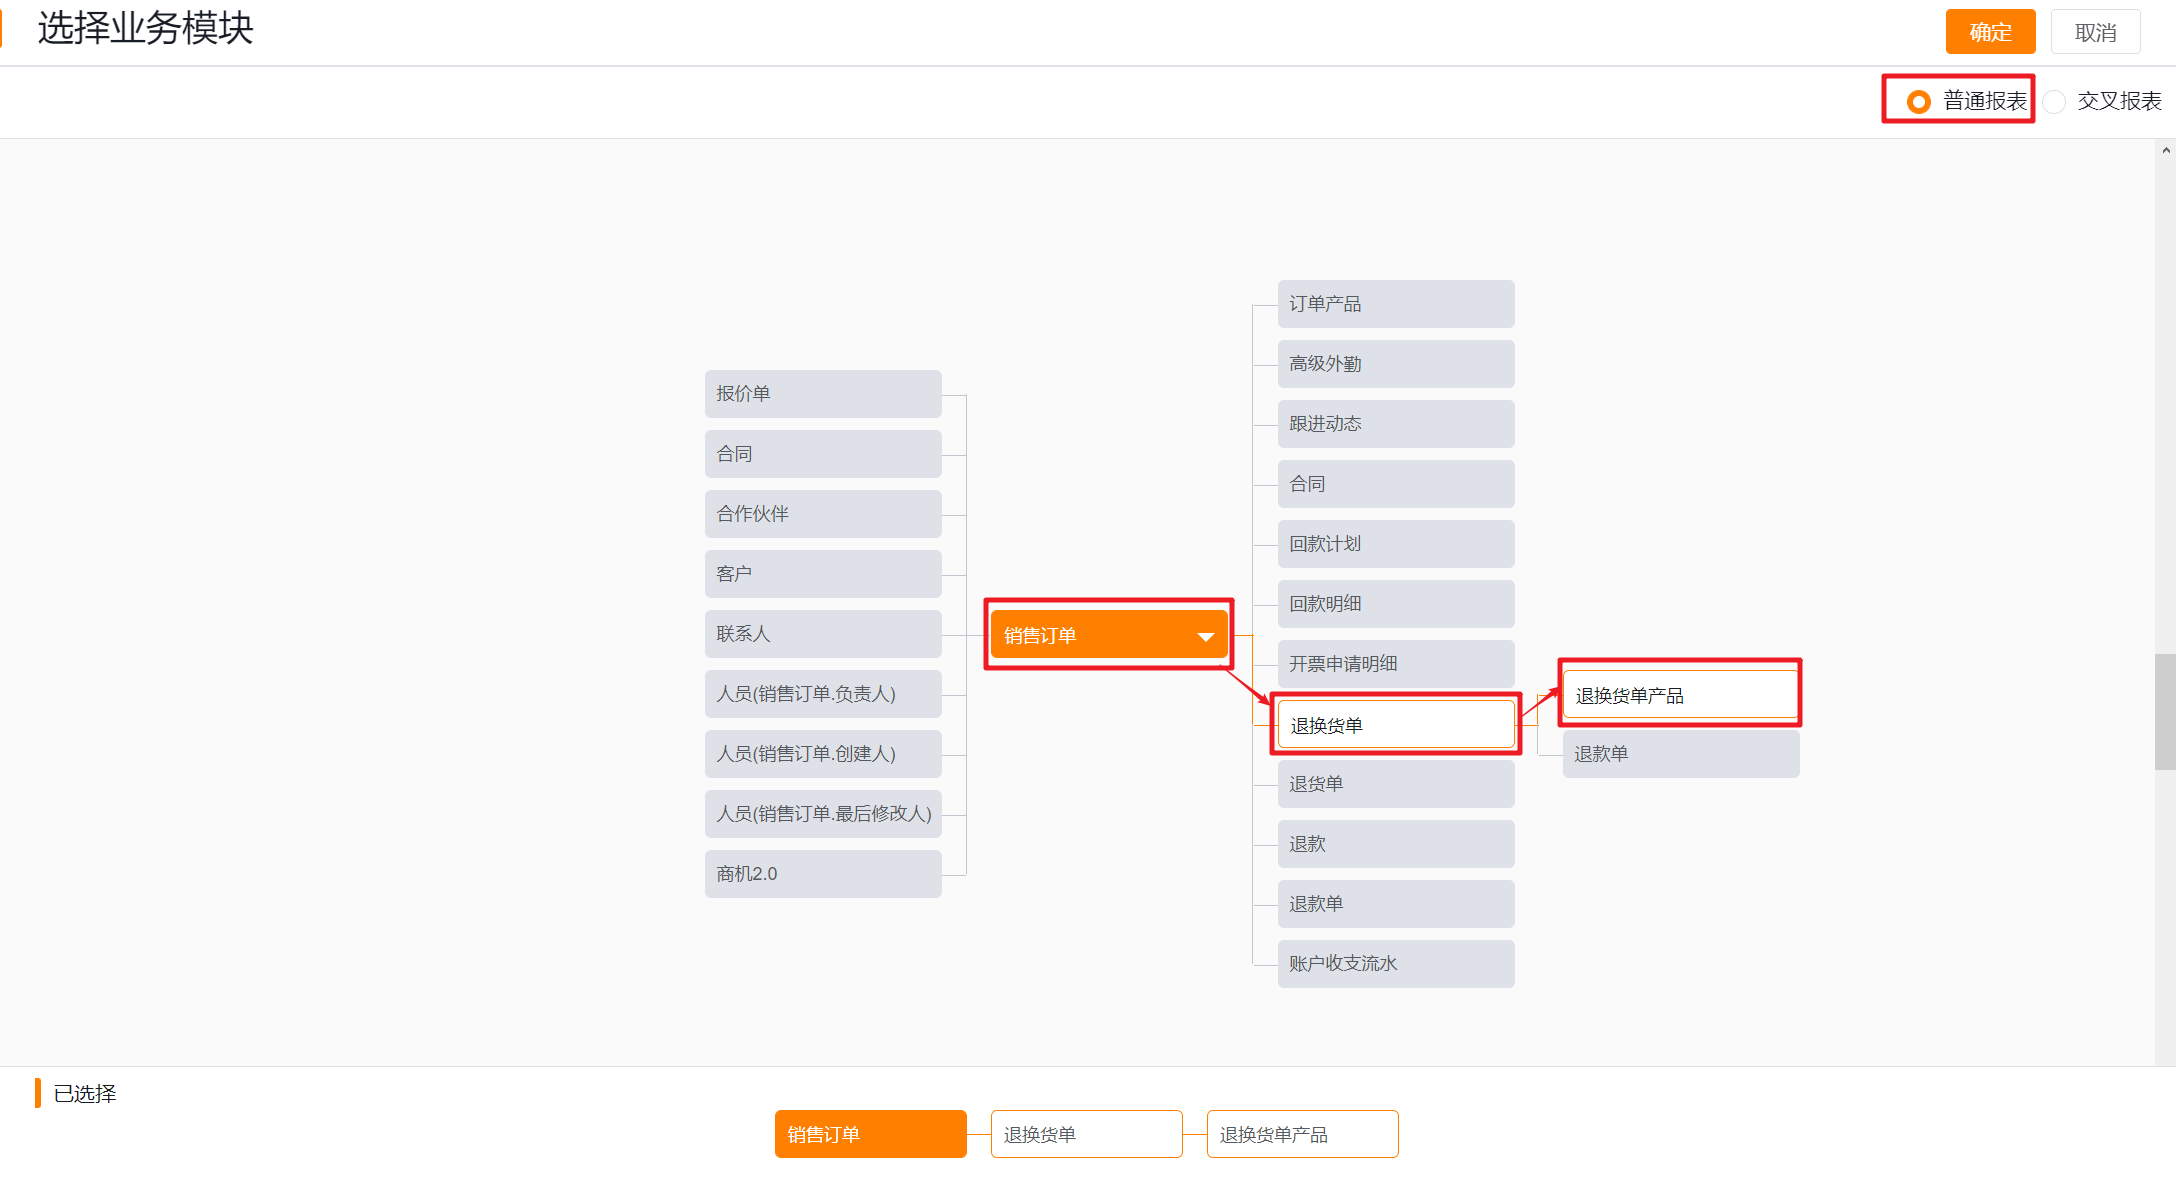
Select a blank template to build a custom-object report. First choose the Primary Object; related objects are loaded automatically and you may select them as needed.
- After selecting the objects, click Confirm to open the report designer. From there you can drag fields, set data scope, and design the report layout.
 </img>
2. Editing Standard Reports
2.1 Report Design
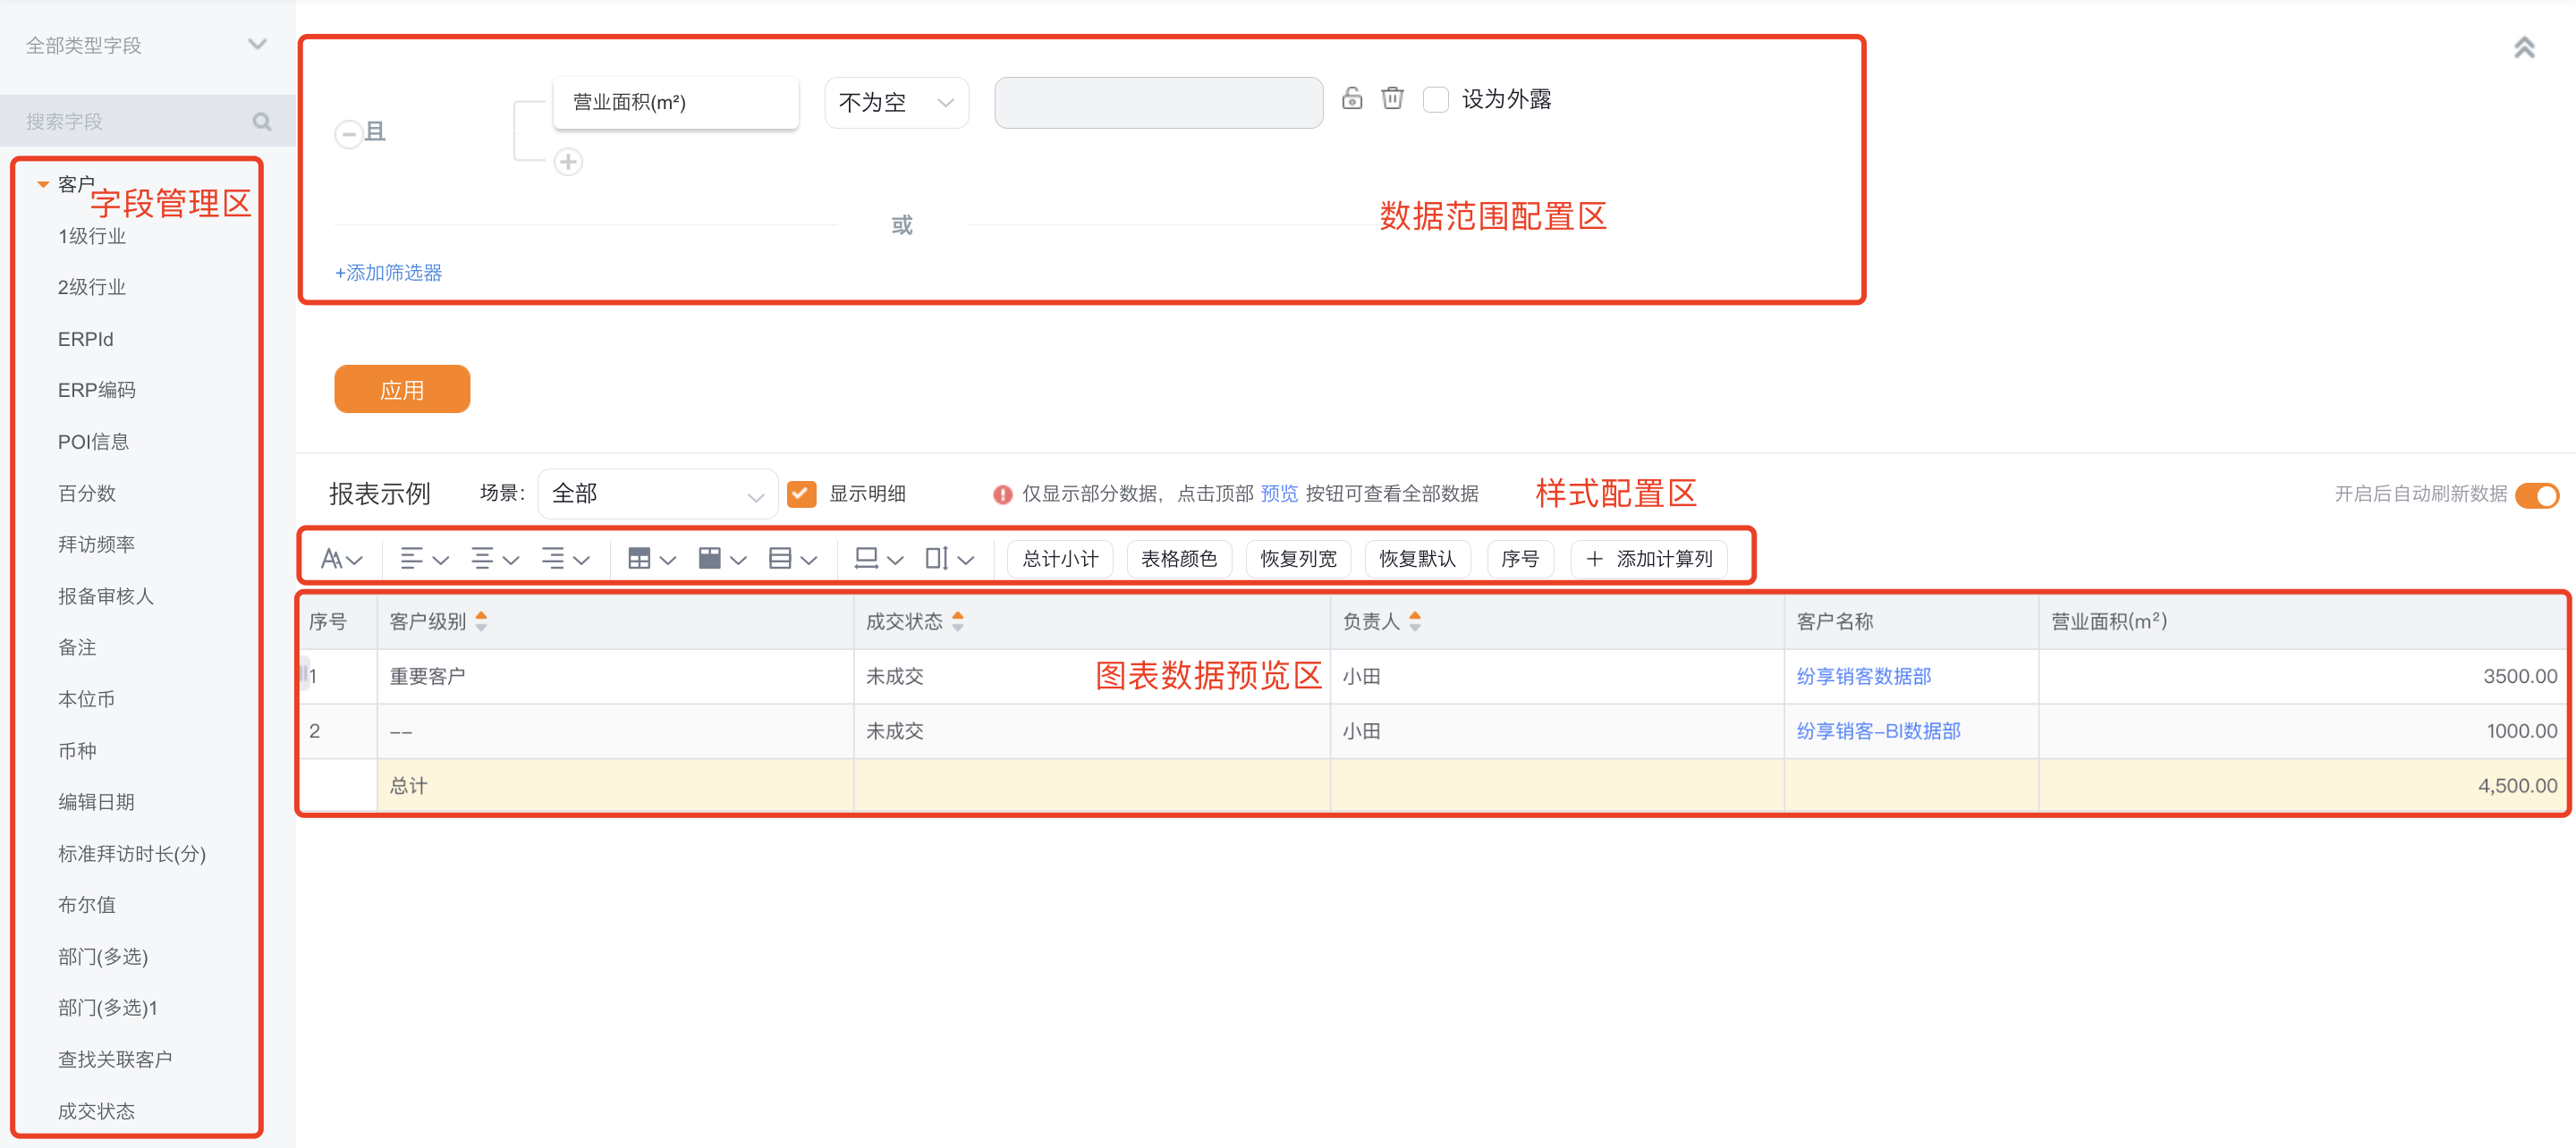
- Designer layout:
- Left: Available fields pane — fields vary by chosen template; drag fields from here to the canvas.
- Top-right: Data scope area — set the report filters here.
- Middle-right:
- Scene: Filter scenes (predefined in CRM for corresponding objects). You can set the report's default scene.
- Calculated columns: Perform arithmetic on numeric fields in the report.
- Bottom-right: Table sample area — shows a small set of rows to preview layout (click Preview to view all data).
- Click a column header to rename the field, set grouping, aggregation, or sorting.
- Fields available in reports:
- Available report fields include system preset fields and custom fields from all business objects.
- Supported synchronized field types: custom fields (text, date, numeric, components), flexible types (formula fields, roll-up/aggregate fields, lookup/reference fields), system fields (life cycle/status, primary attributes, created by, etc.), and special scenarios (multi-relationship, self-lookup, hierarchical/tree). Image fields in BI are converted to image counts for aggregation; attachment fields are not yet supported in display and will be converted to attachment counts when supported in the future.
- Unsupported display field types in BI: signature fields.
- Custom fields synchronize in real time.
 </img>
2.2 Field Selection
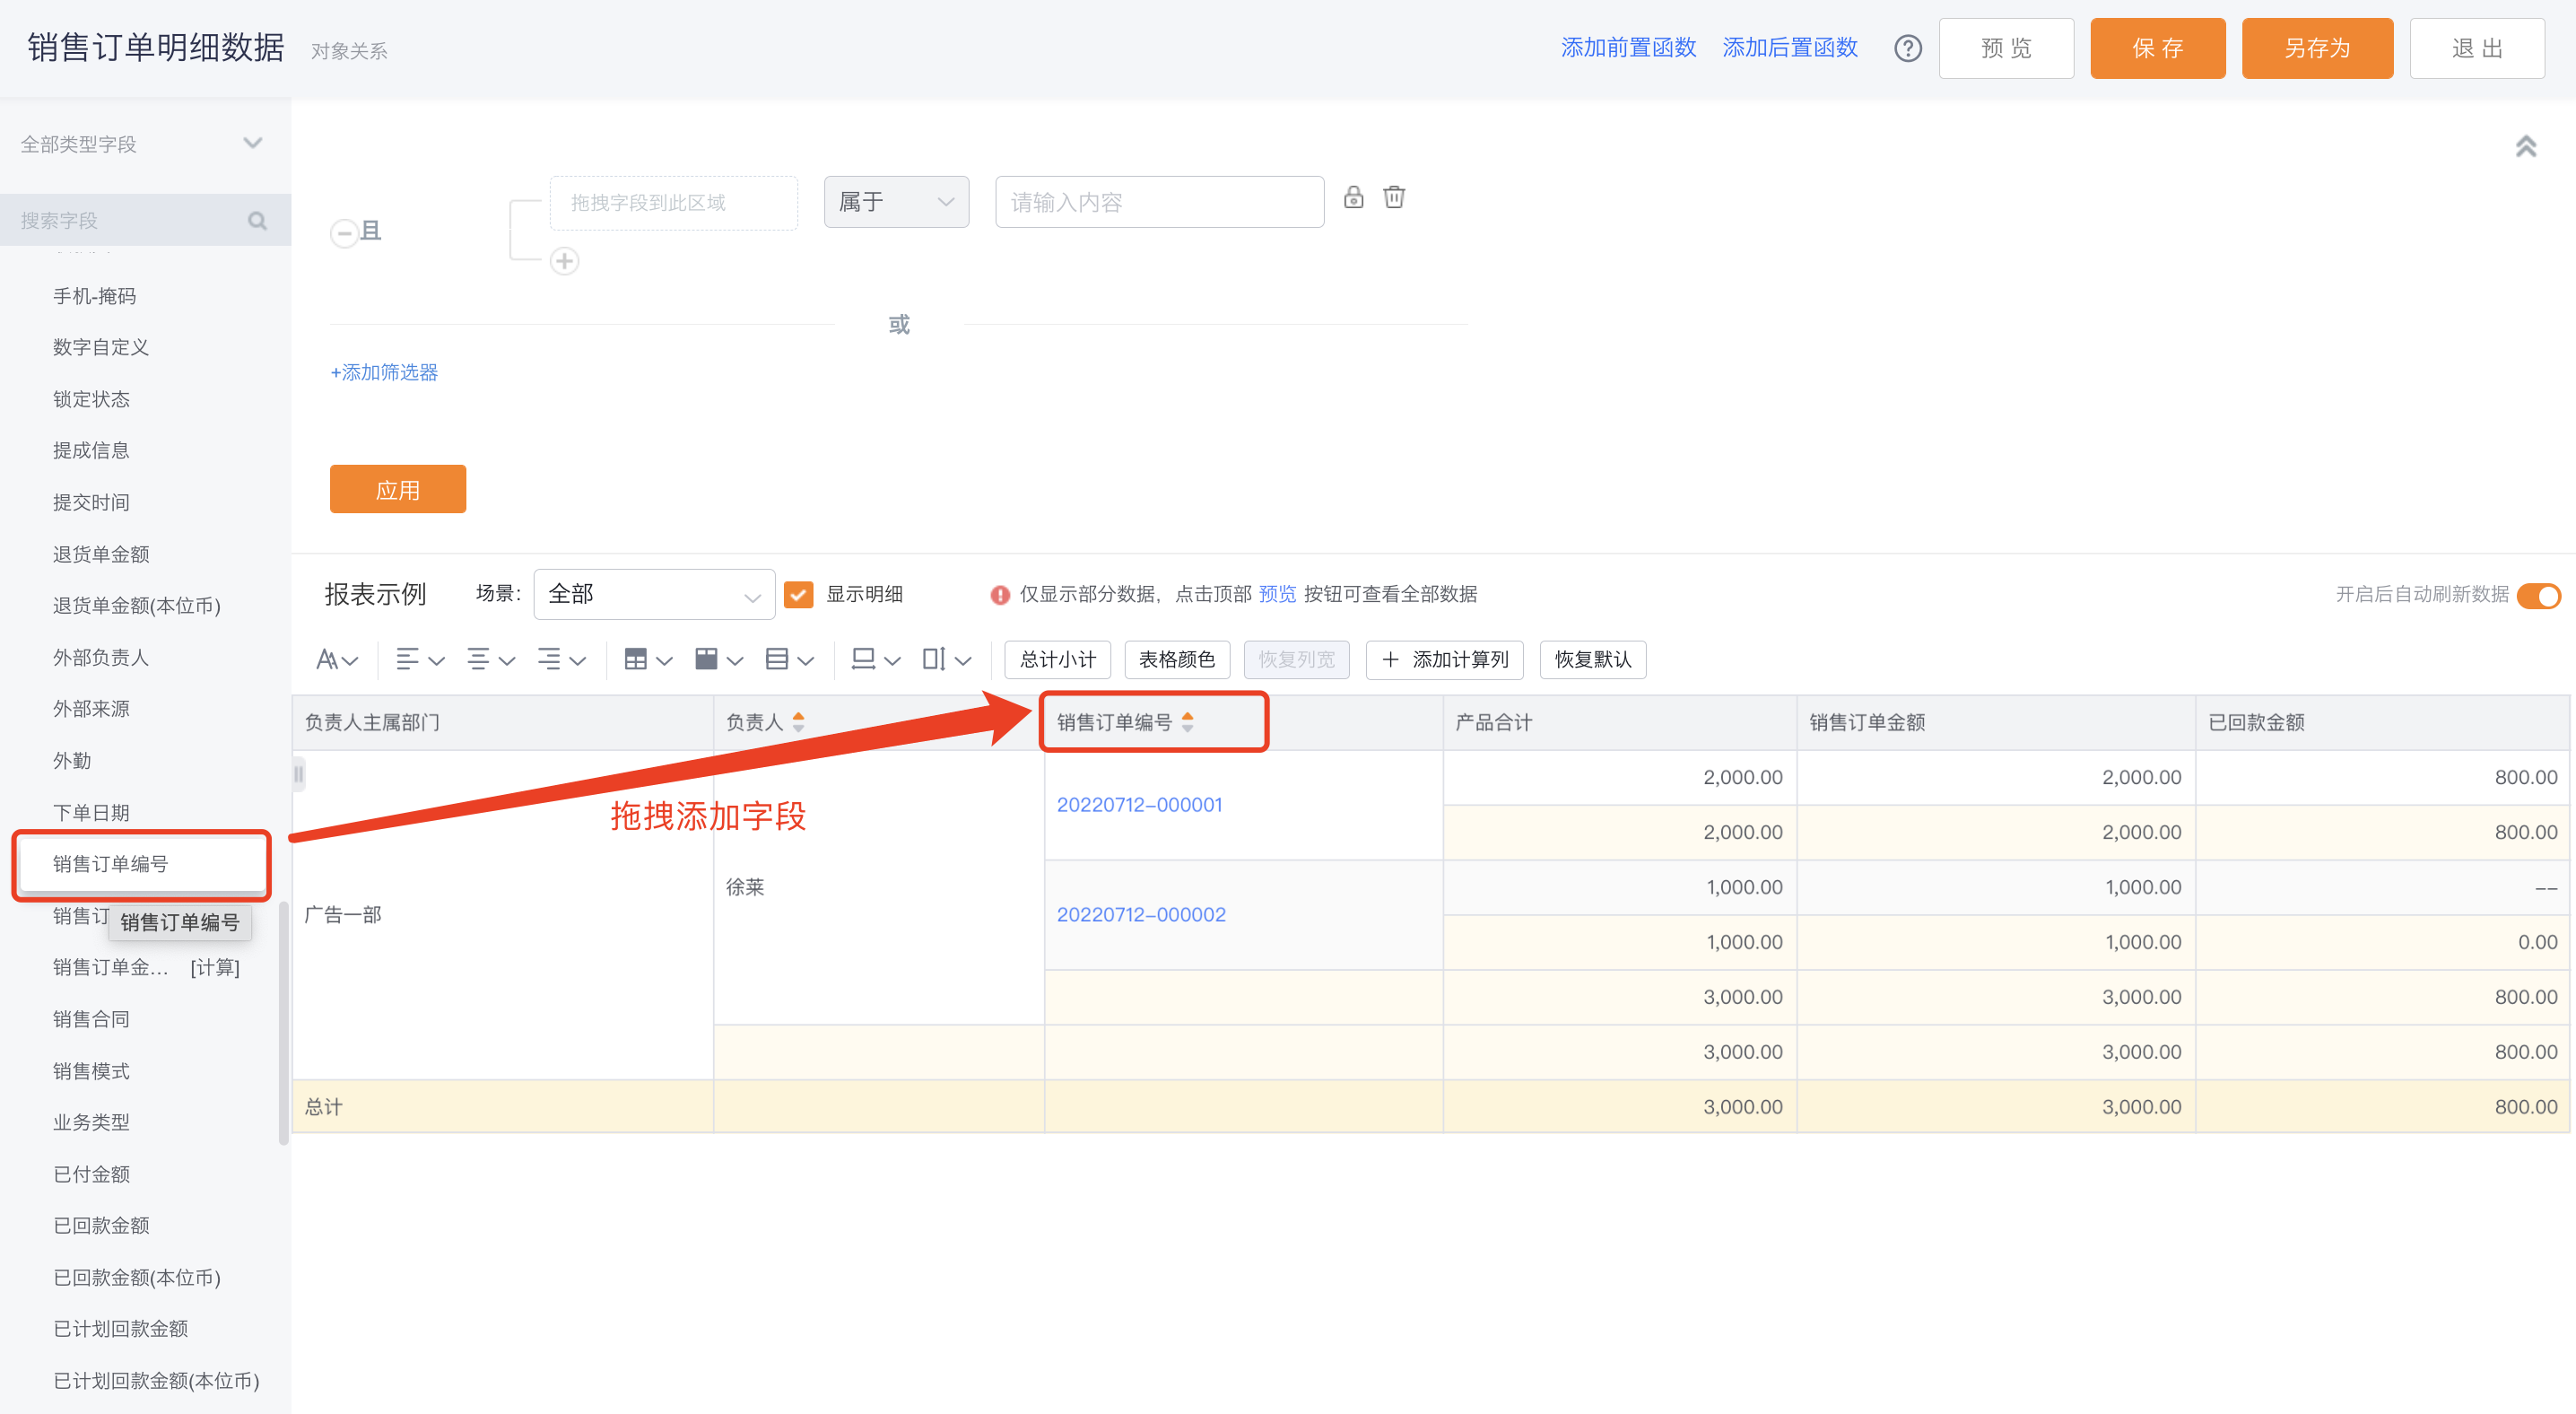
Select columns when defining a report.
- Field source: When creating a report you select a business domain; each domain has both preset and custom available report fields.
- Ordering: The available fields list is sorted alphabetically A–Z.
- Add fields to the report: Drag fields into the report; new fields are inserted to the right of the current cursor column.
 </img>
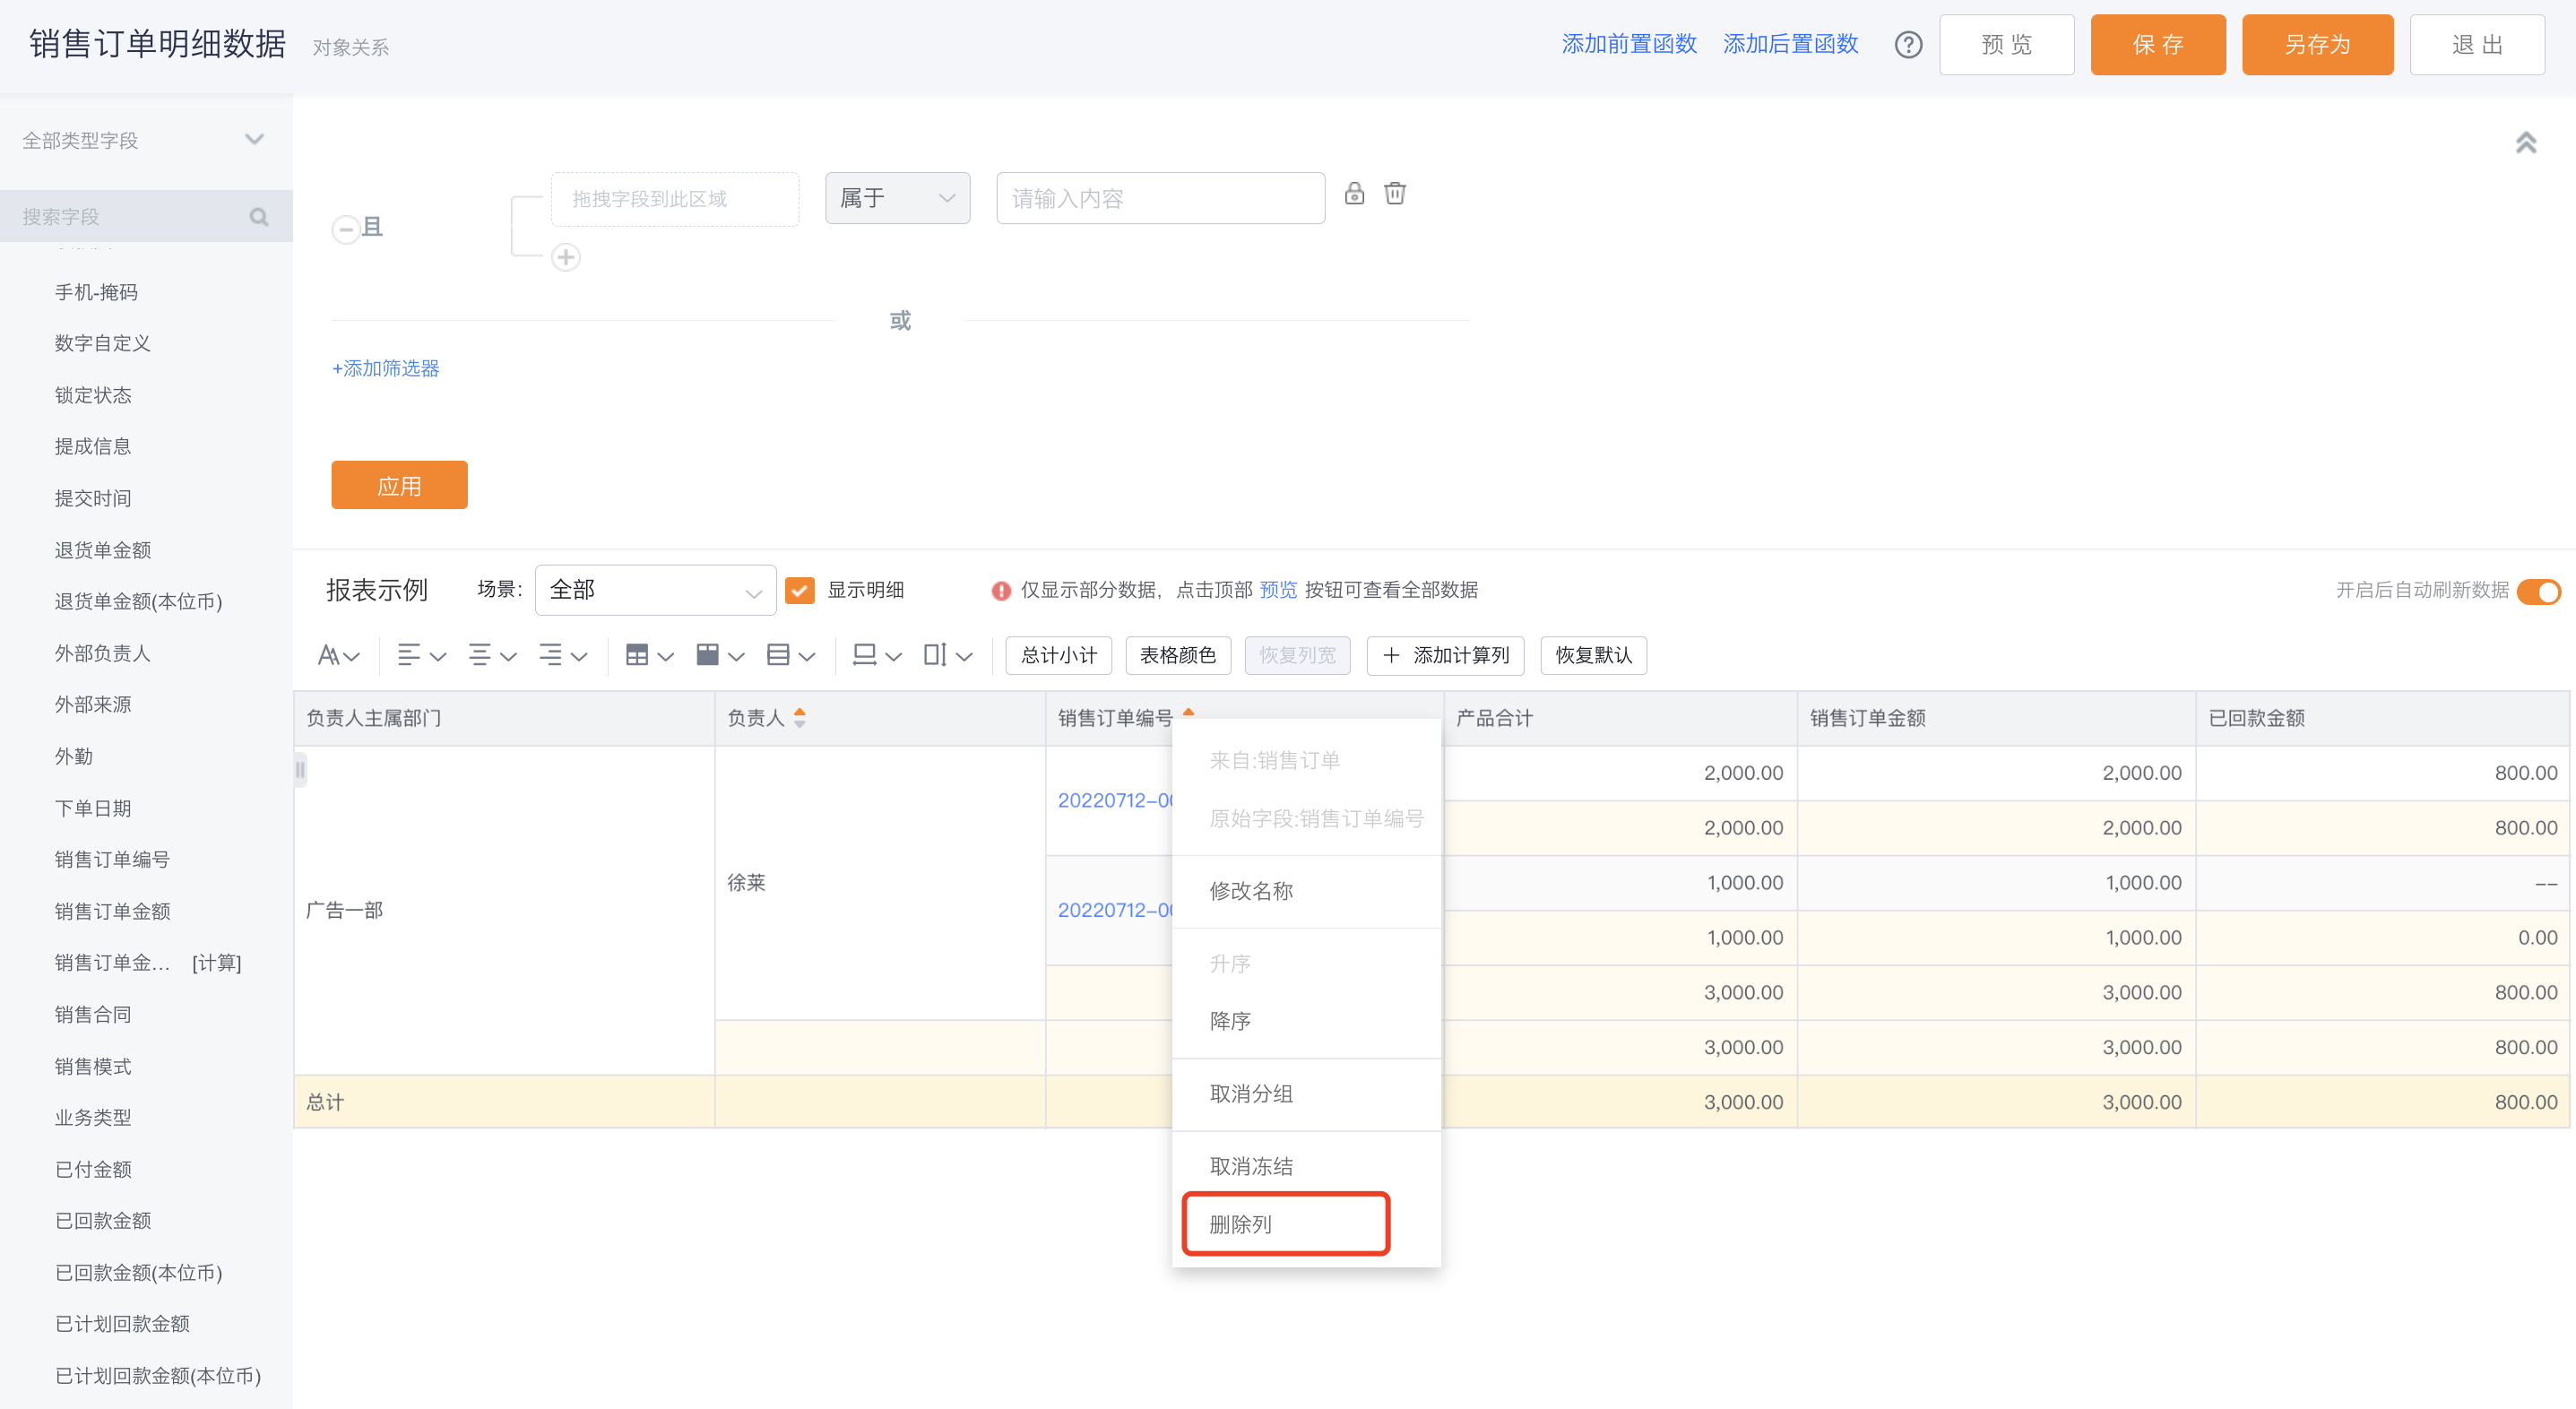
- Remove fields from the report:
- Option 1: Column header menu → Delete column;
- Option 2: Drag the field back to the fields pane — a confirmation dialog appears; click Confirm to delete.
 </img>
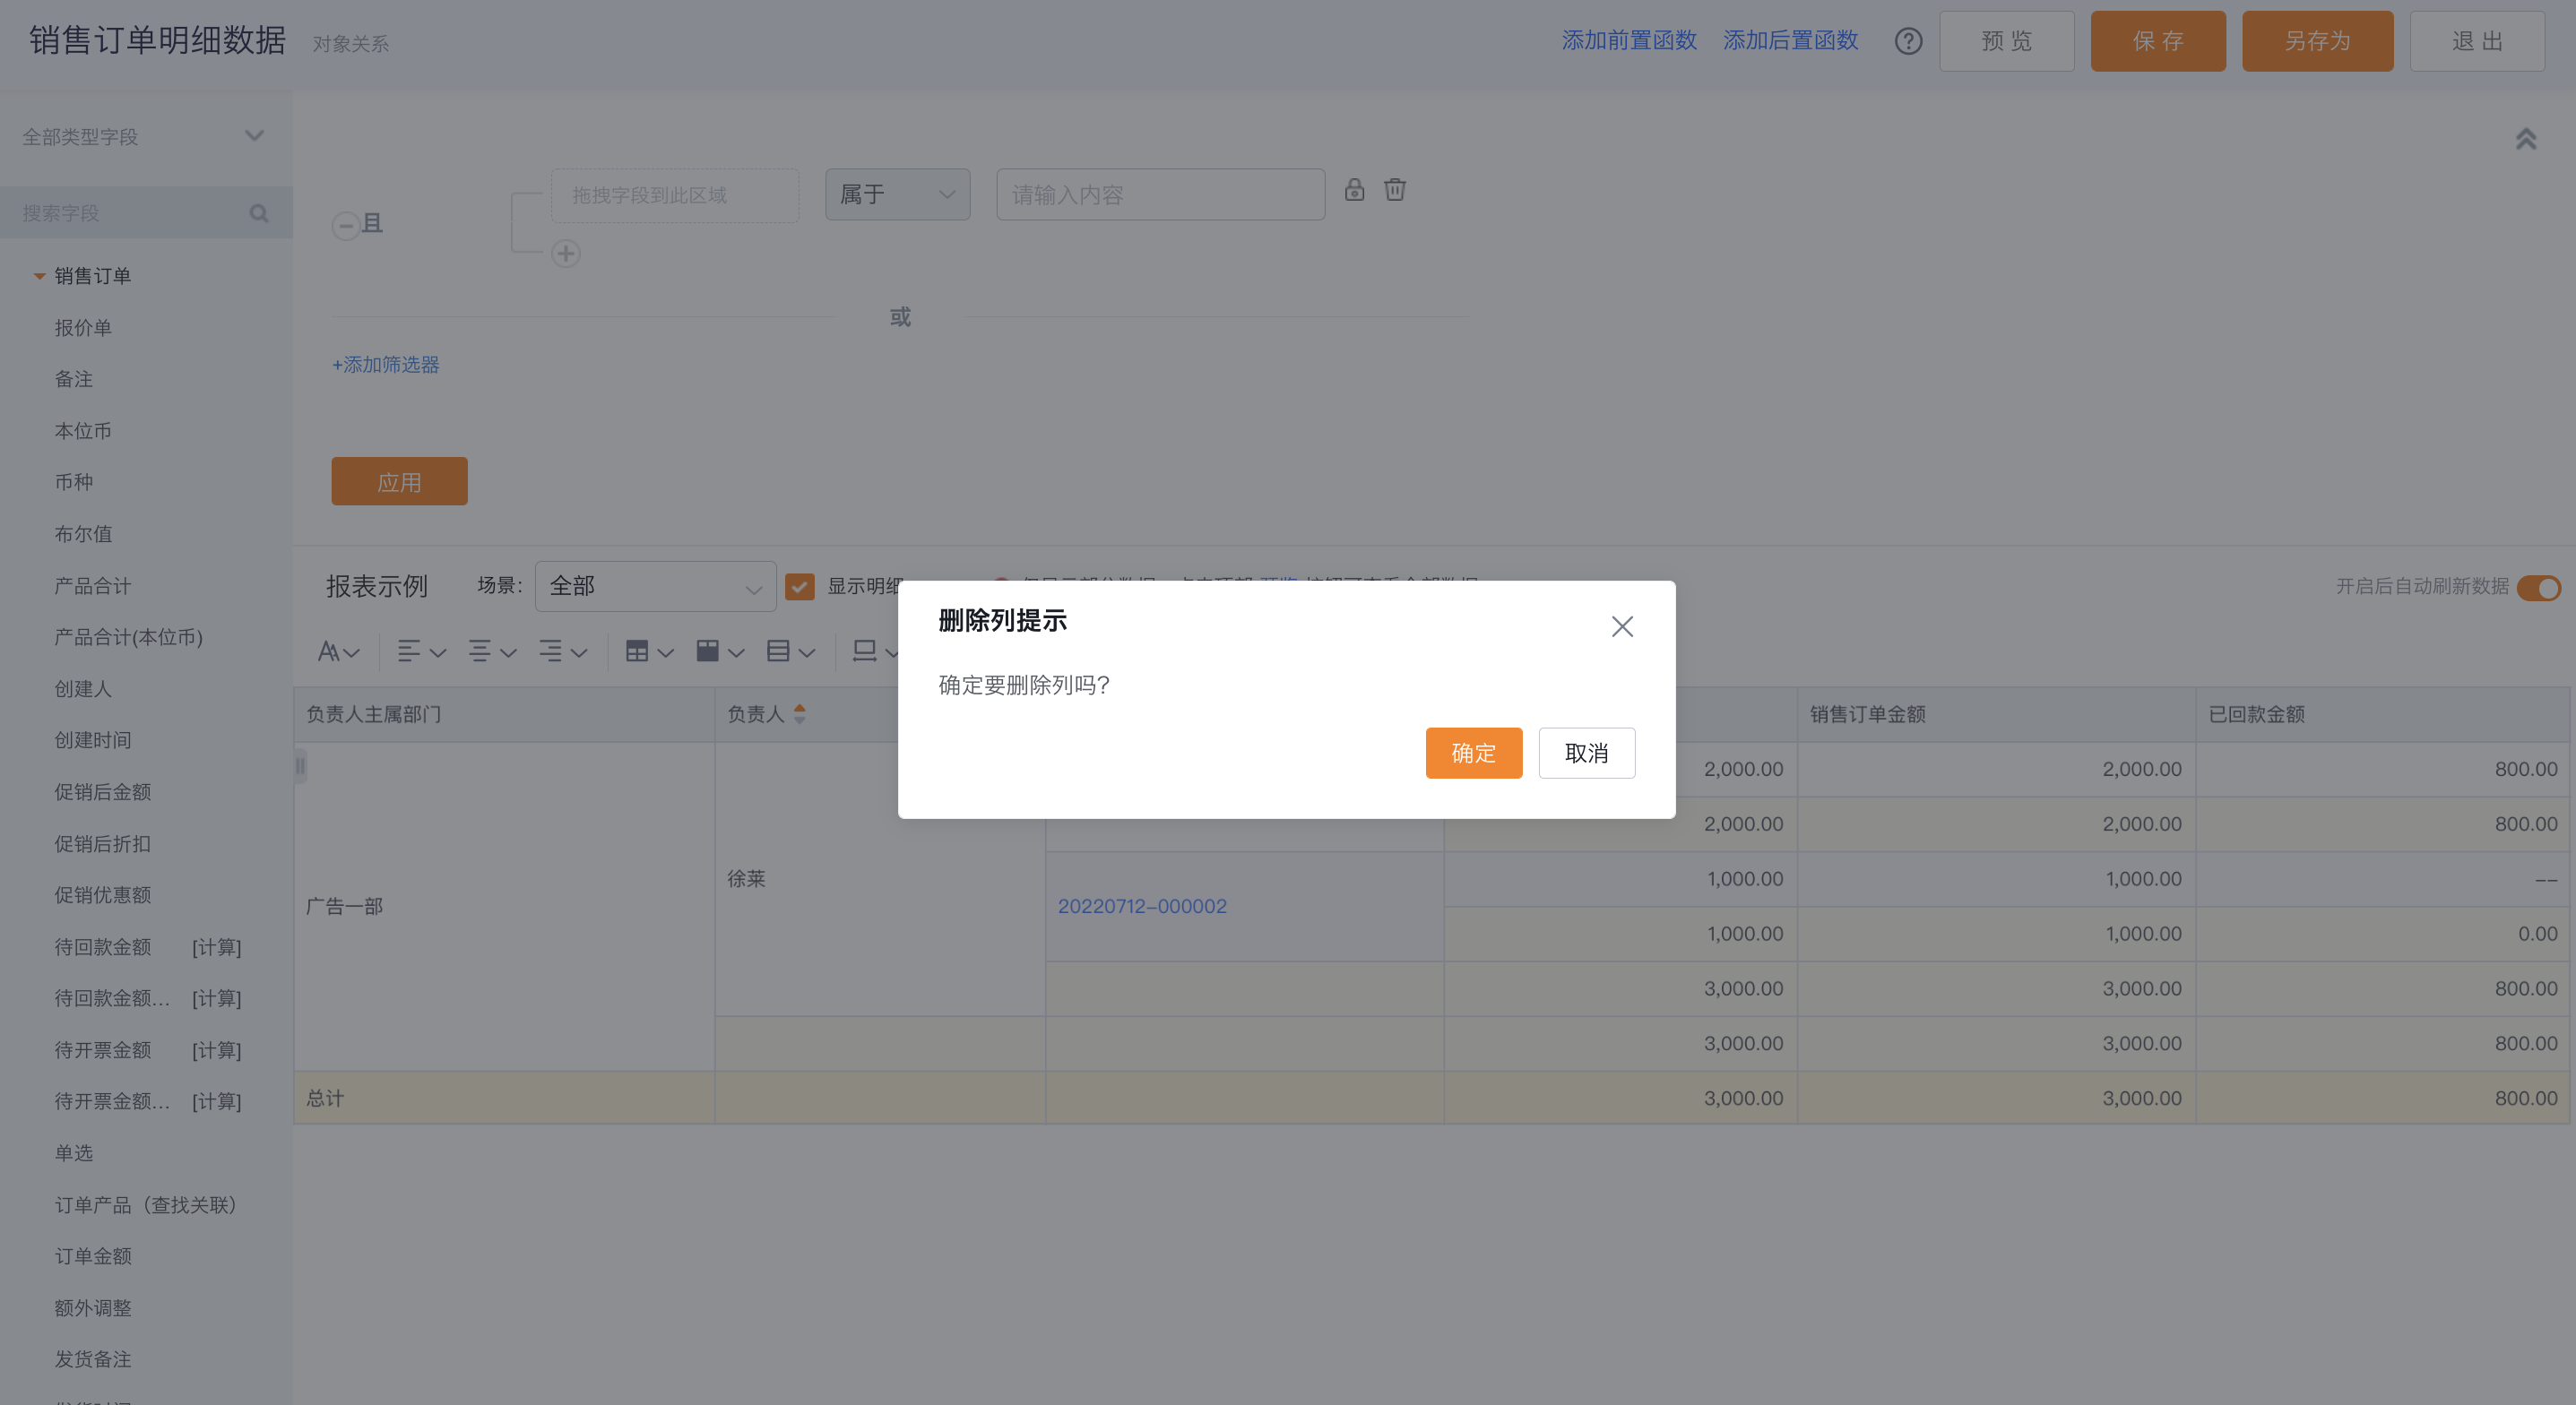 </img>
- Reorder columns: Drag a column; it will be placed to the right of the target position.
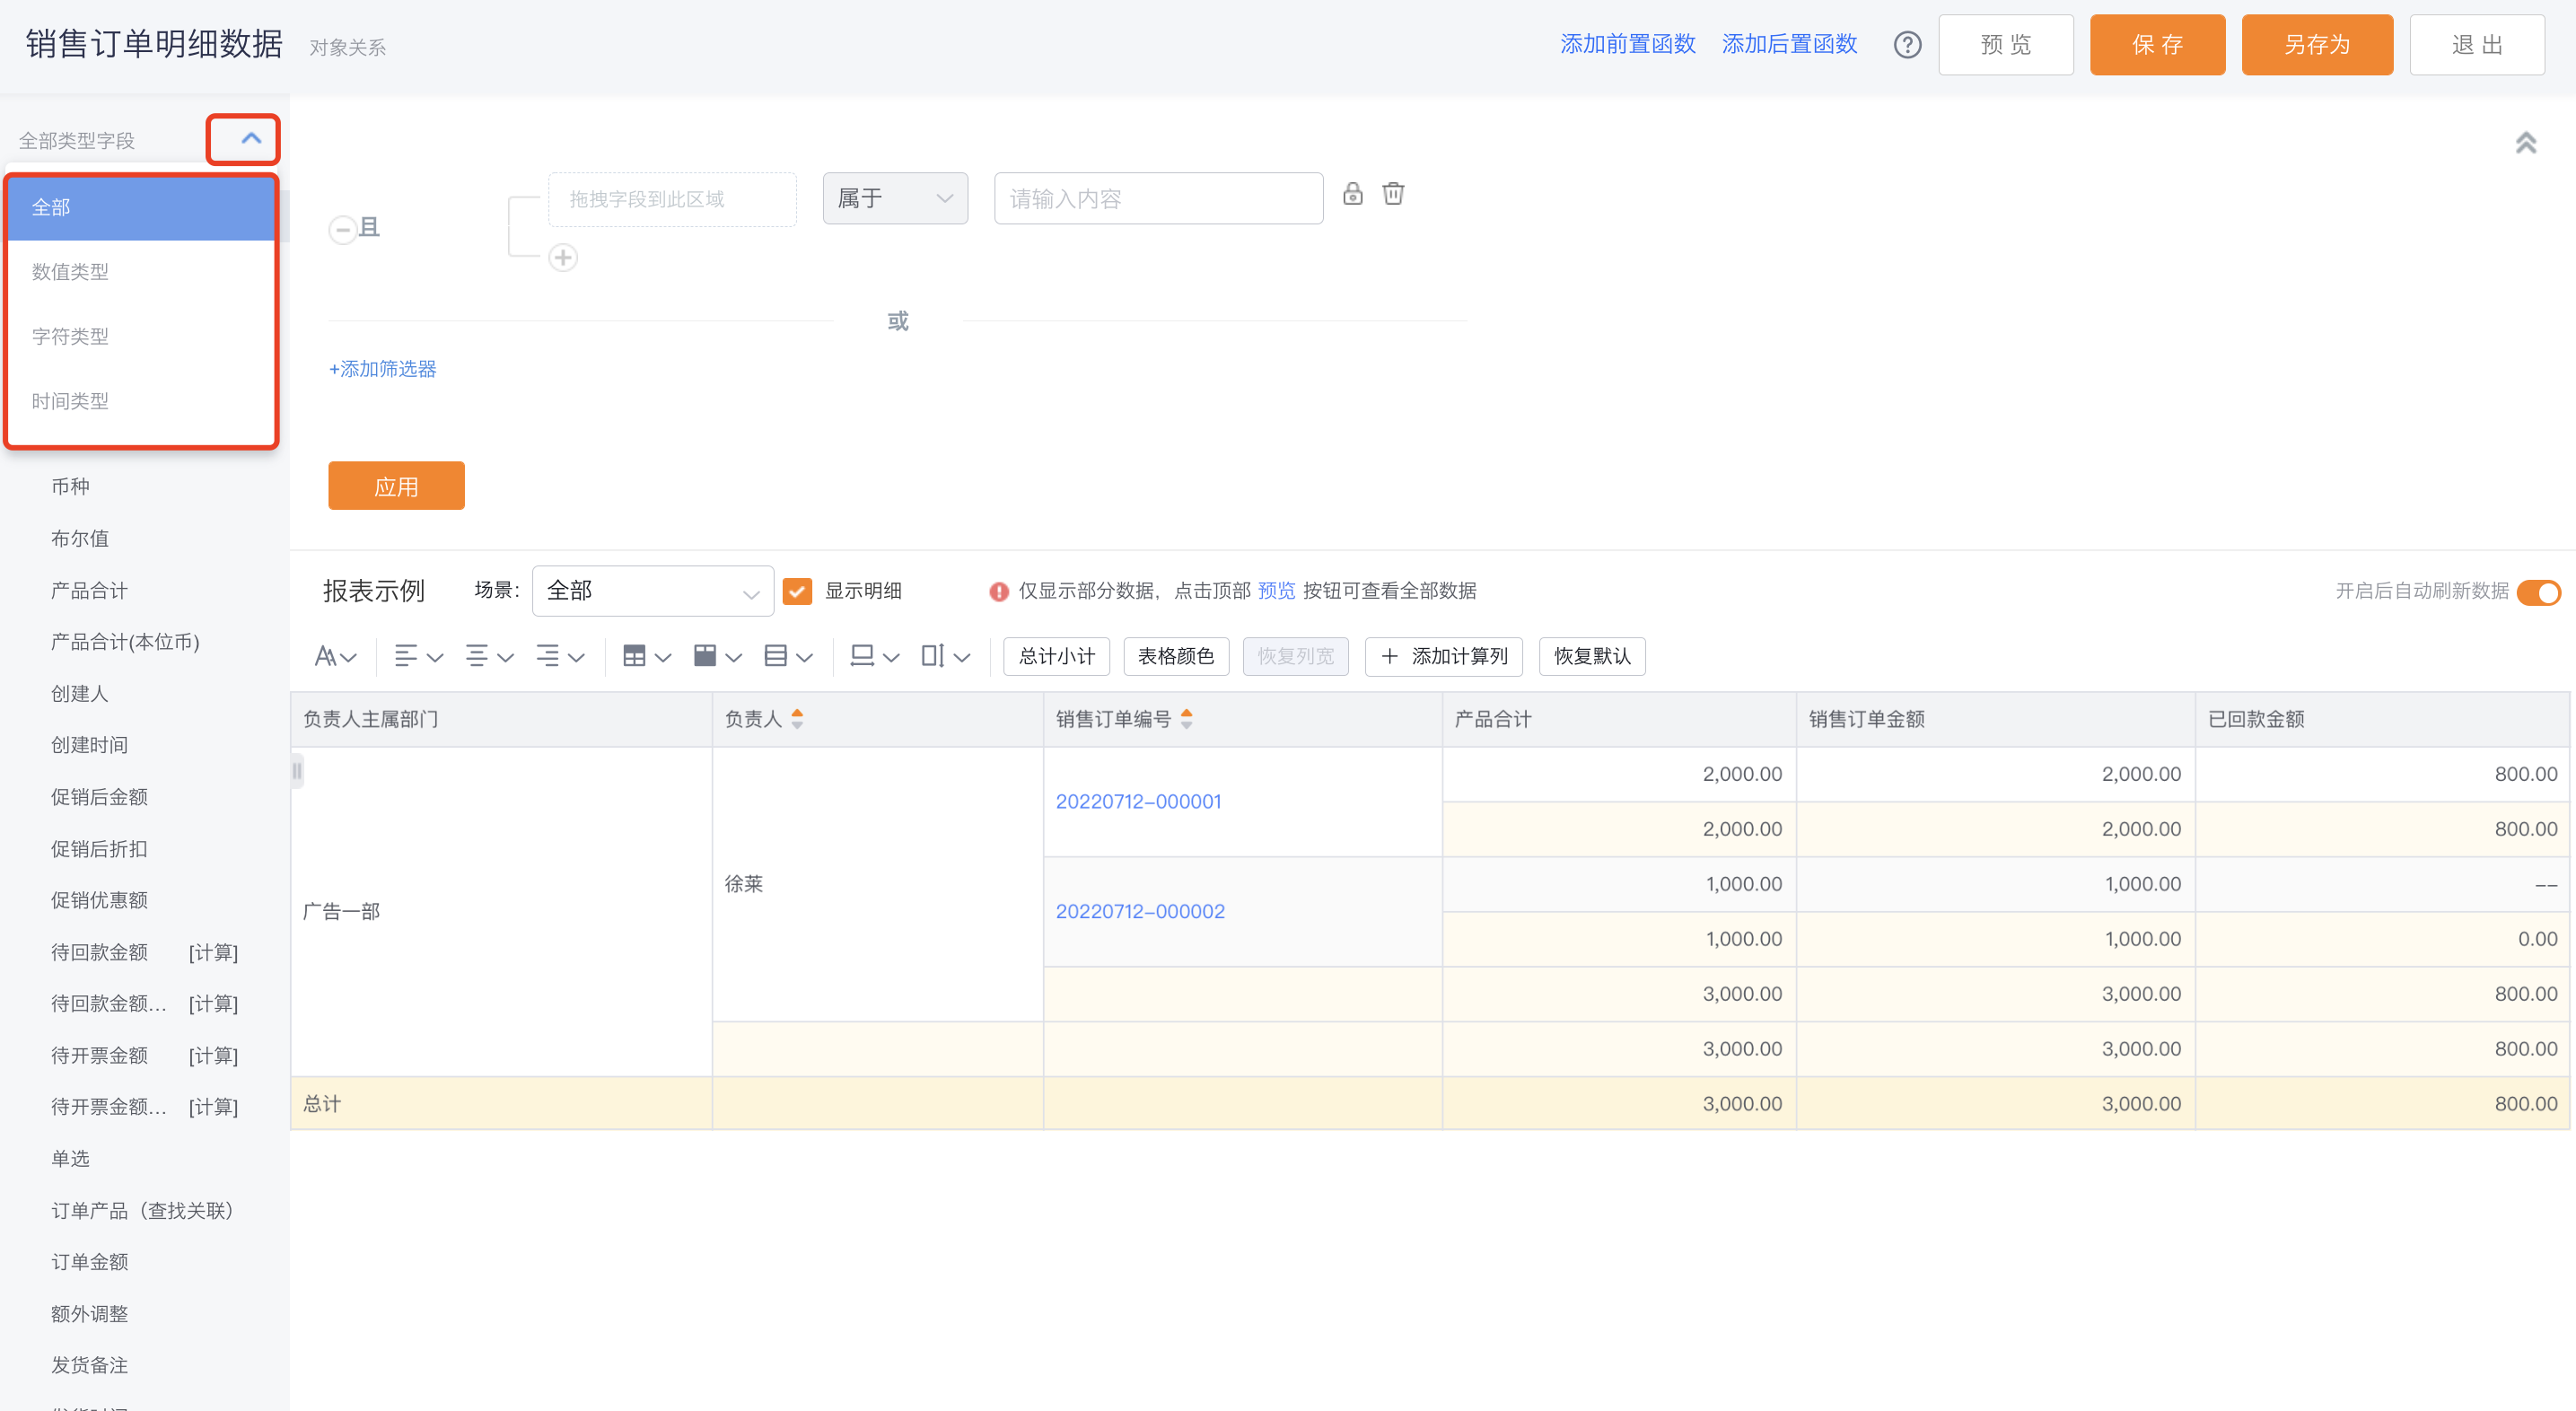
- Search fields: In the left fields pane you can filter by field type or enter keywords for fuzzy search.
 </img>
2.3 Column Settings
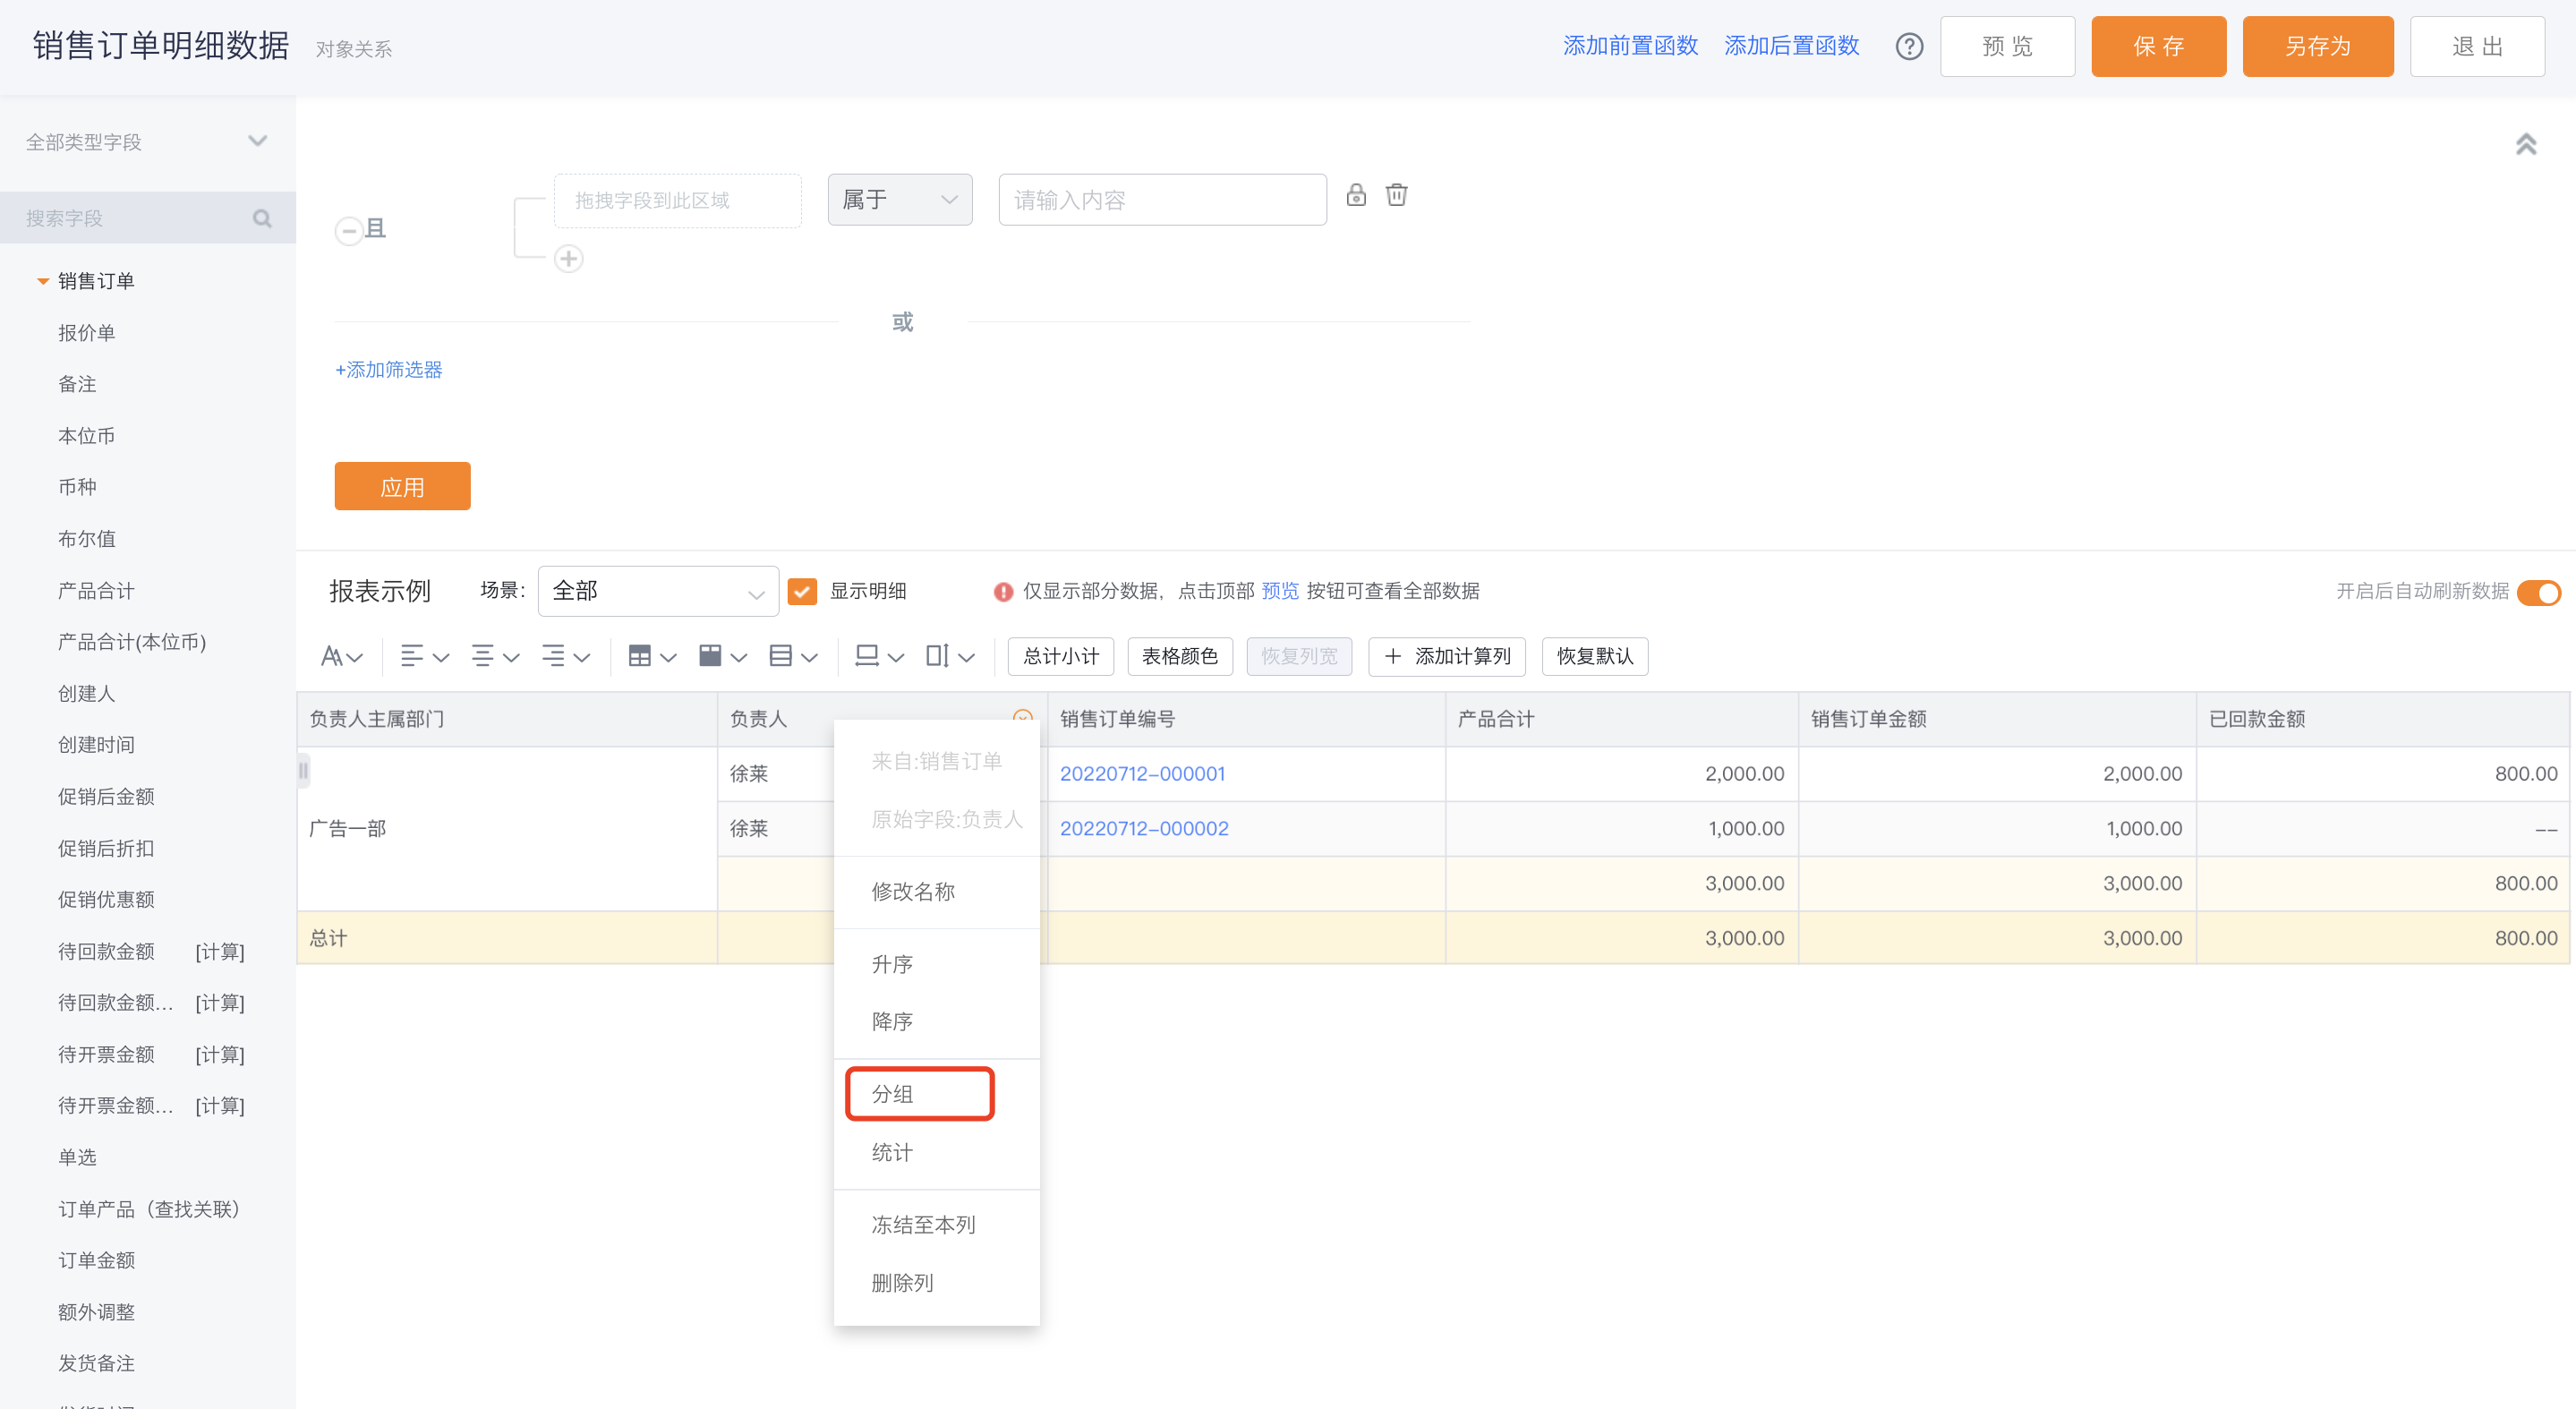
- Grouping: Configure from the column header menu; grouped rows are merged for display.
- If multiple group levels exist, later groups become lower-level groups by default; you can reorder group headers by dragging.
- Note: Up to five grouping levels are supported.
 </img>
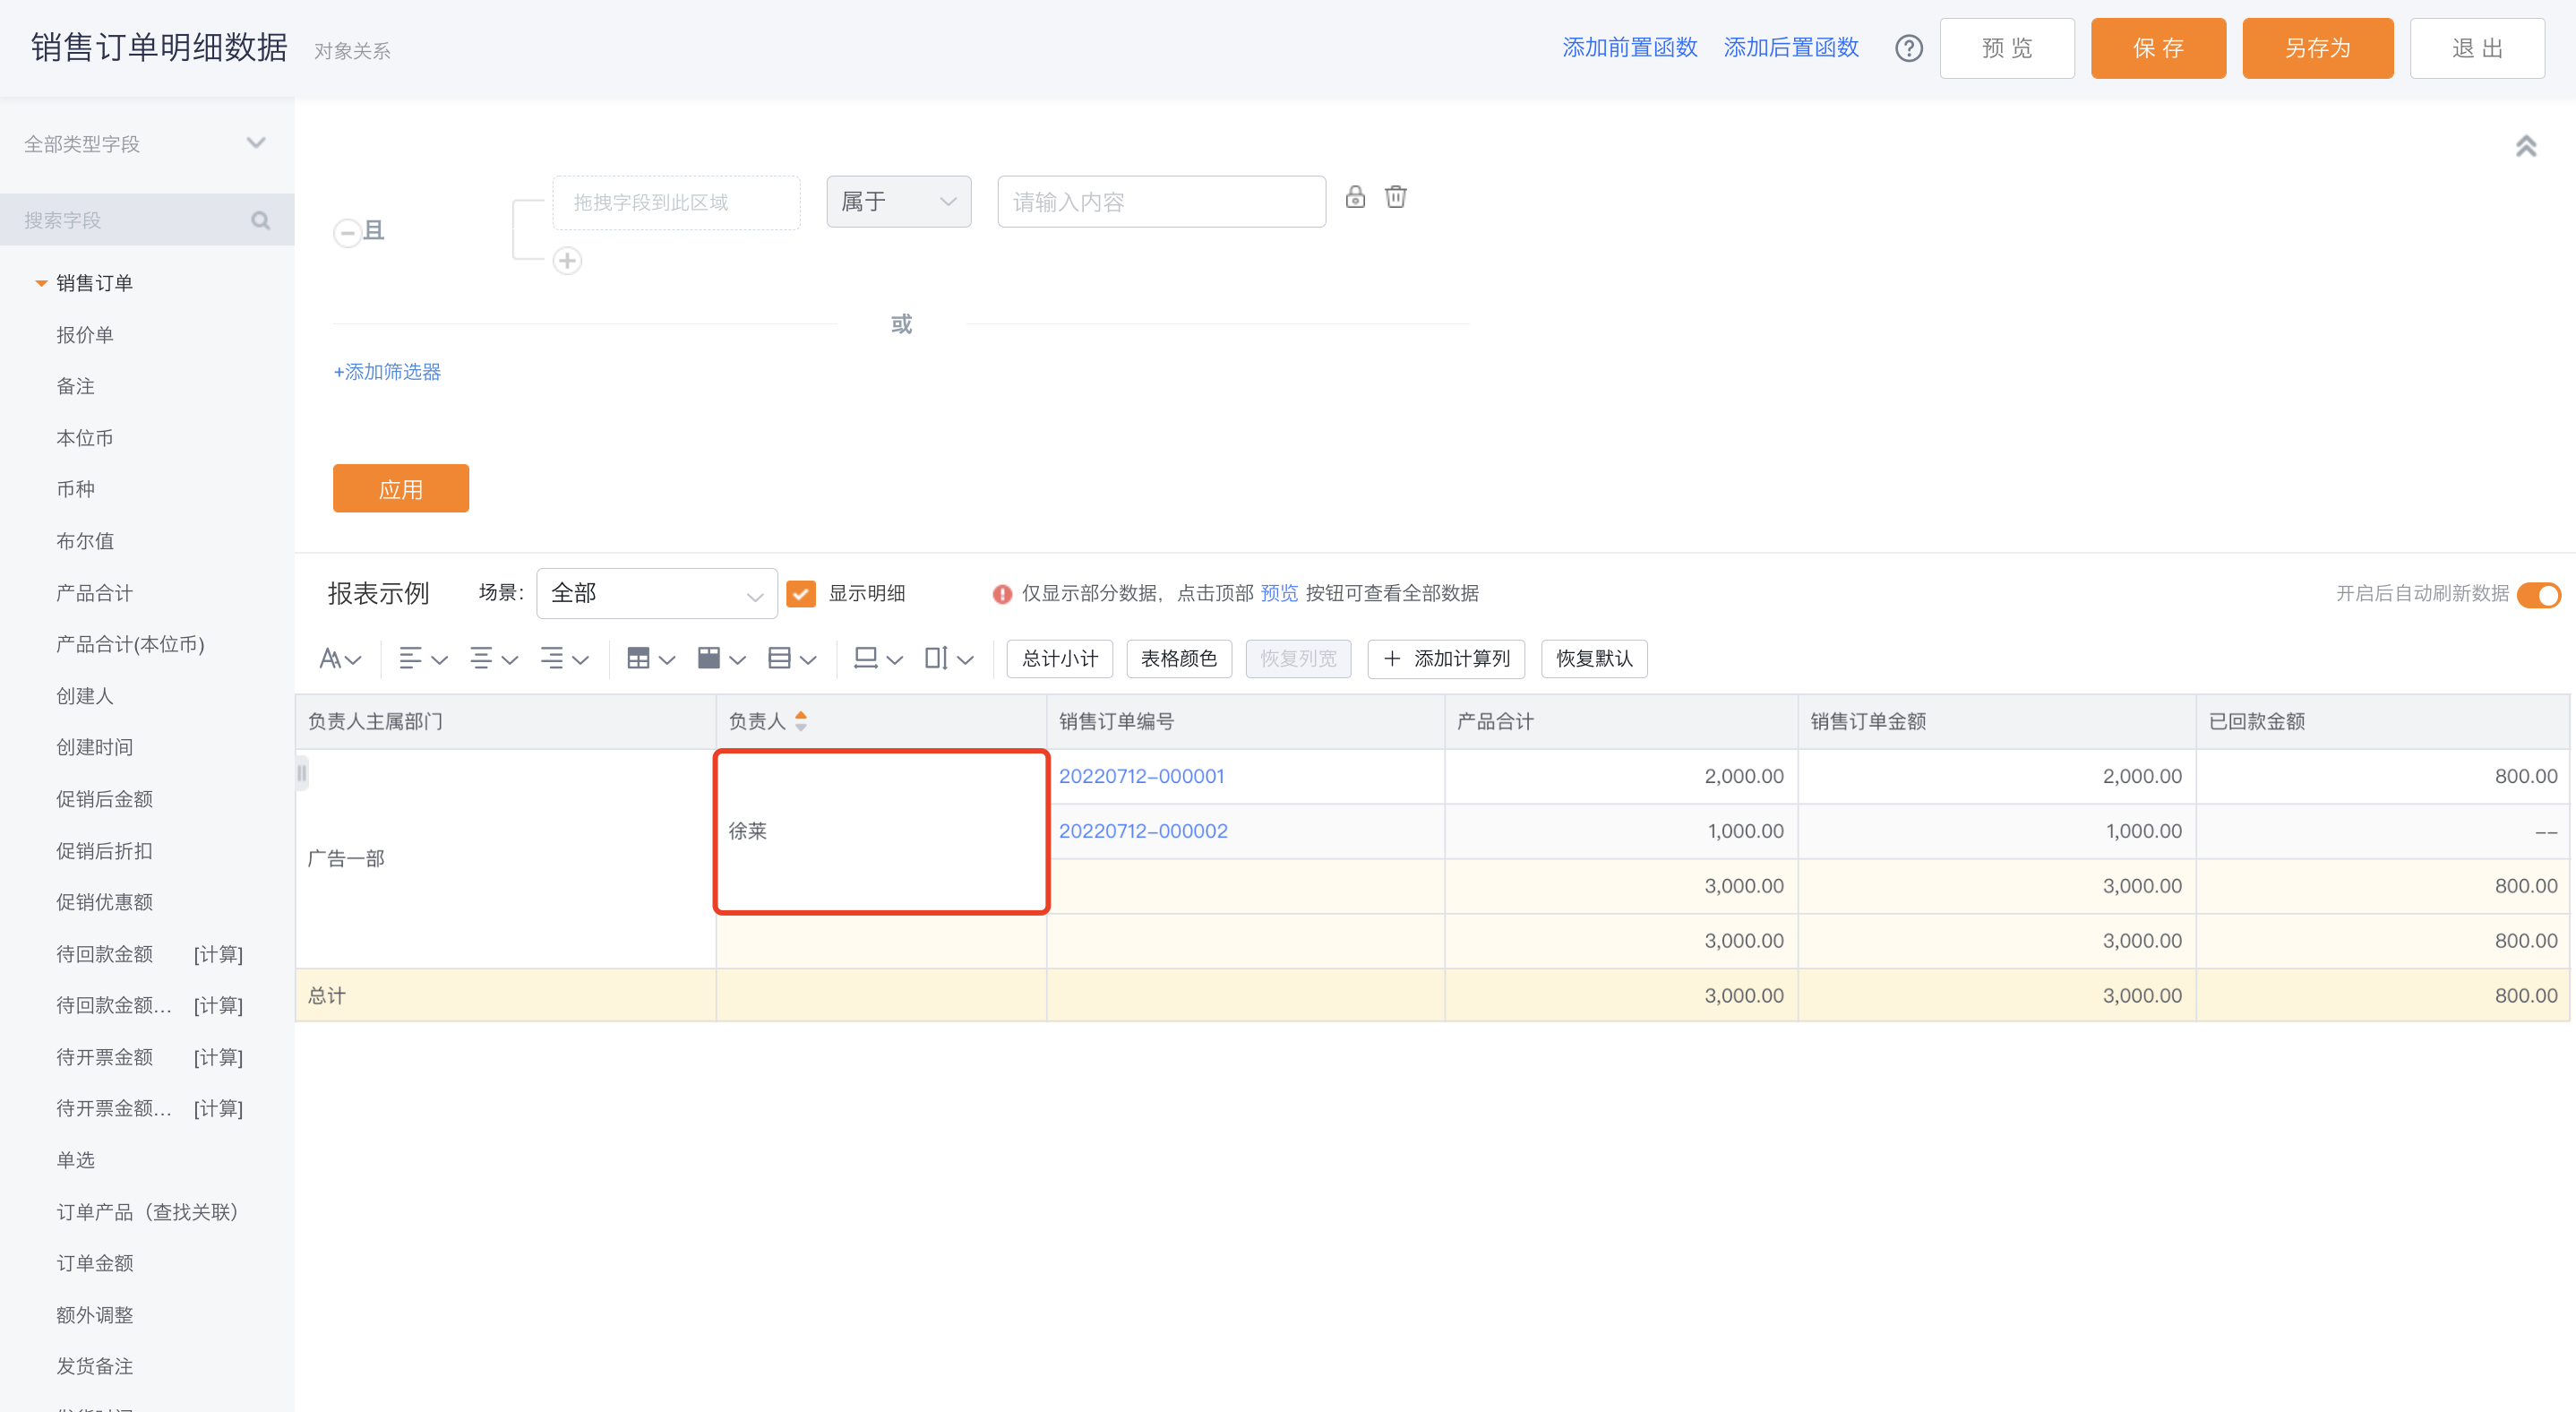 </img>
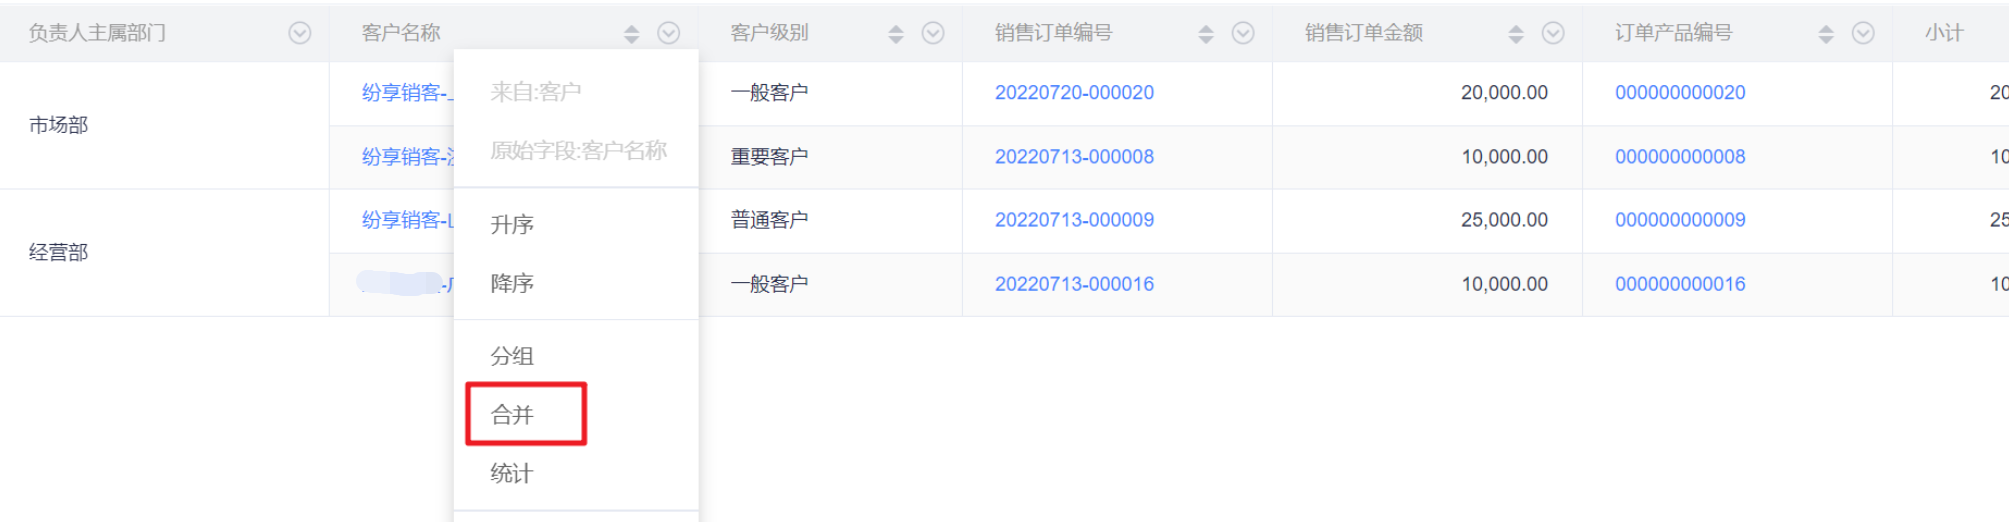
- Merge cells: When a one-to-many relationship causes repeated display of the "one" side, you can enable merge on the Primary Object's primary attribute from the column header menu. This consolidates repeated rows for the same record into merged cells (similar to Excel's merged cells), improving clarity.
 </img>
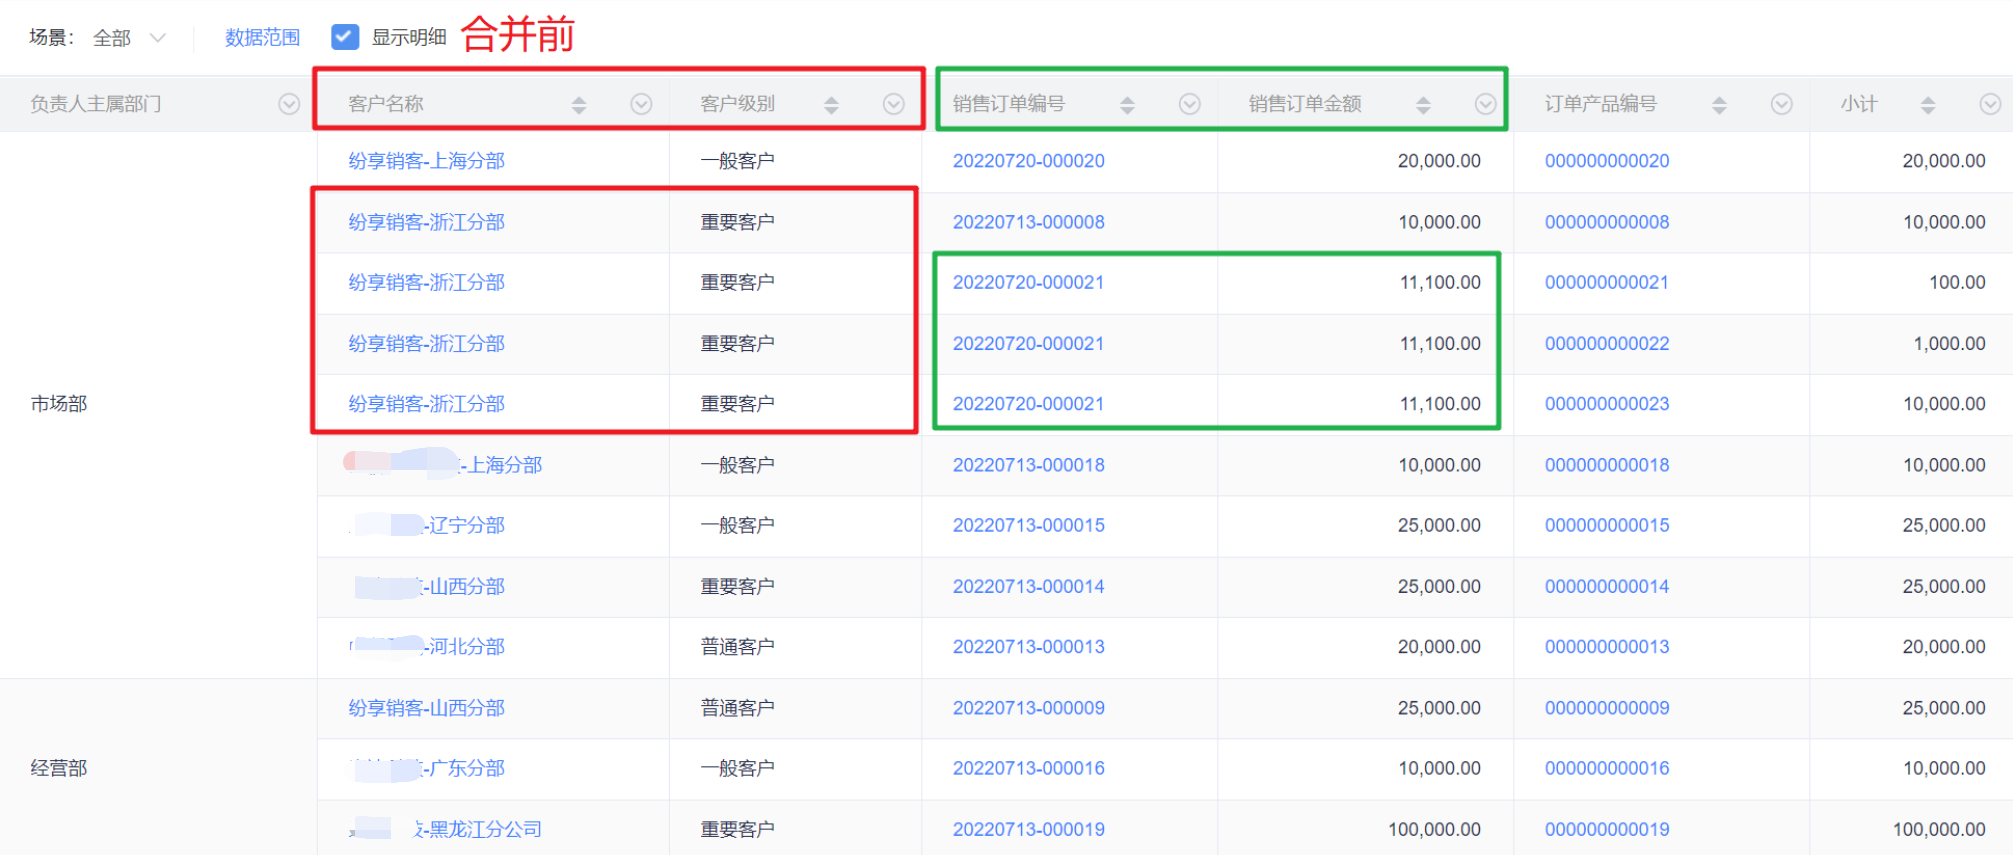
- Example: When analyzing Account and Sales Order together, an Account with multiple Orders repeats the Account row. Similarly, when an Order has multiple Order Products, the Order repeats. In the report editor, enable Merge on Account Name to show a single merged Account row; enable Merge on Sales Order Number to consolidate repeated Order rows.
 </img>
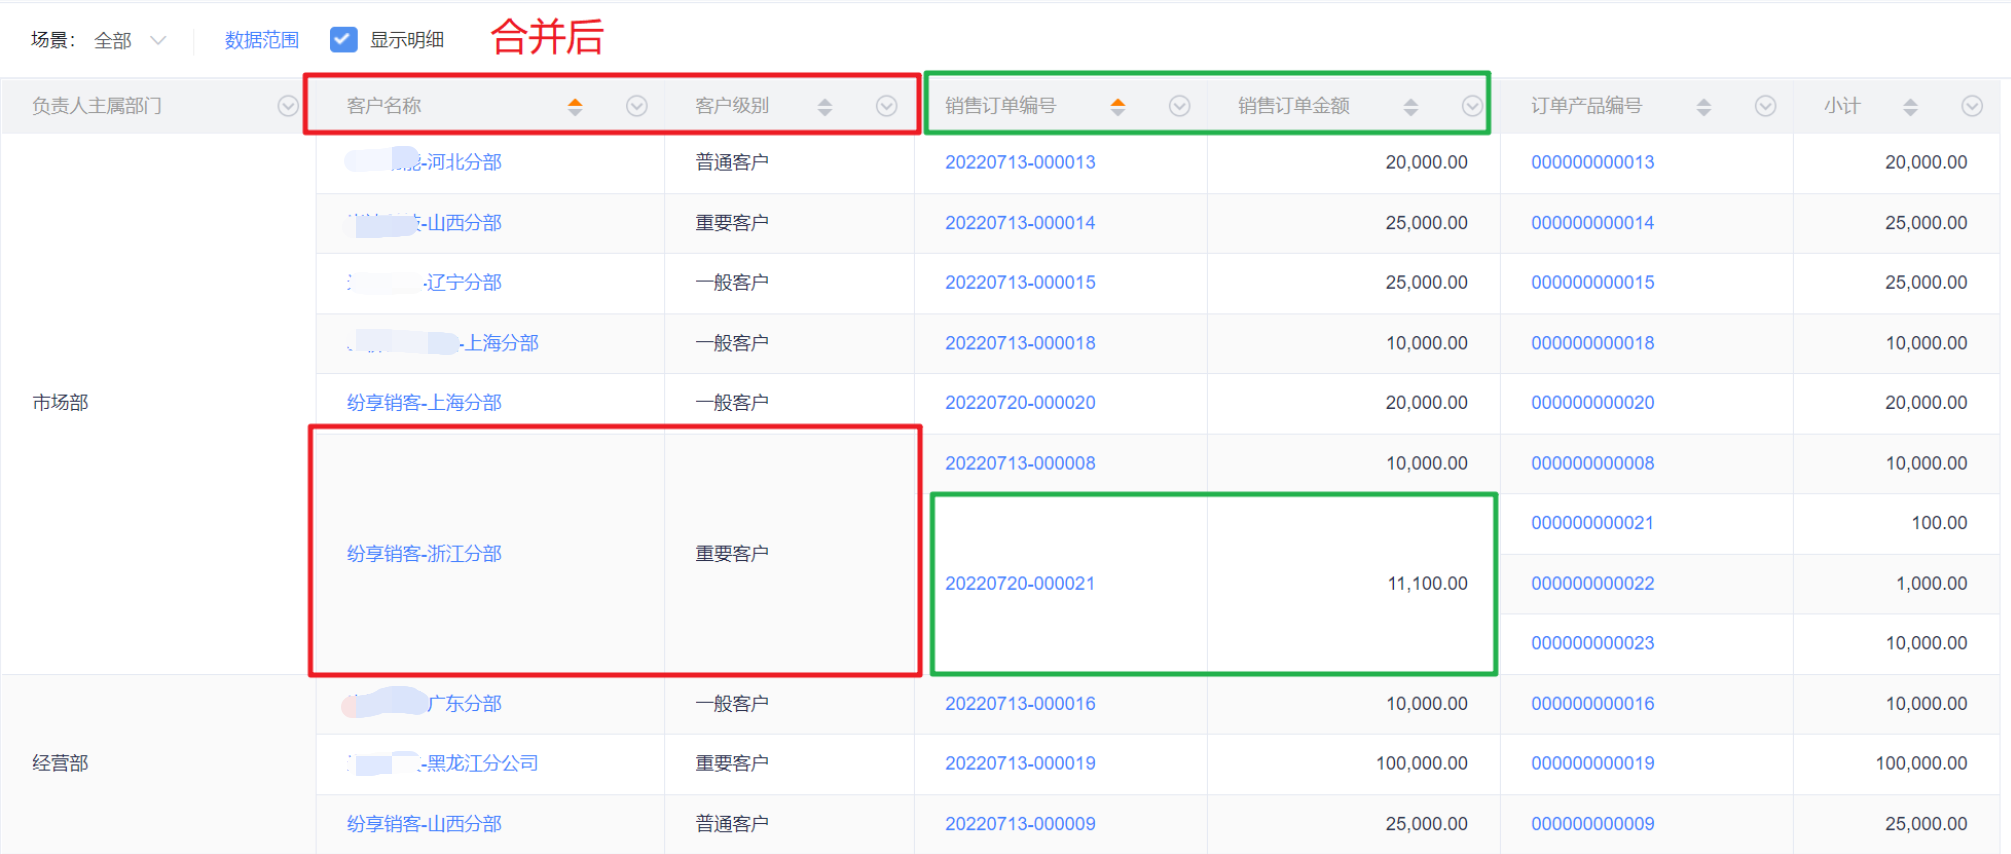 </img>
- Grouping vs. Merging — comparison:
| Difference | Grouping | Merging |
| Problem solved | Group identical values and perform aggregations (sum, count, etc.) across groups | In one-to-many relationships, merge repeated rows of the same record for display only |
| Configuration entry | Any field | Only fields of the "one" side in one-to-many relationships |
| Same record? | Groups identical values even if record IDs differ | Merging only consolidates rows for the same record ID; identical values with different IDs are not merged |
| Aggregation rows (subtotal/total) | Grouping adds aggregation rows | No aggregation rows |
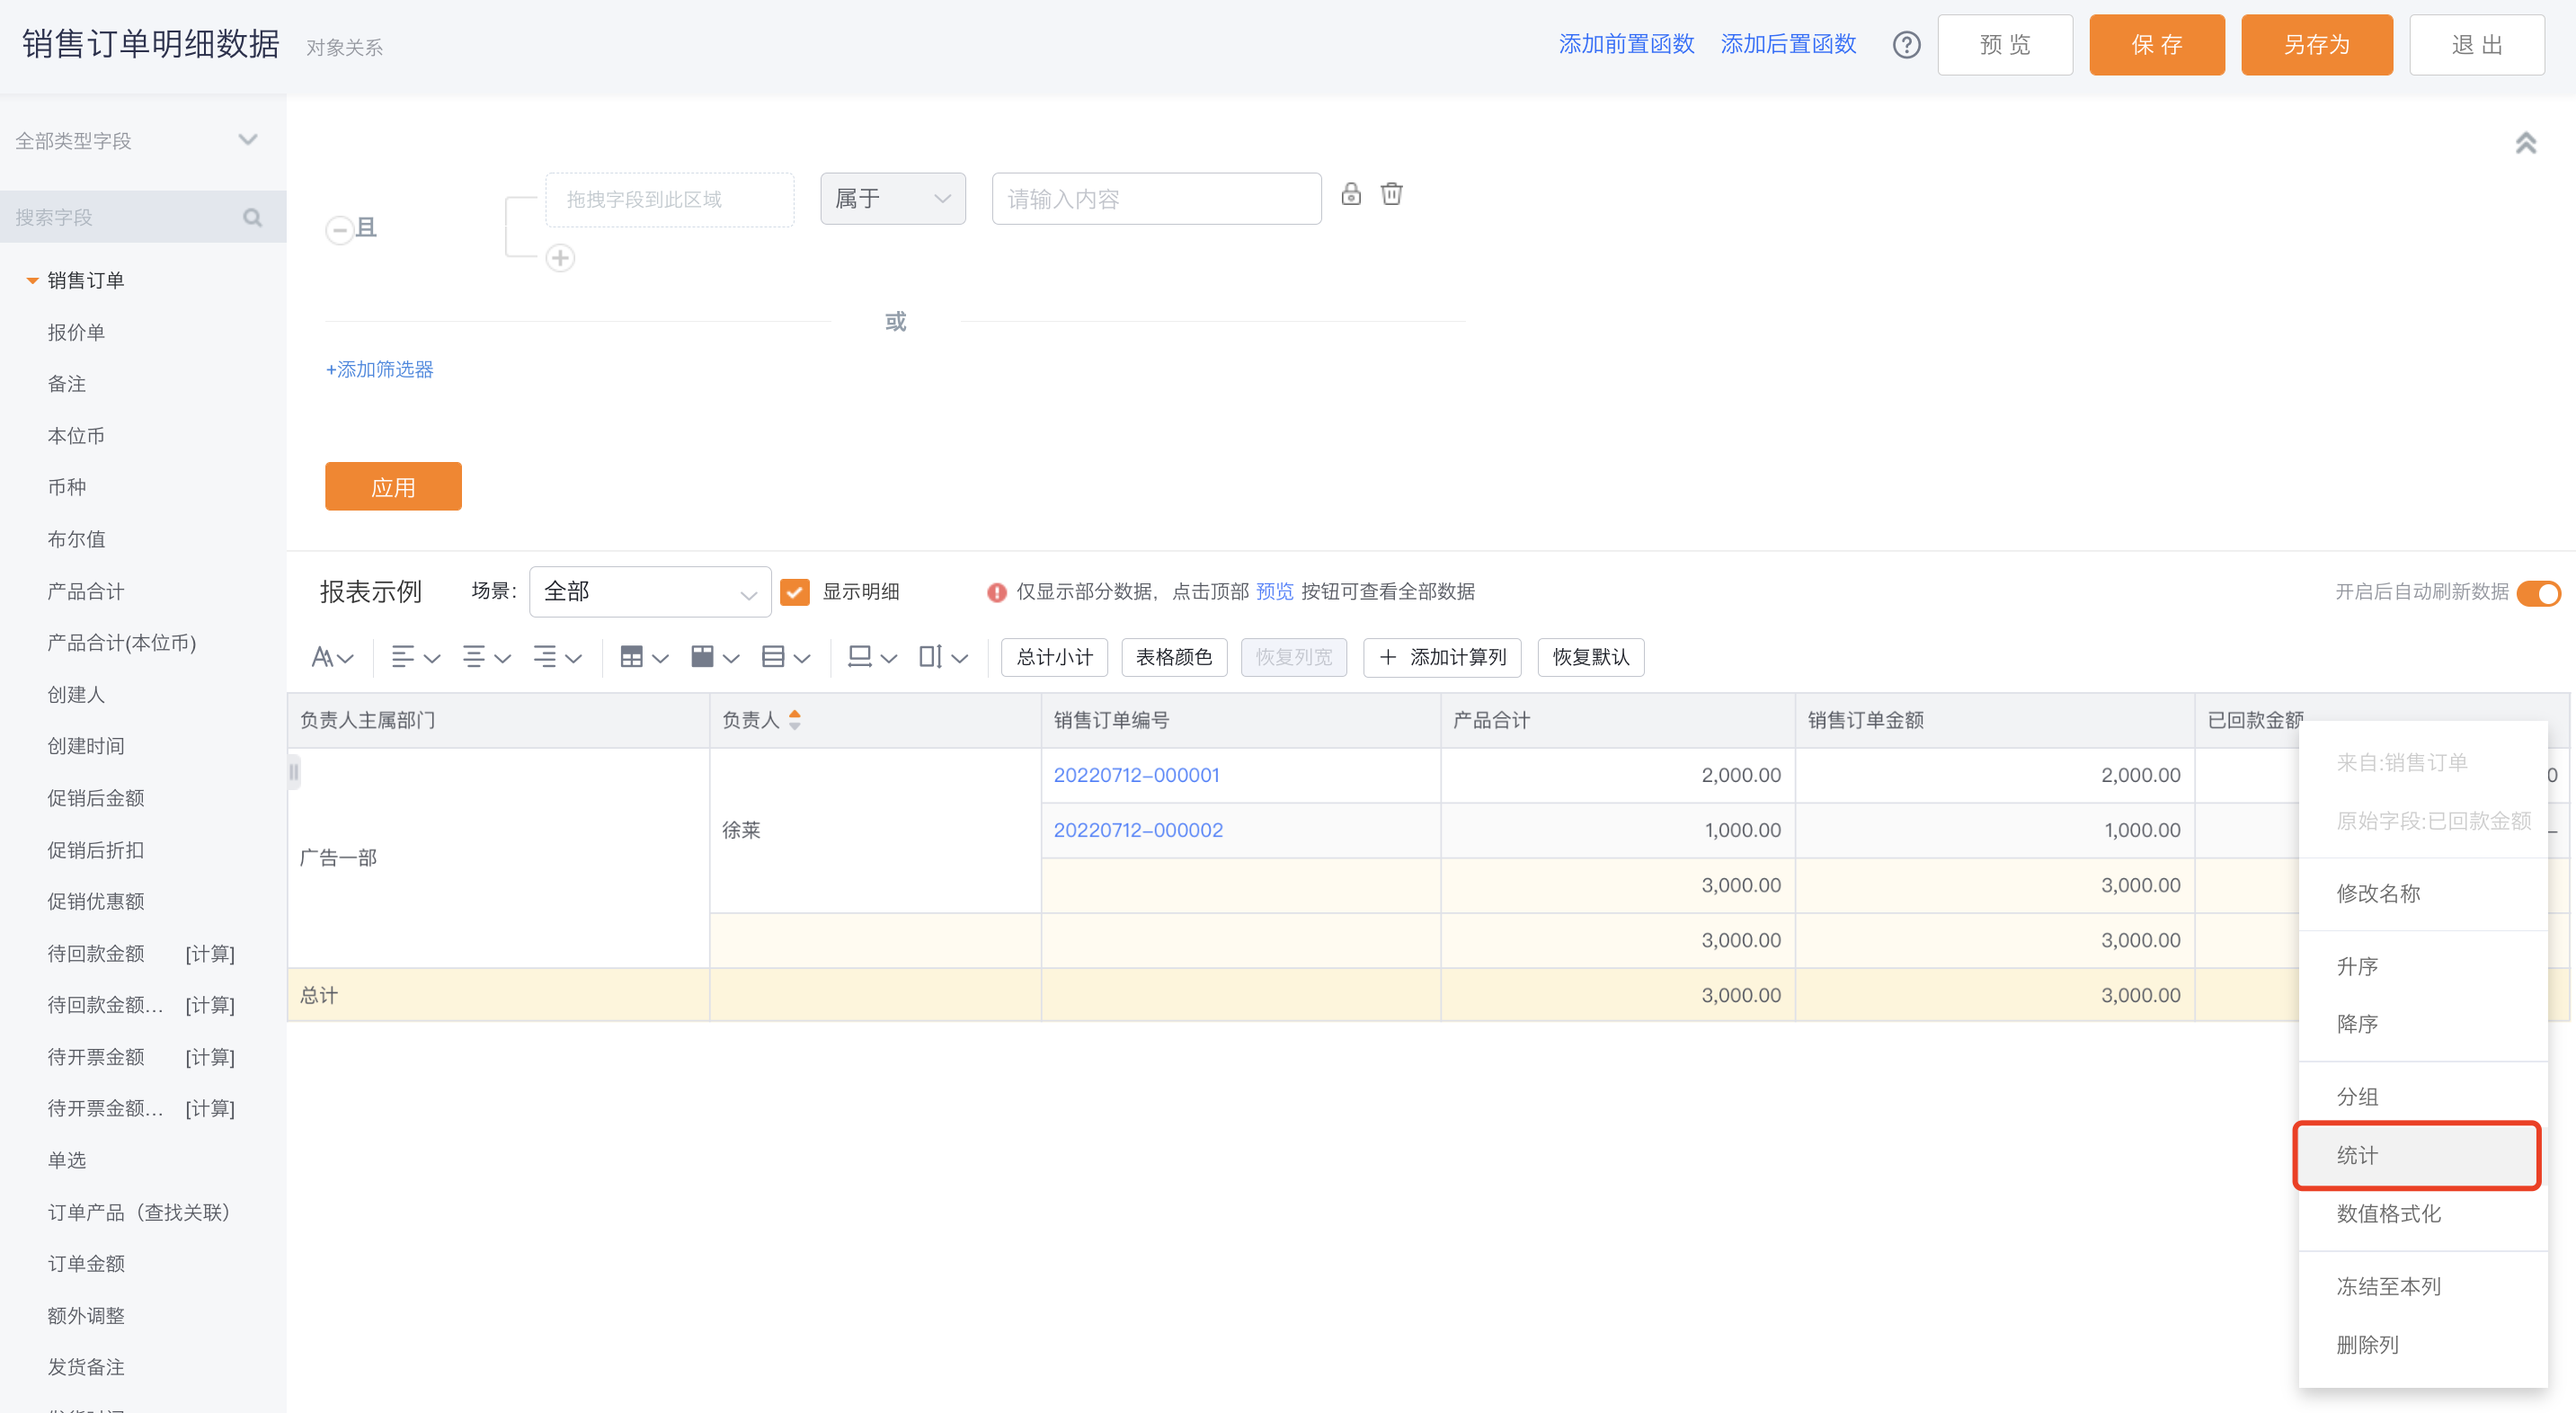
- Aggregation: Configure from the column header menu. Aggregation is calculated per grouping level.
 </img>
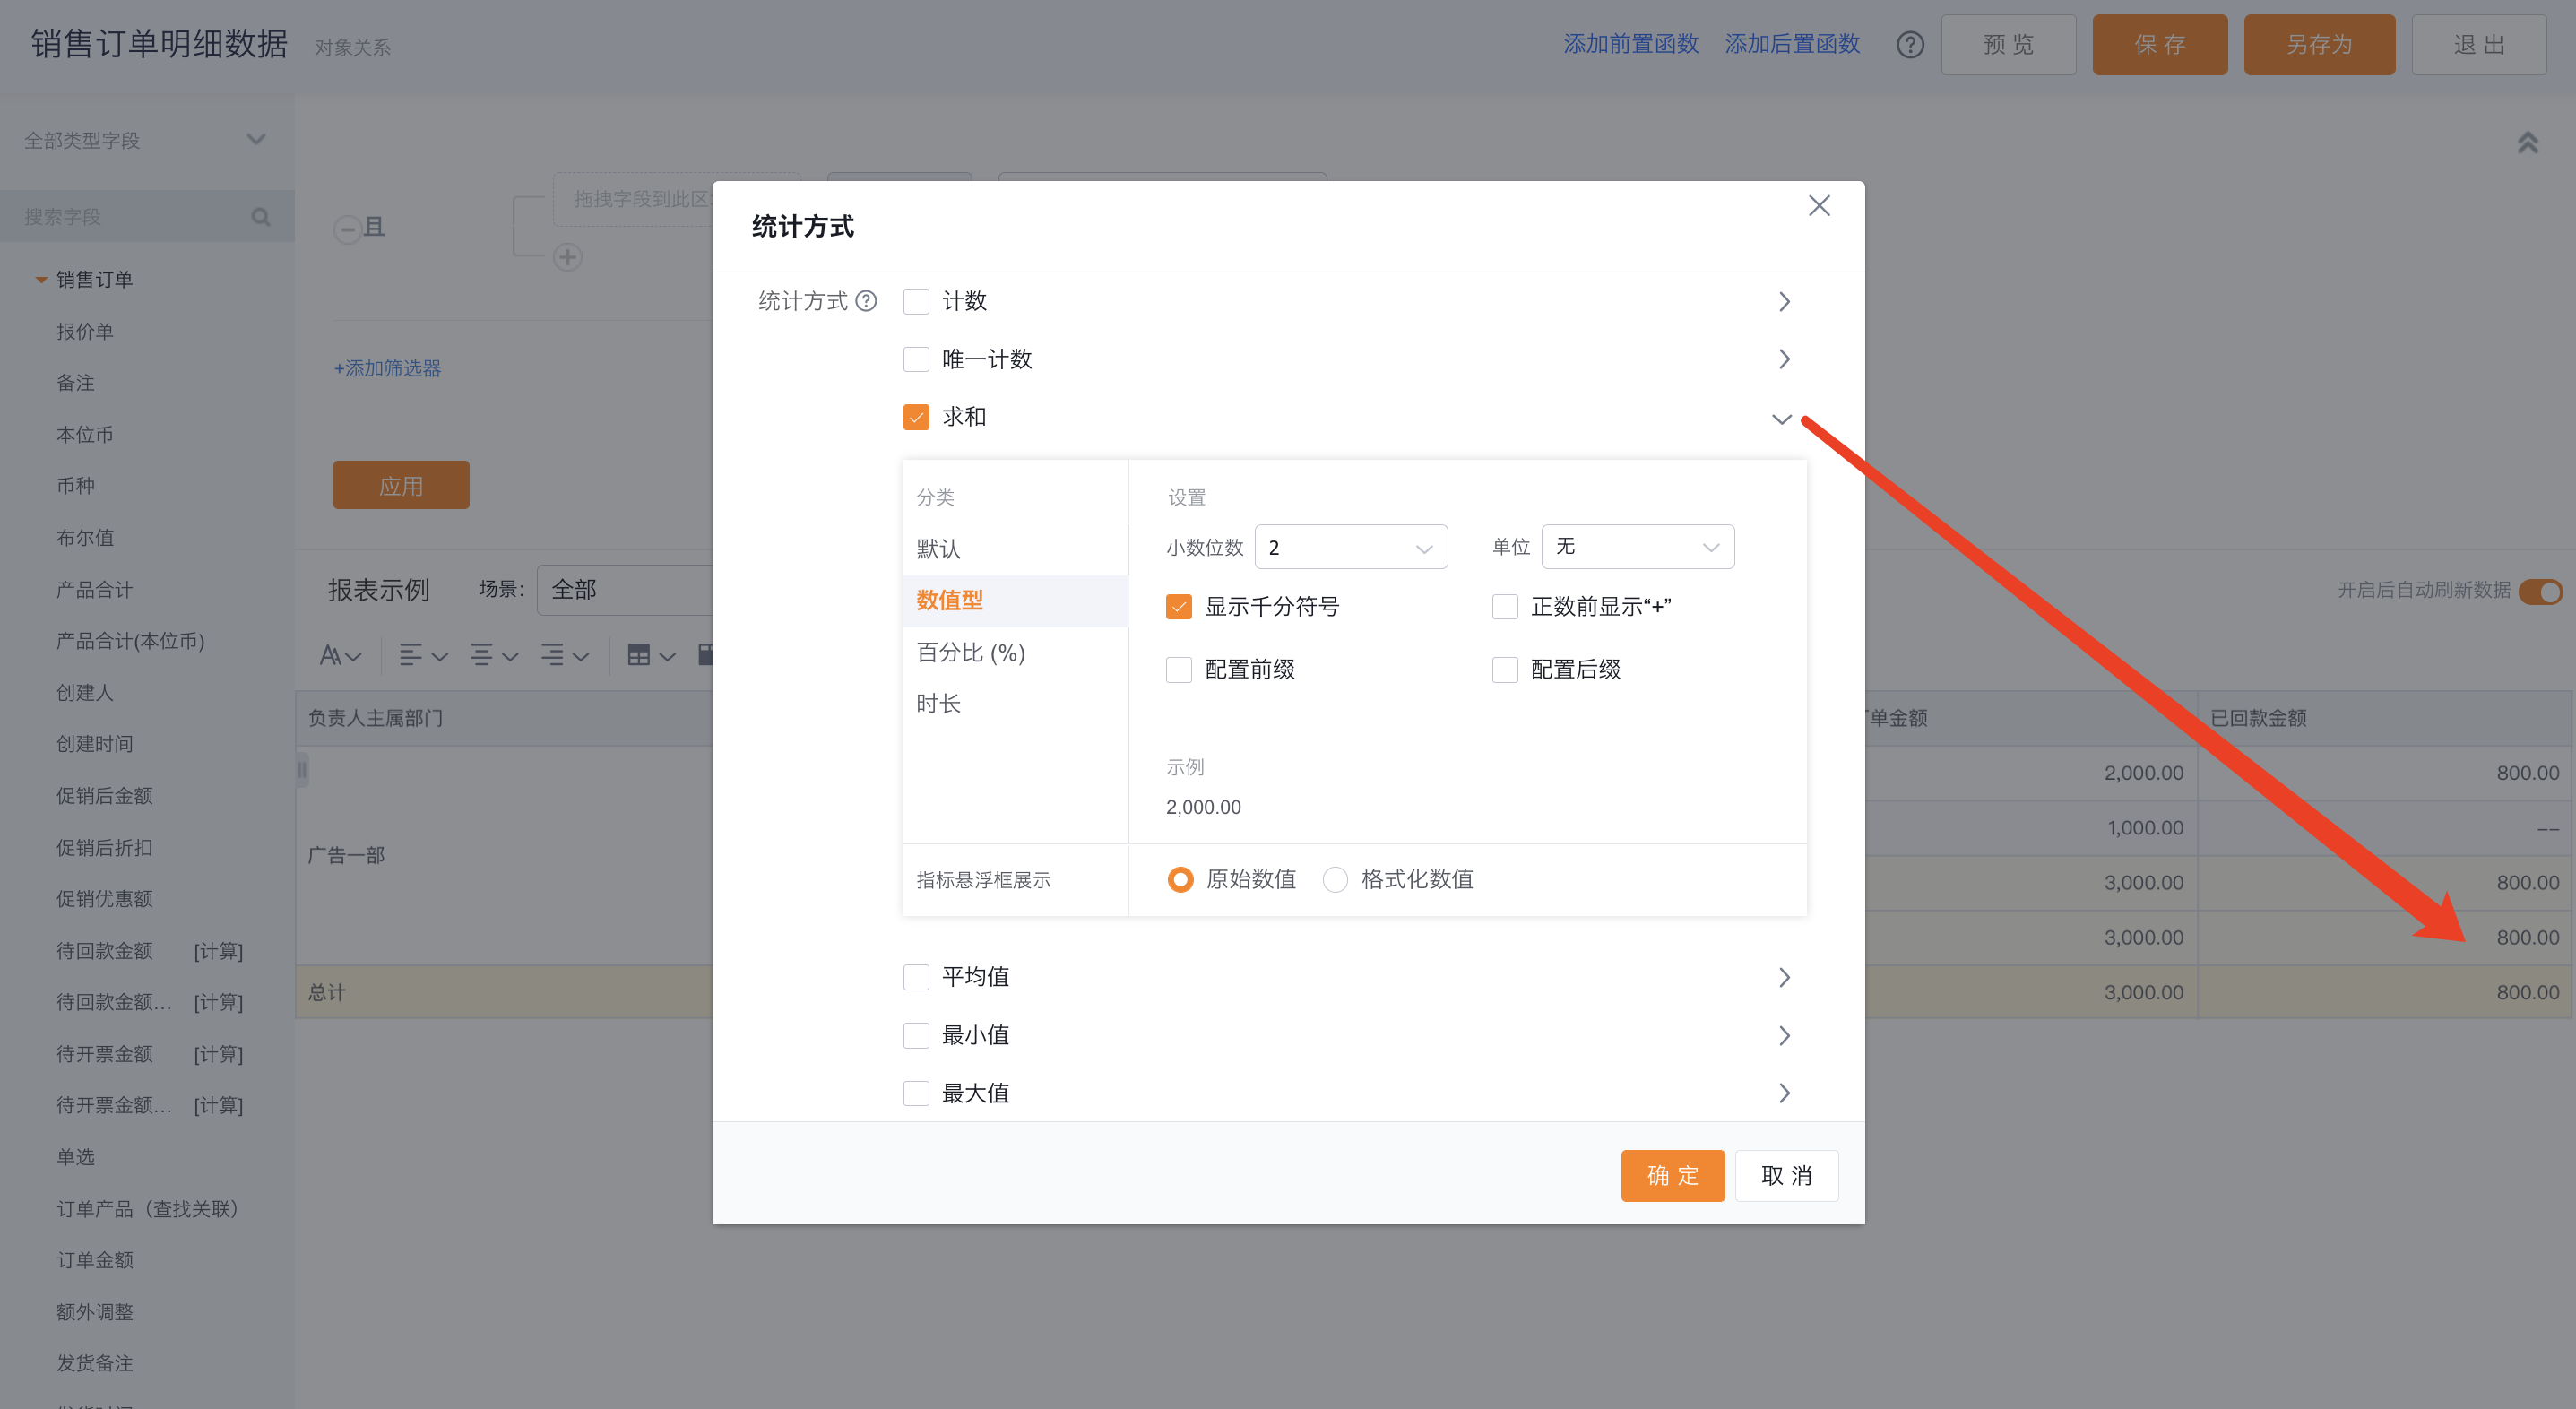 </img>
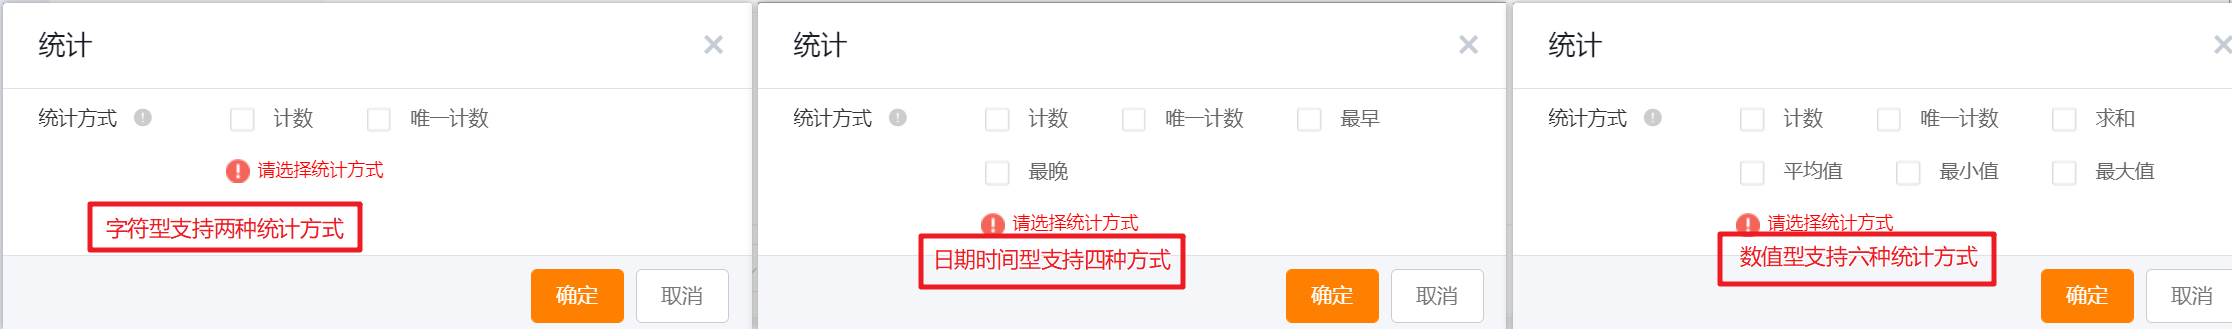
- Available aggregation methods vary by field type.
 </img>
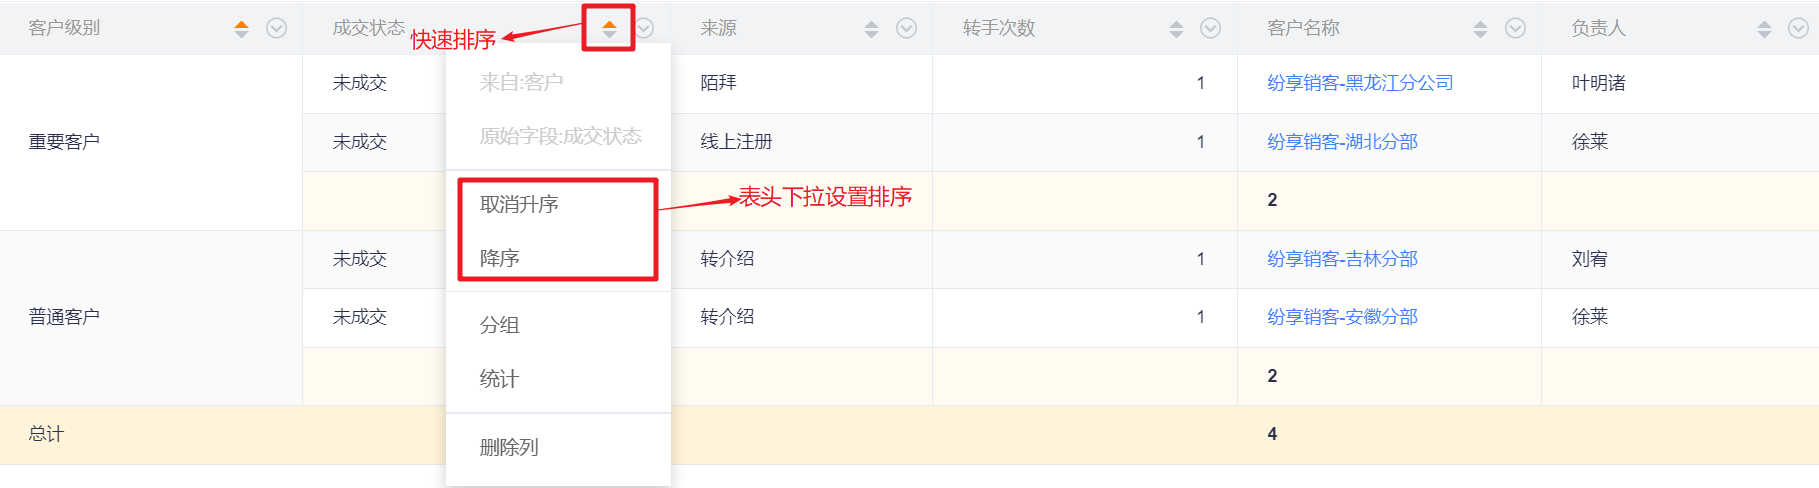
- Sorting:
- Use the column header menu to set ascending, descending, or clear sorting.
- Click the column header to toggle ascending/descending quickly.
- Note: Grouped fields cannot clear sorting; they default to ascending.
 </img>
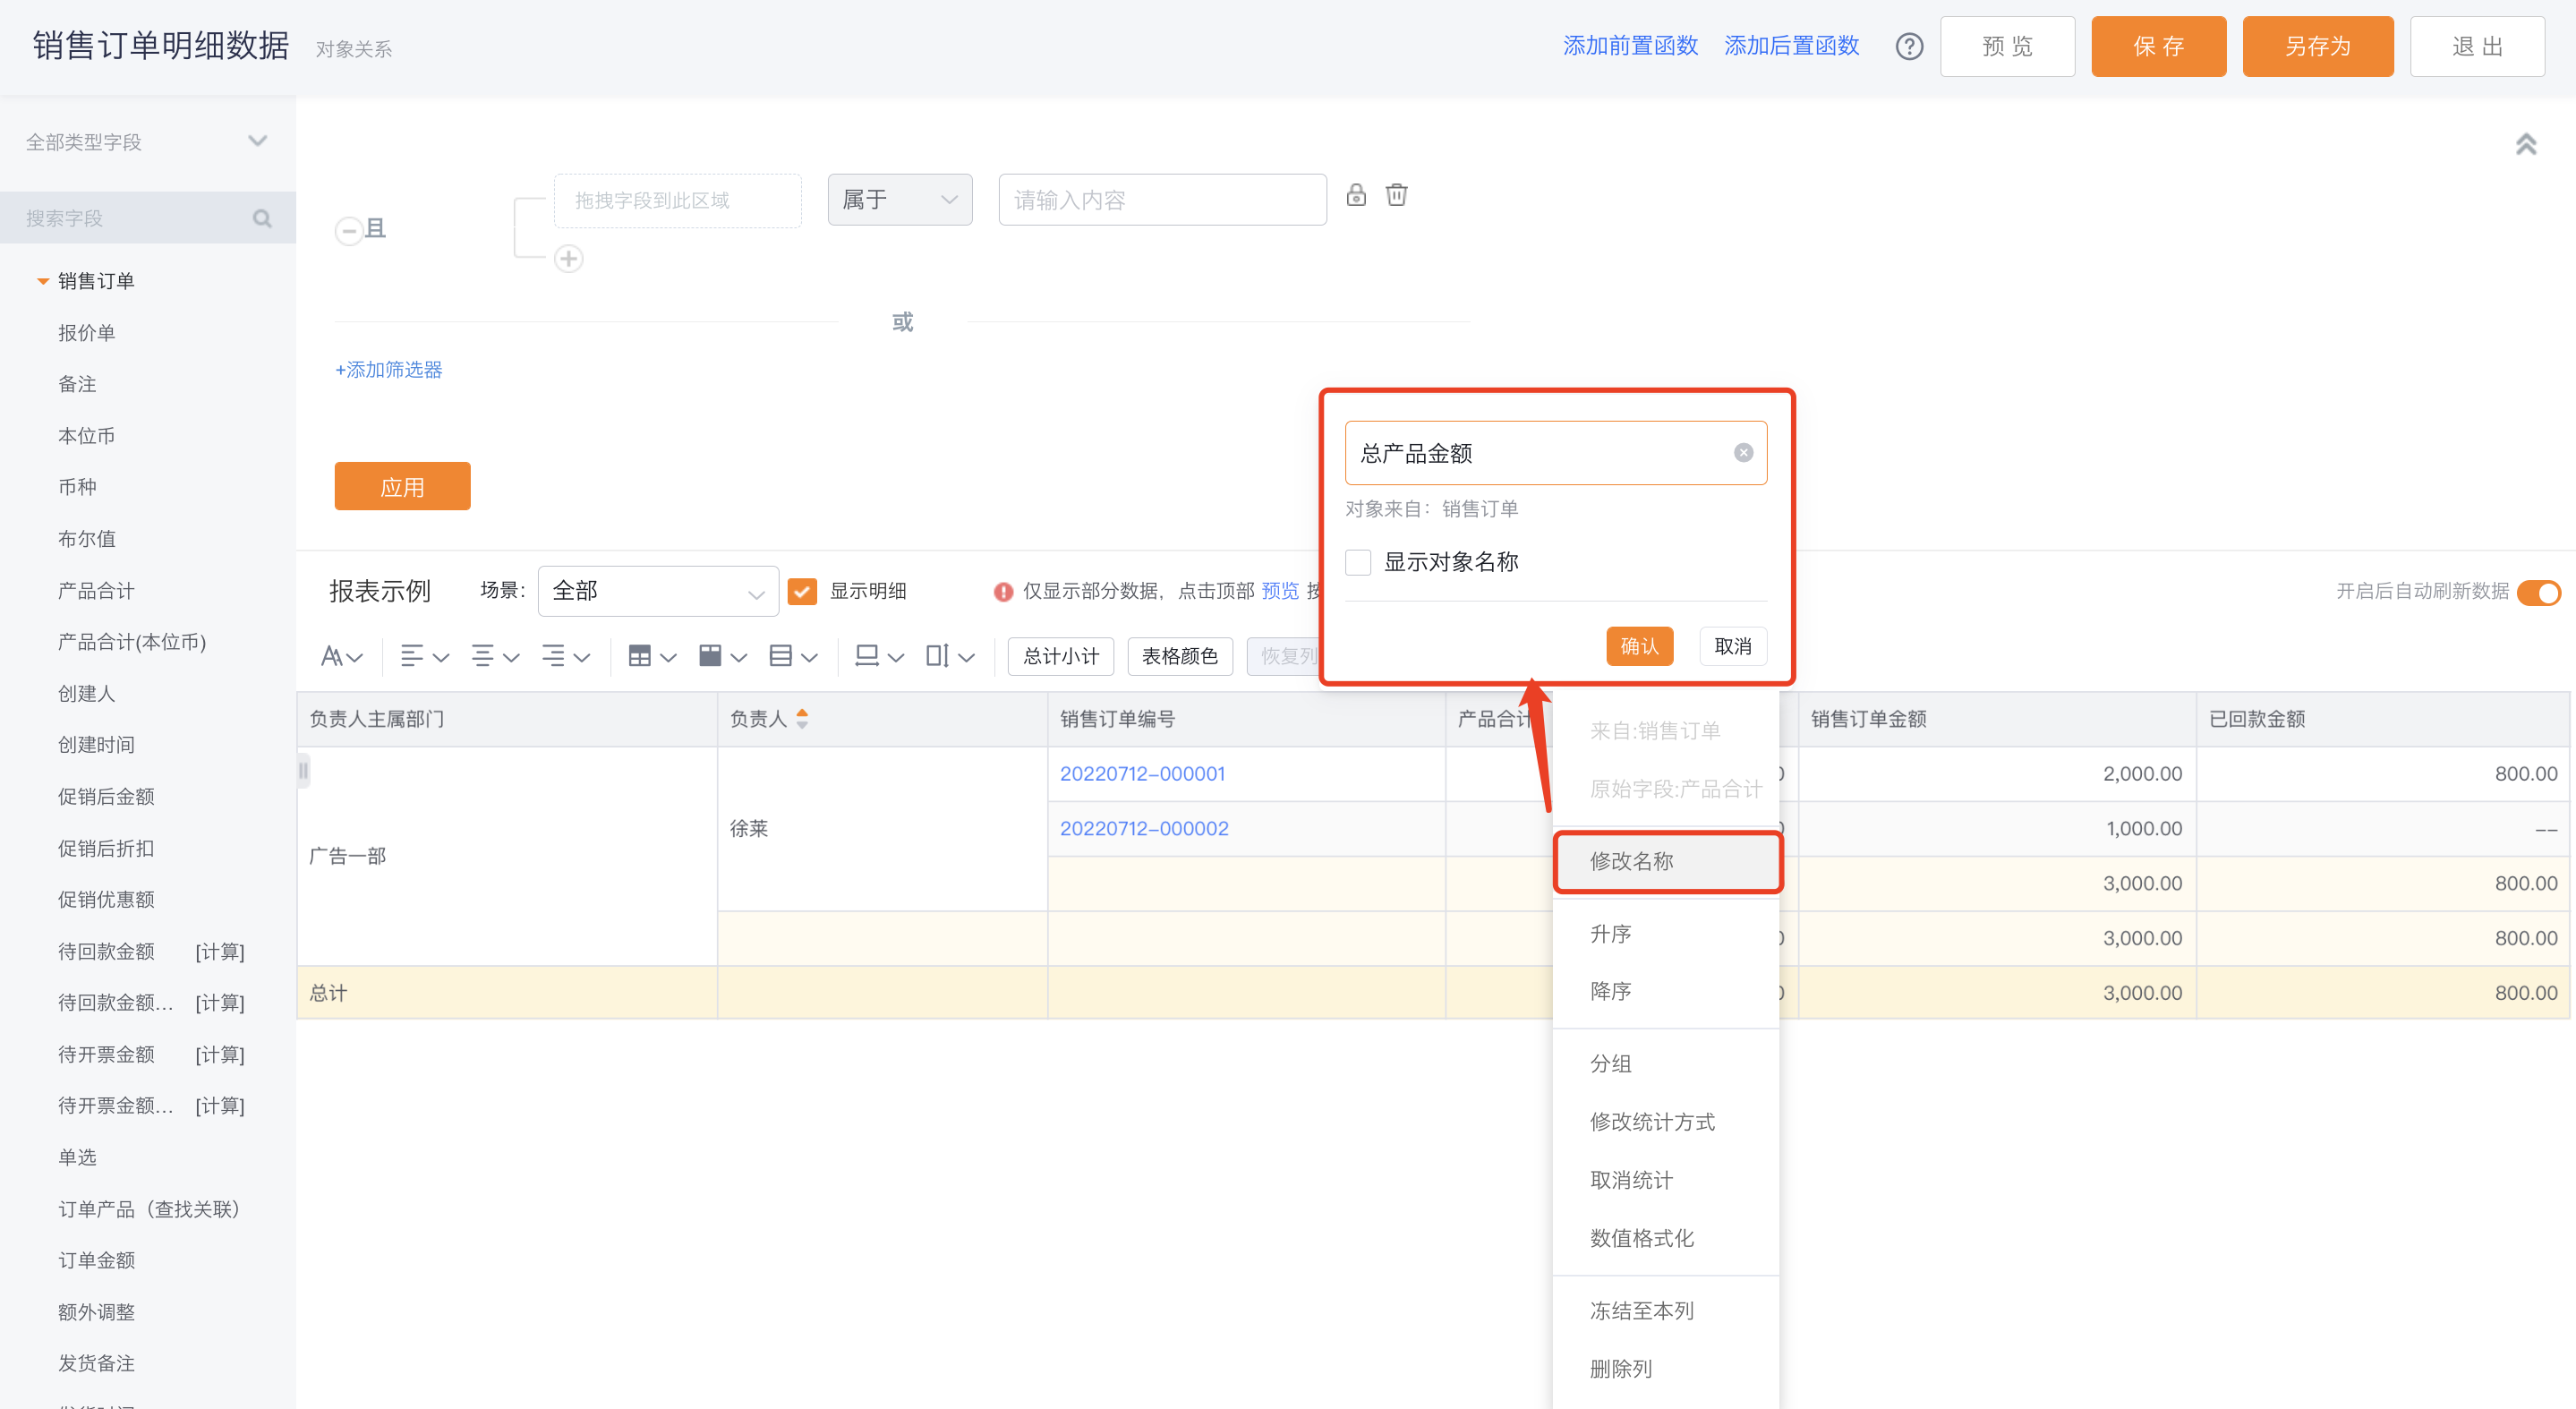
- Rename column headers
- Edit the display name for a column header.
- Show the originating object name.
 </img>
- Add calculated columns
- After adding, calculated columns appear at the front of detail columns by default; you can reorder them among detail columns but not into grouped columns.
- Each calculated column can include up to 5 numeric fields from report objects.
- When adding a calculated column you can define how totals/subtotals are computed — either by formula or by summing detail rows.
- Calculated columns can be further aggregated (e.g., summed).
- Supported operators include + - * / () and logical operators for mixed expressions.
- Note: Calculated columns support date/date-time difference calculations between fields of the same type.
 </img>
 </img>
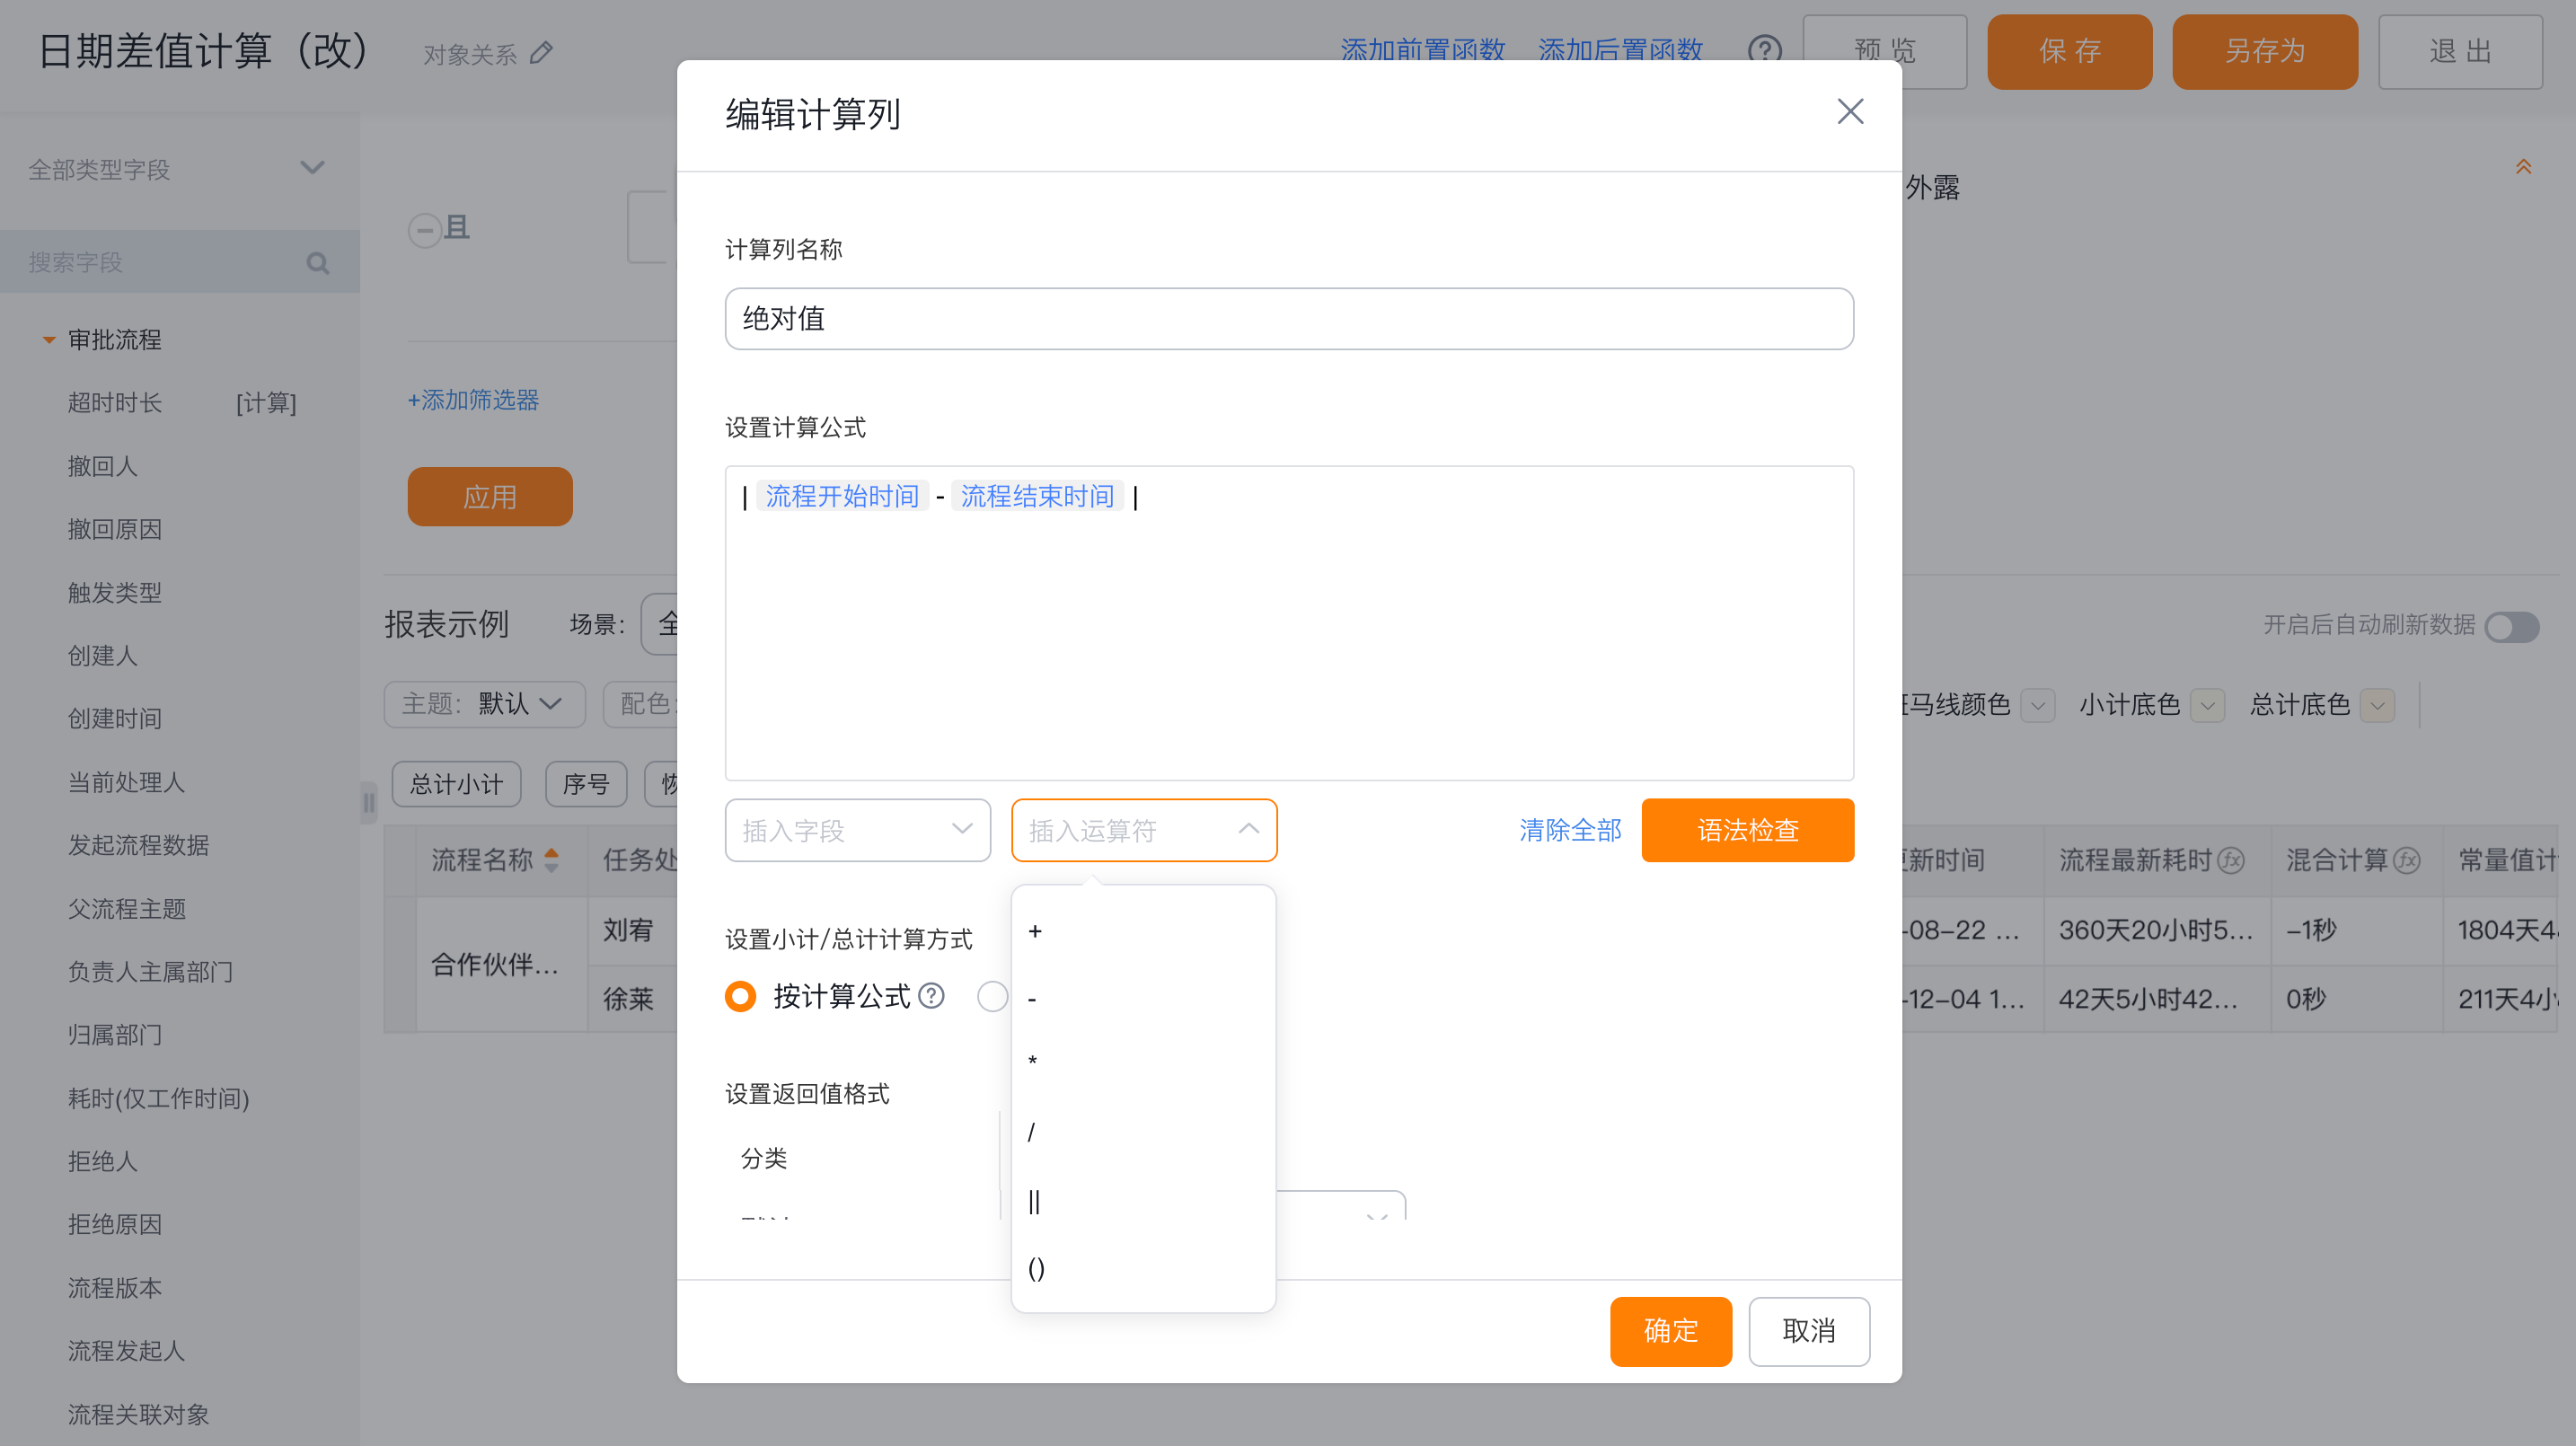 </img>
- Numeric formatting
- Detail field formatting: When a numeric field is dragged into the report canvas, you can set its number format: Default (uses thousand separators), Number, Percentage (%), or Duration. You can also customize the tooltip display style for both raw and formatted values.
- Aggregated field formatting: When defining an aggregation for a detail field, you can configure the numeric format for the aggregated value (Default, Number, Percentage, Duration). Tooltip display for aggregate metrics supports customization for raw and formatted values.
 </img>
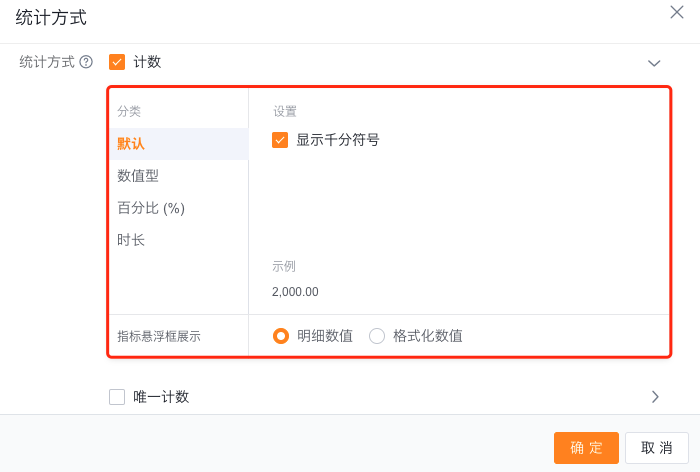 </img>
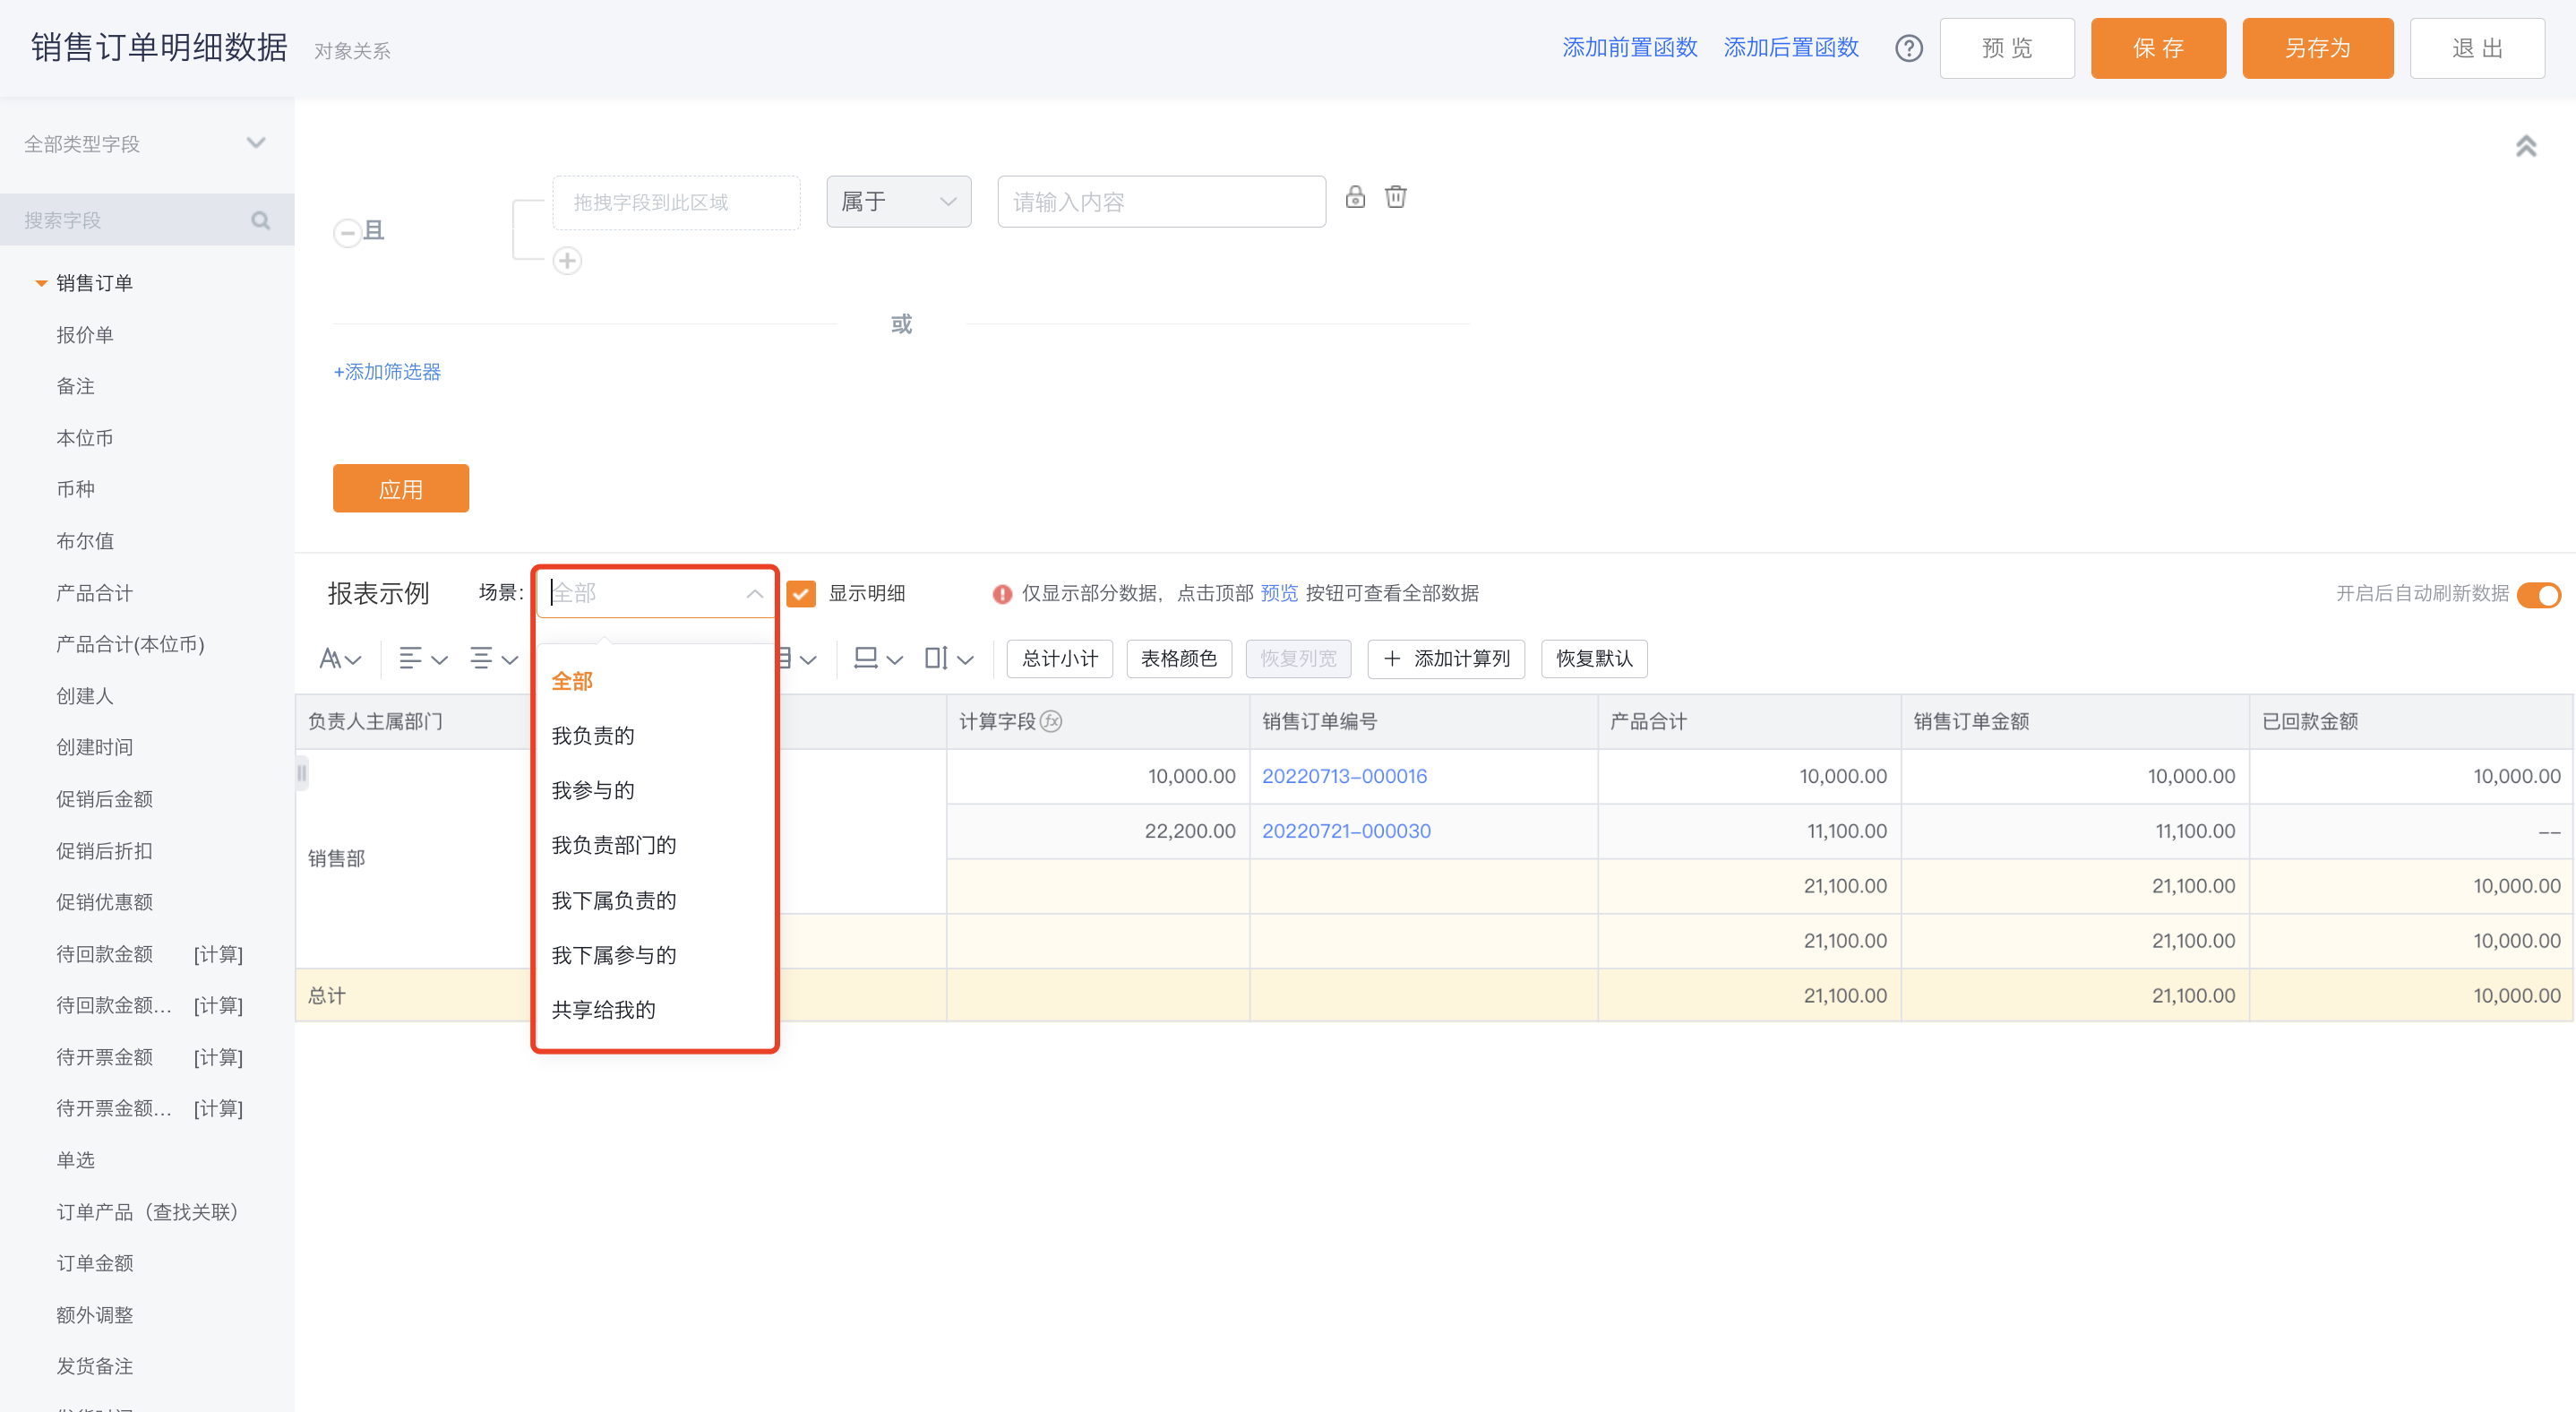
2.4 Filter Scenes
- BI preconfigures filter scenes for each report. You can set which scene should be the default when viewing the report.
 </img>
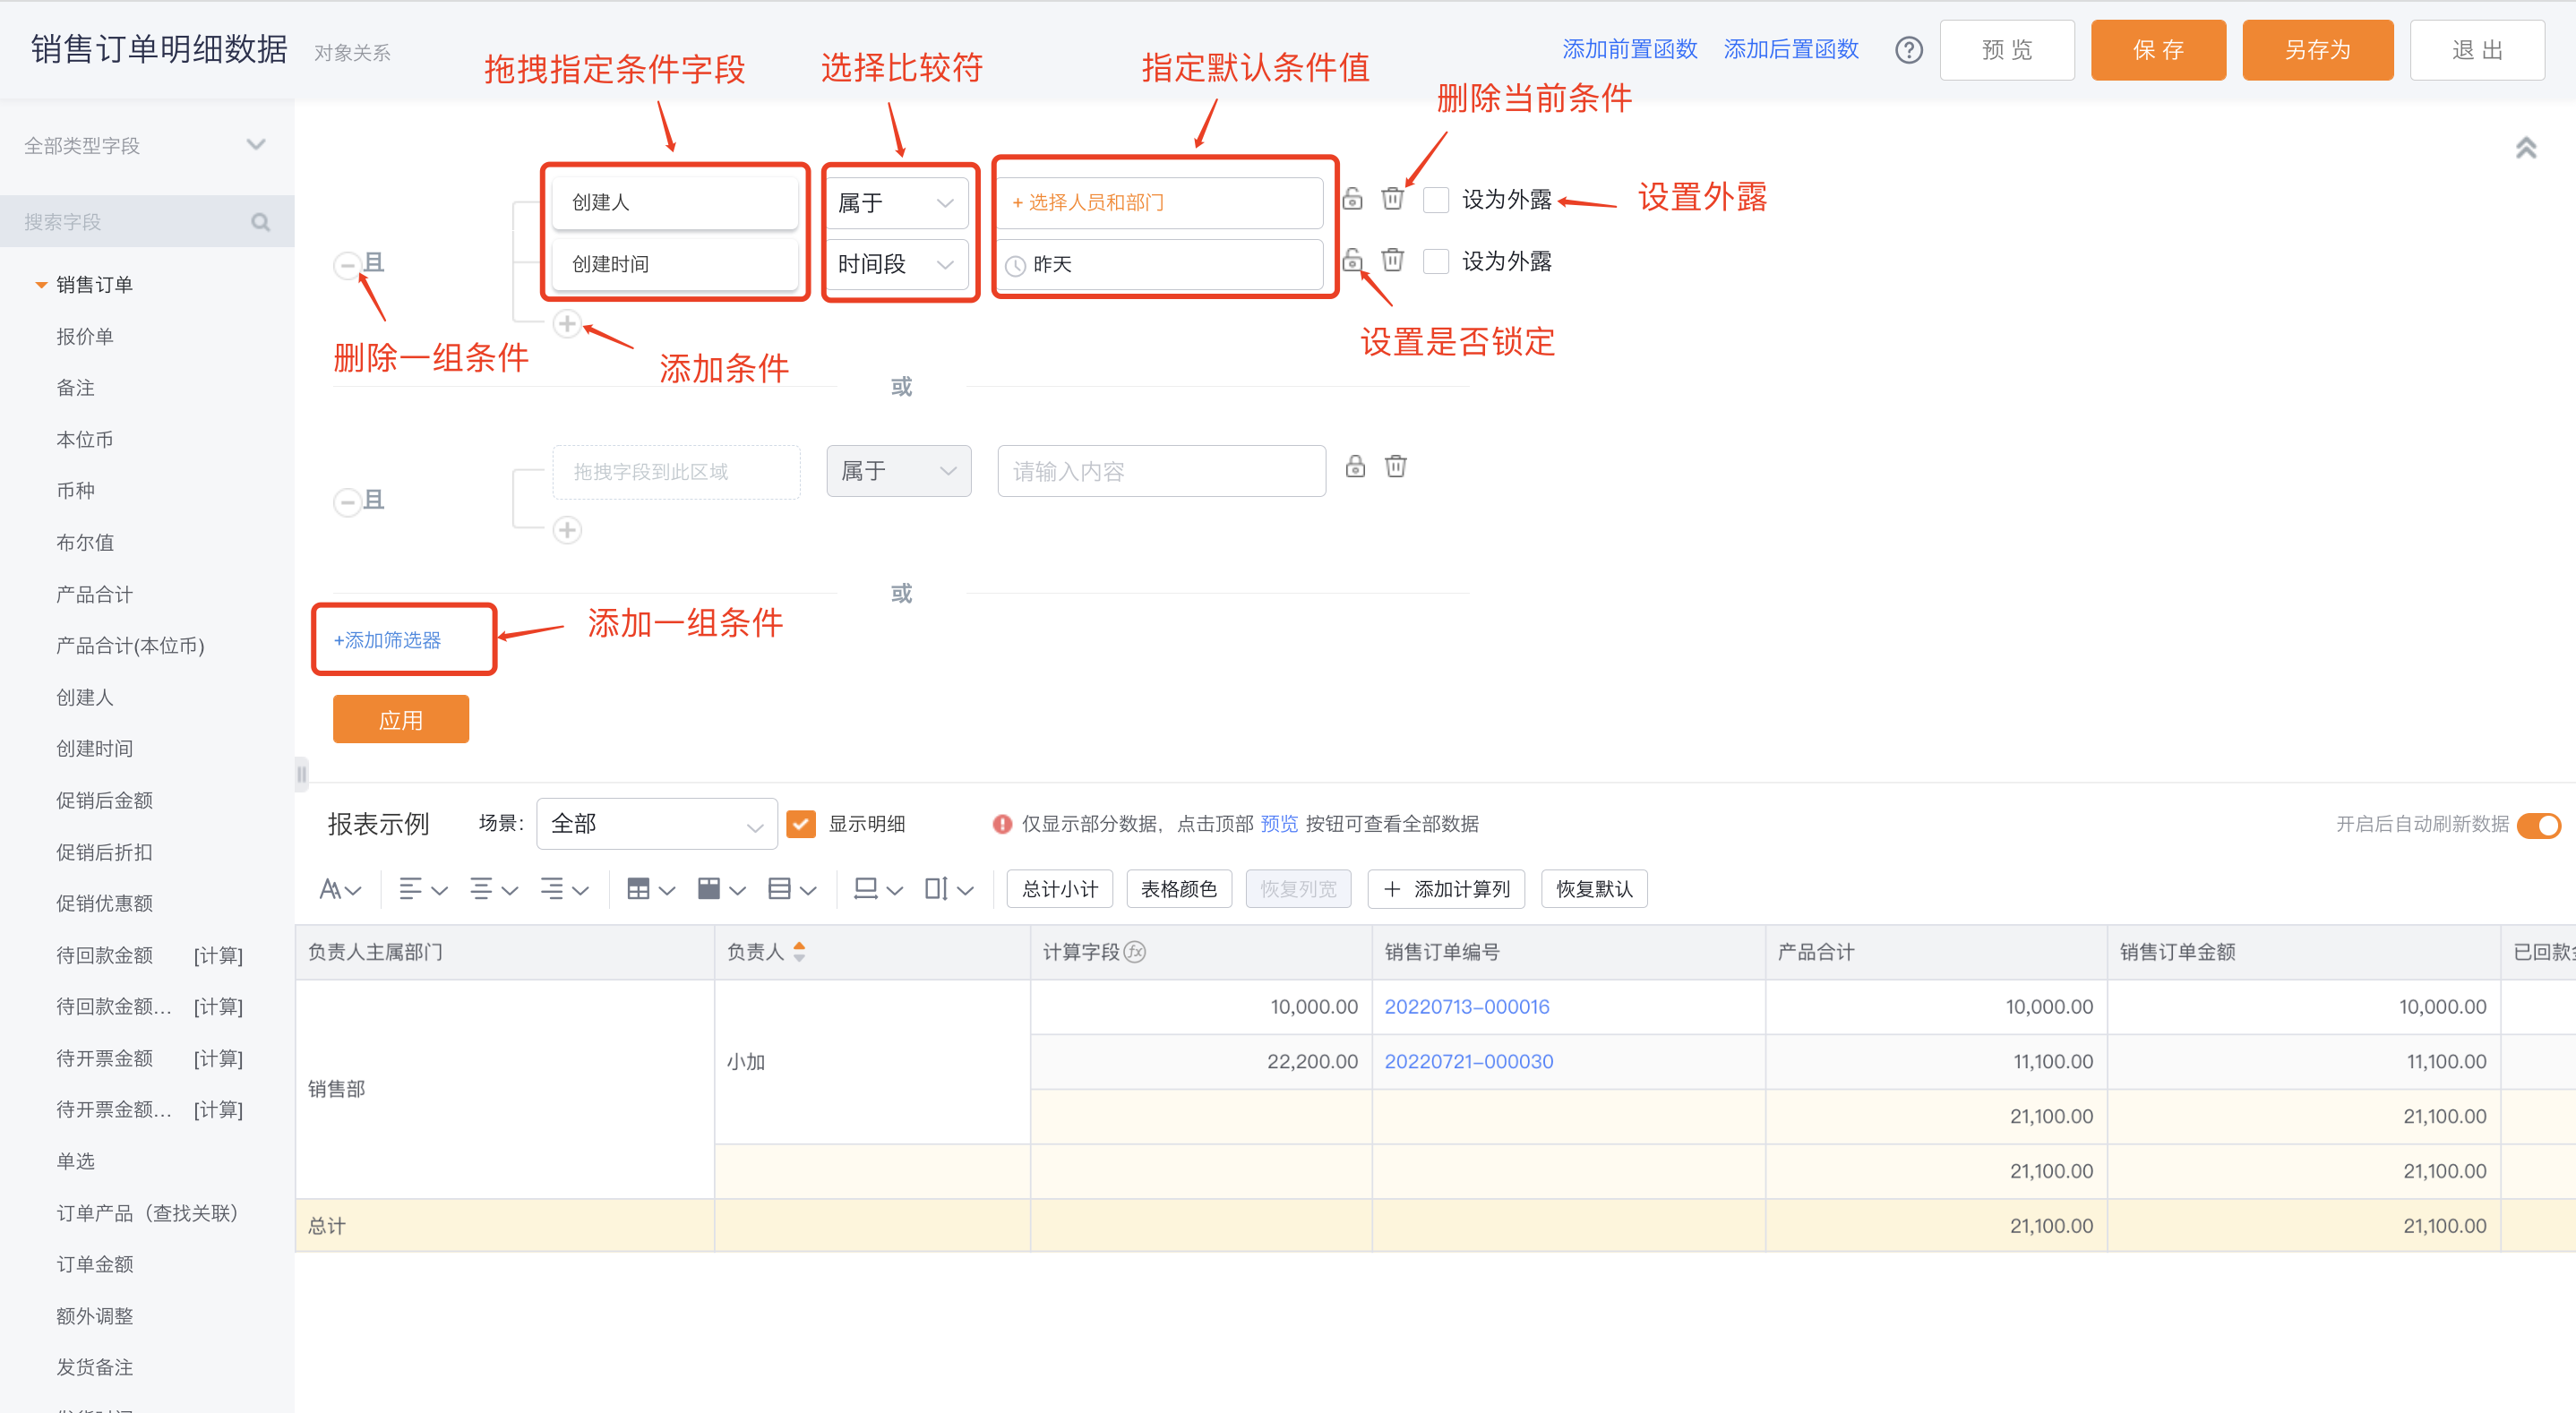
2.5 Data Scope
- The Data Scope panel defines the report filters.
- Condition fields can be dragged from the left fields pane or from column headers.
- Comparison operators vary by field type.
- Locked conditions cannot be modified when viewing the report.
- Added conditions can be set to be visible or hidden to viewers.
 </img>
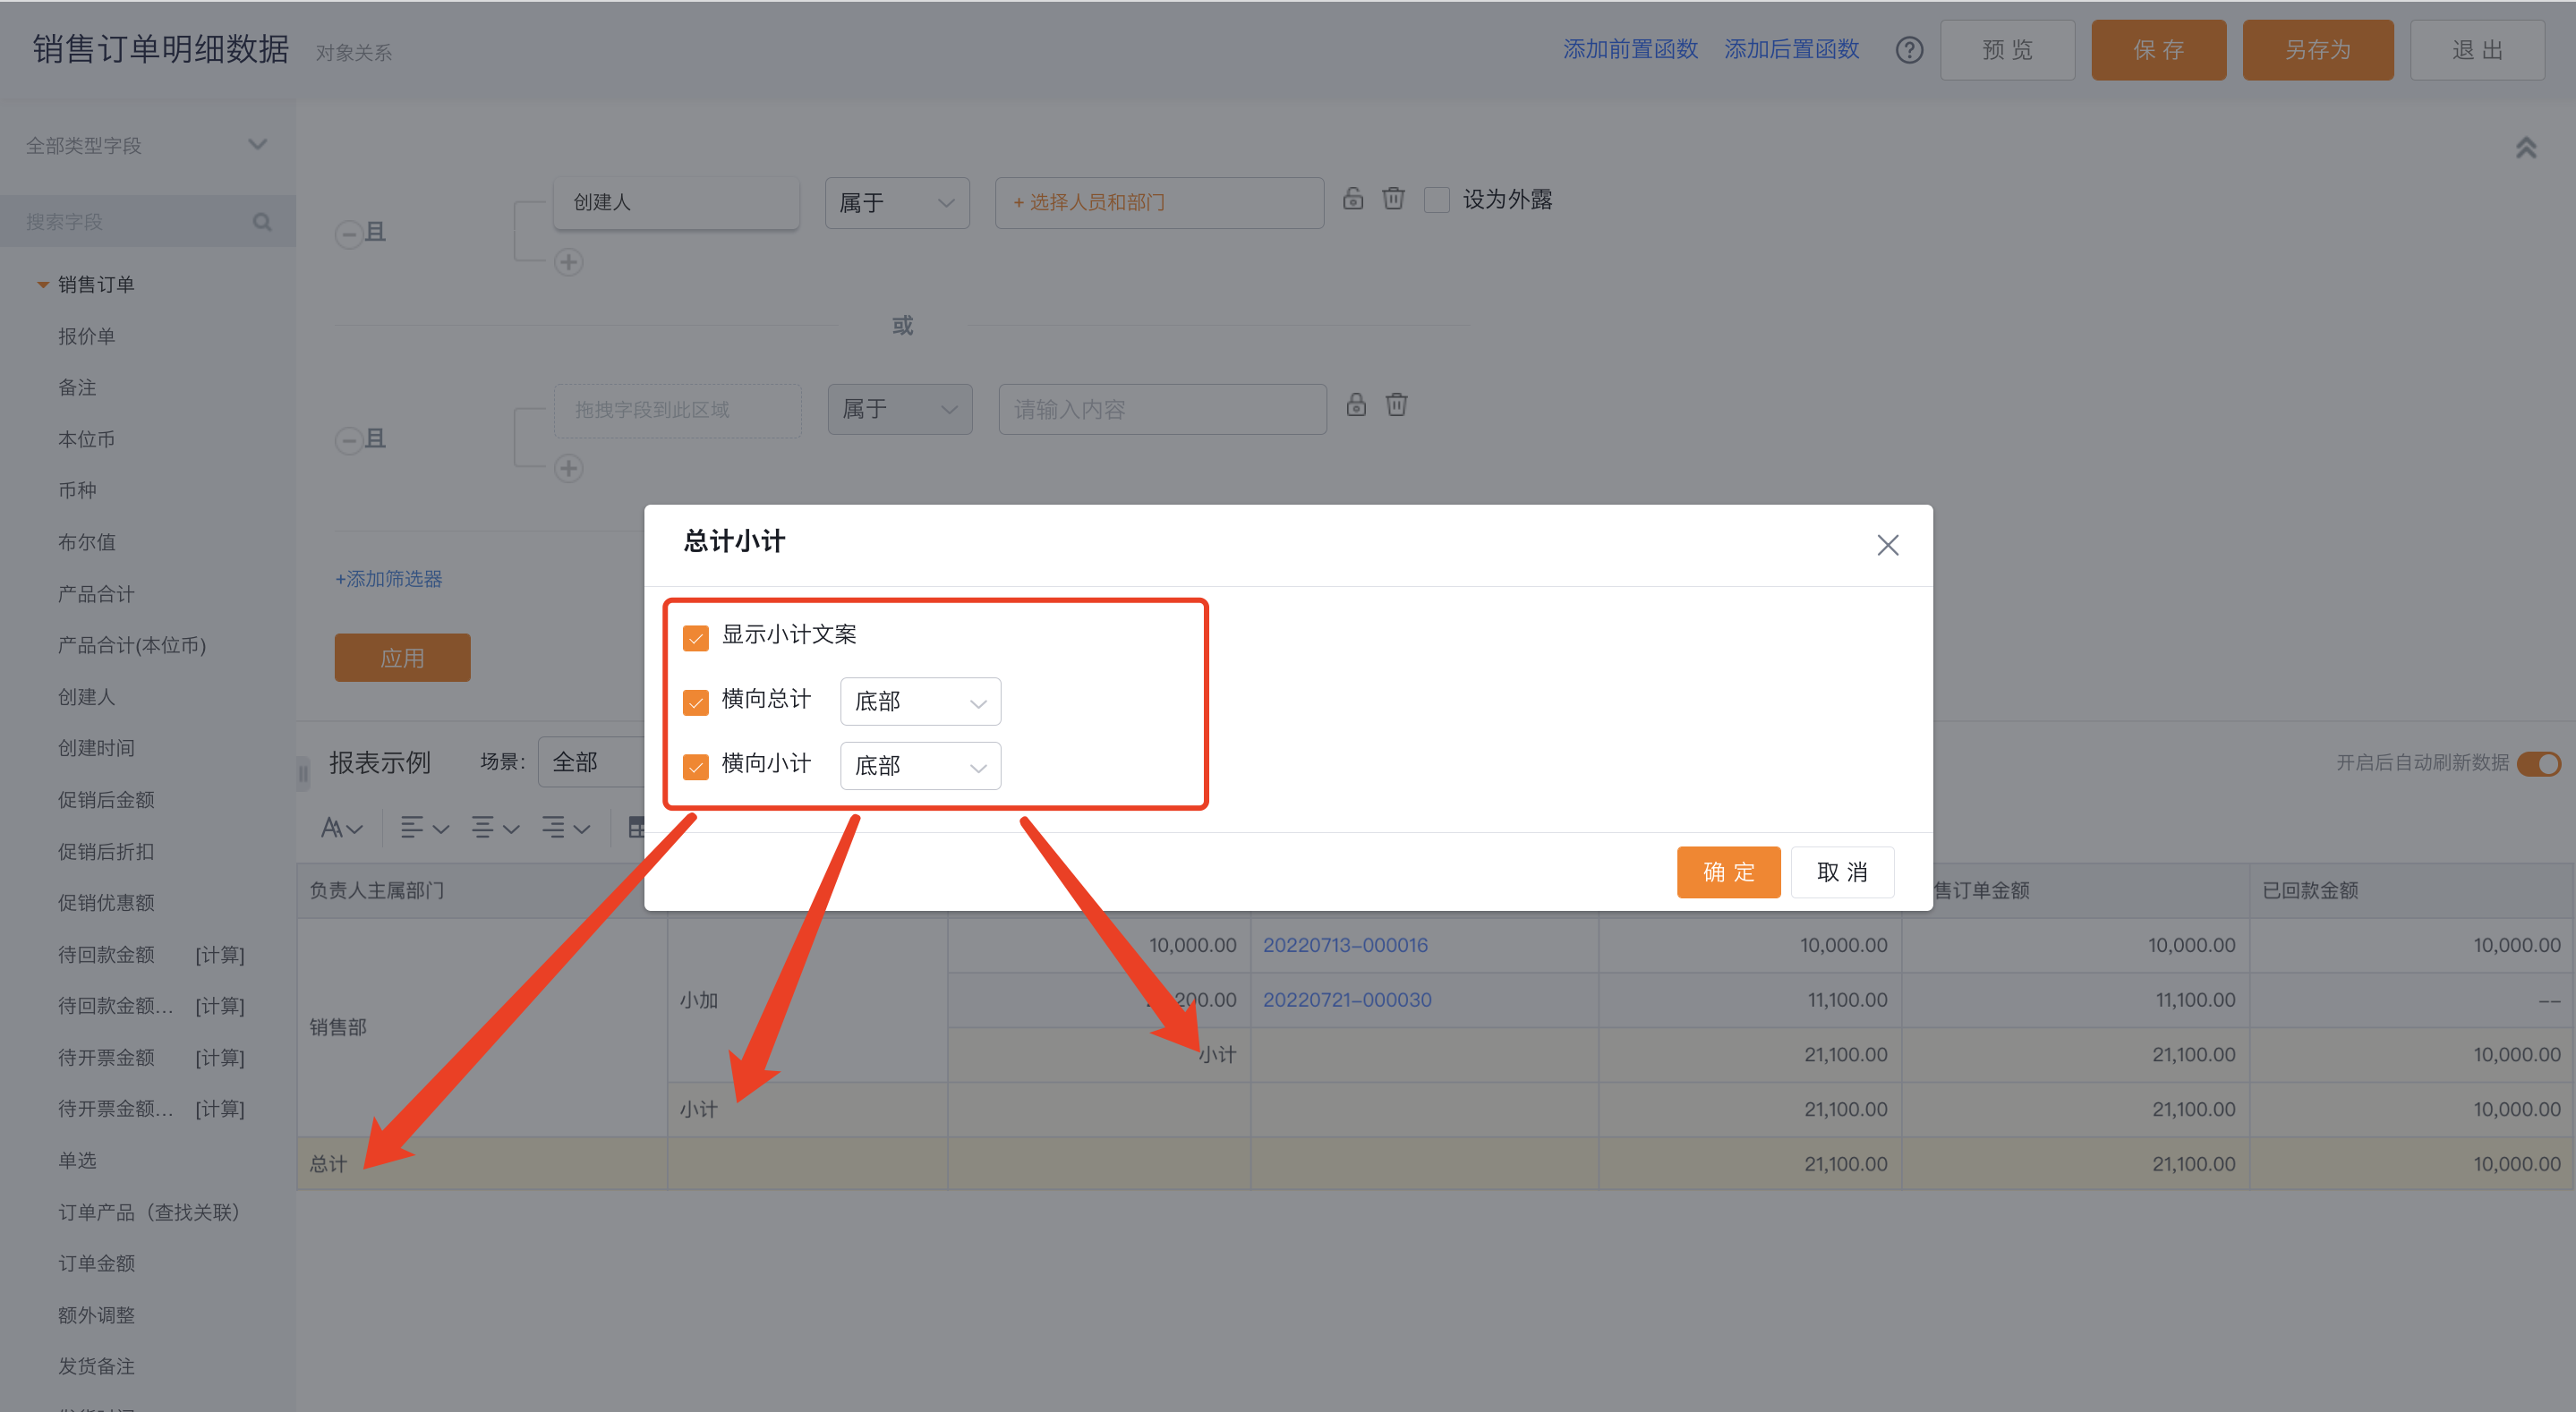
2.6 Appearance & Layout
- Show subtotal labels: Off by default. Enable to display subtotal labels for reports with aggregations.
 </img>
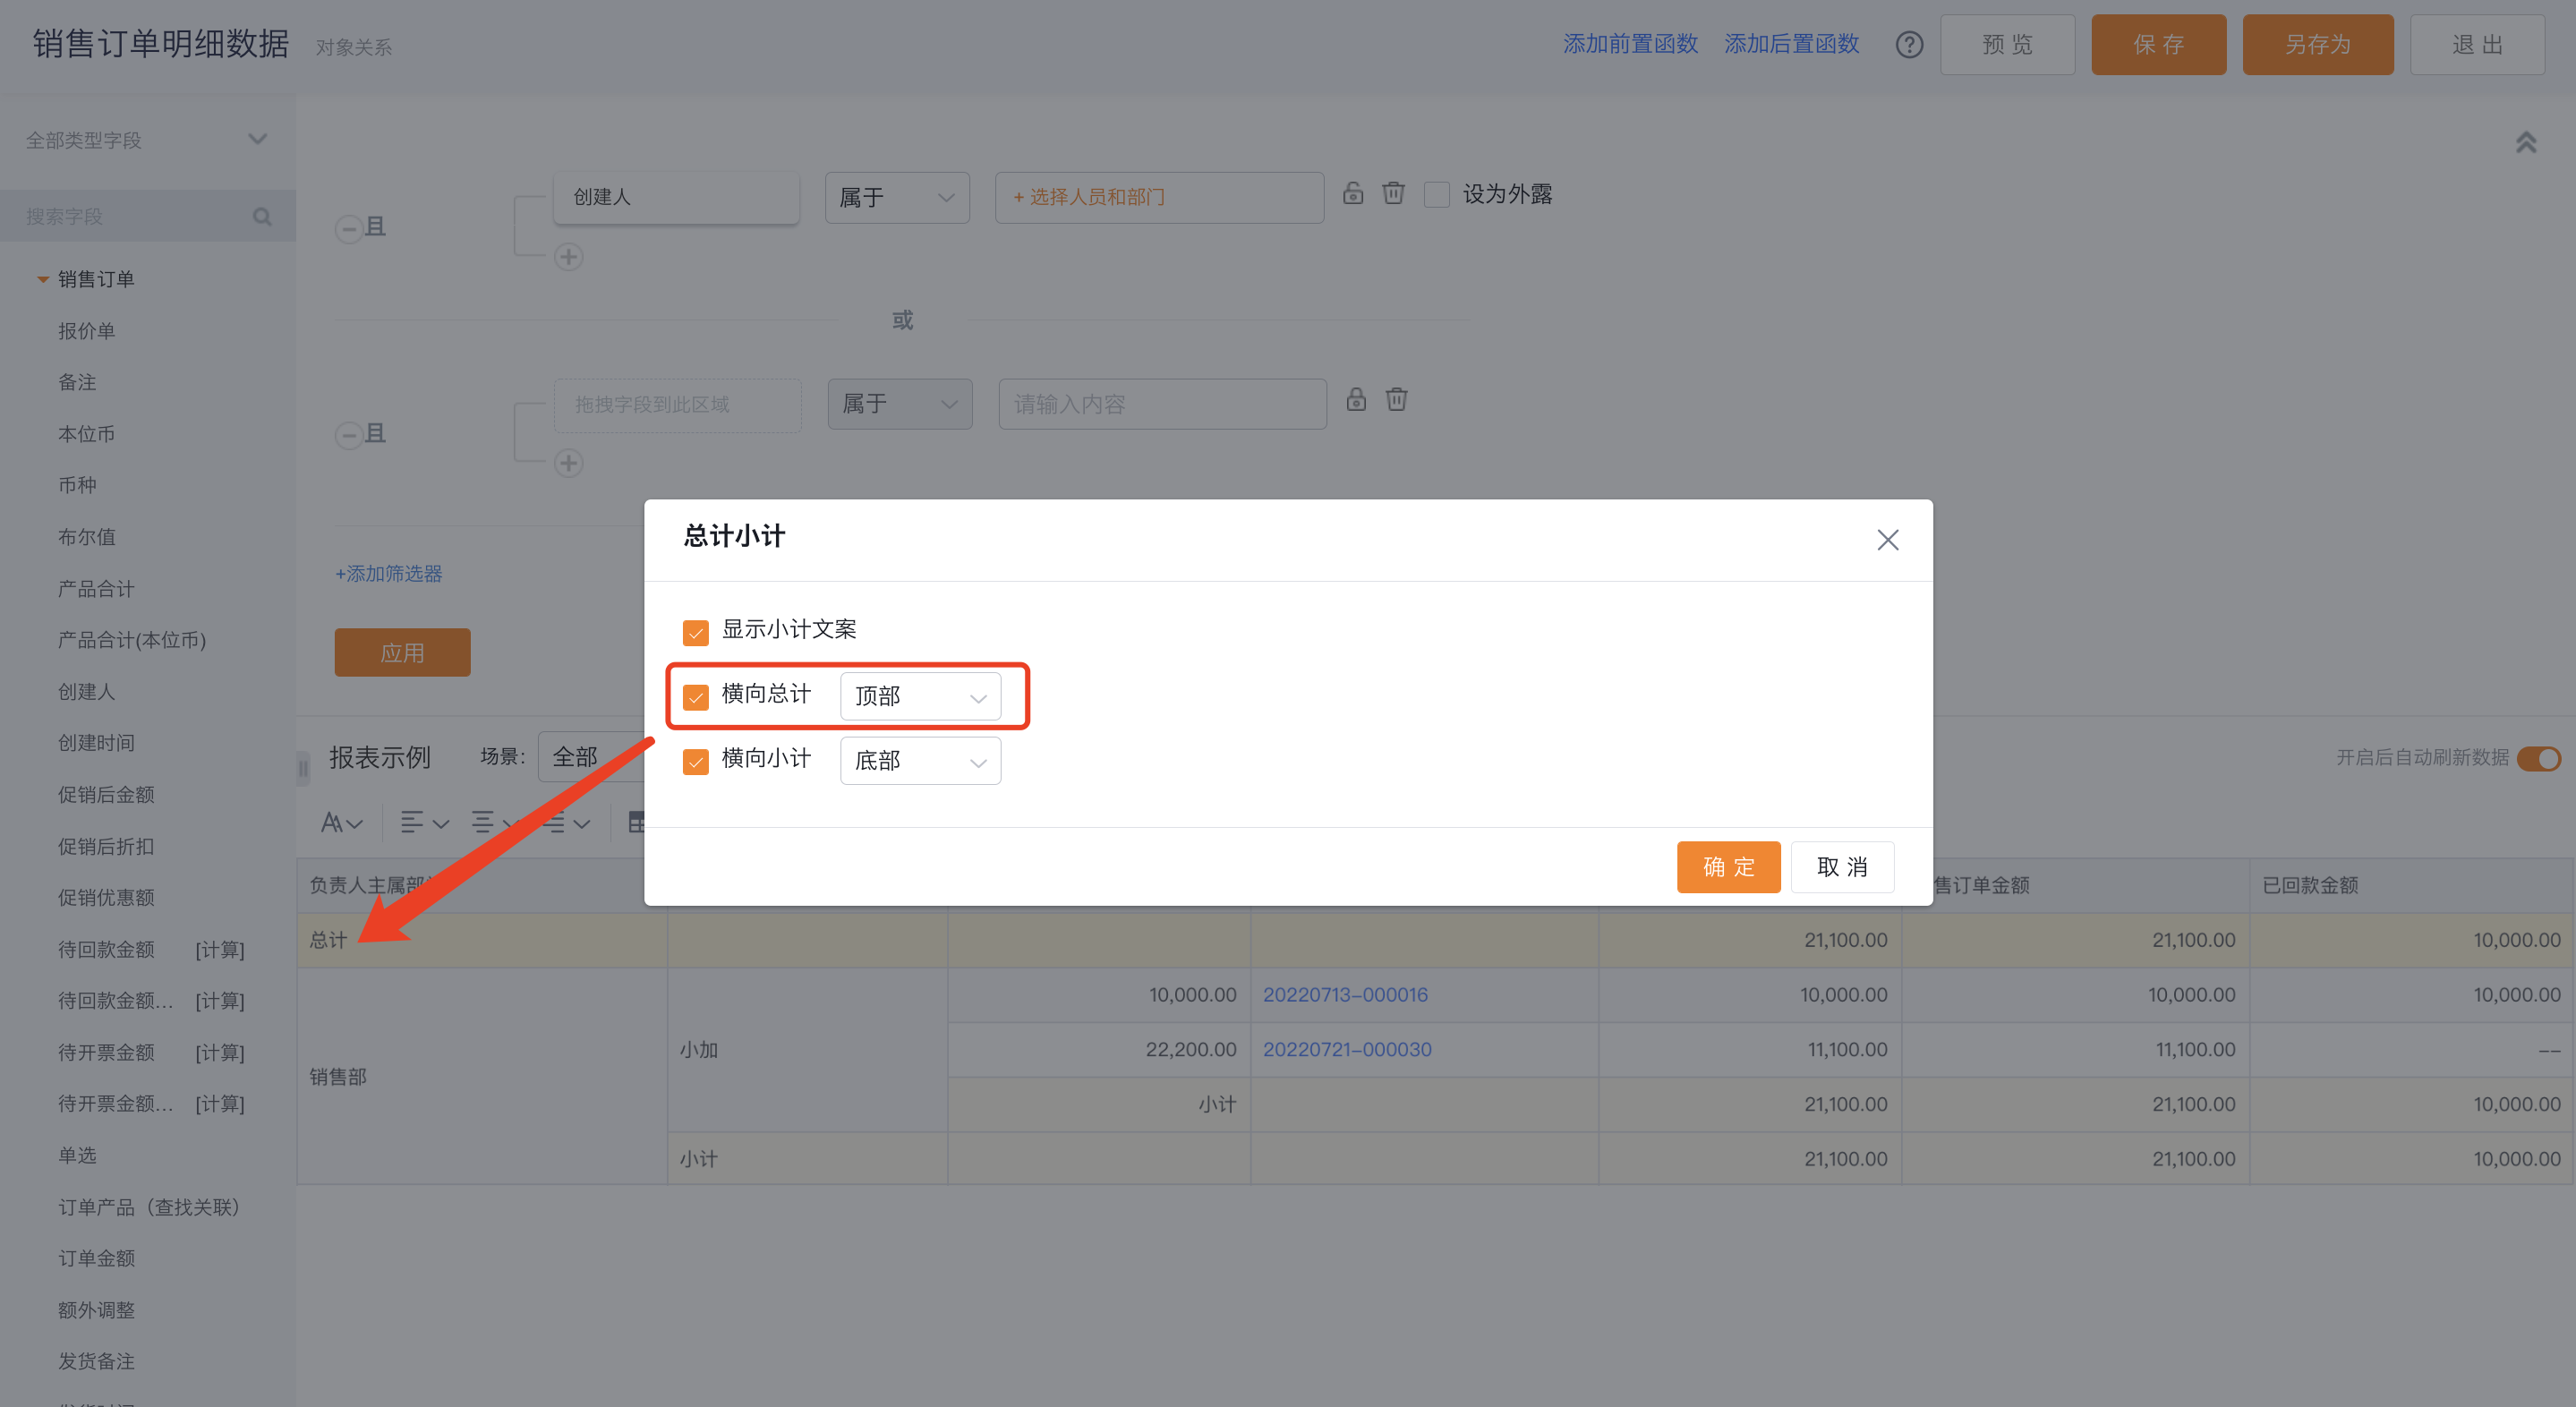
- Horizontal totals: Enabled by default and shown at the bottom; you can move them to the top or disable them.
 </img>
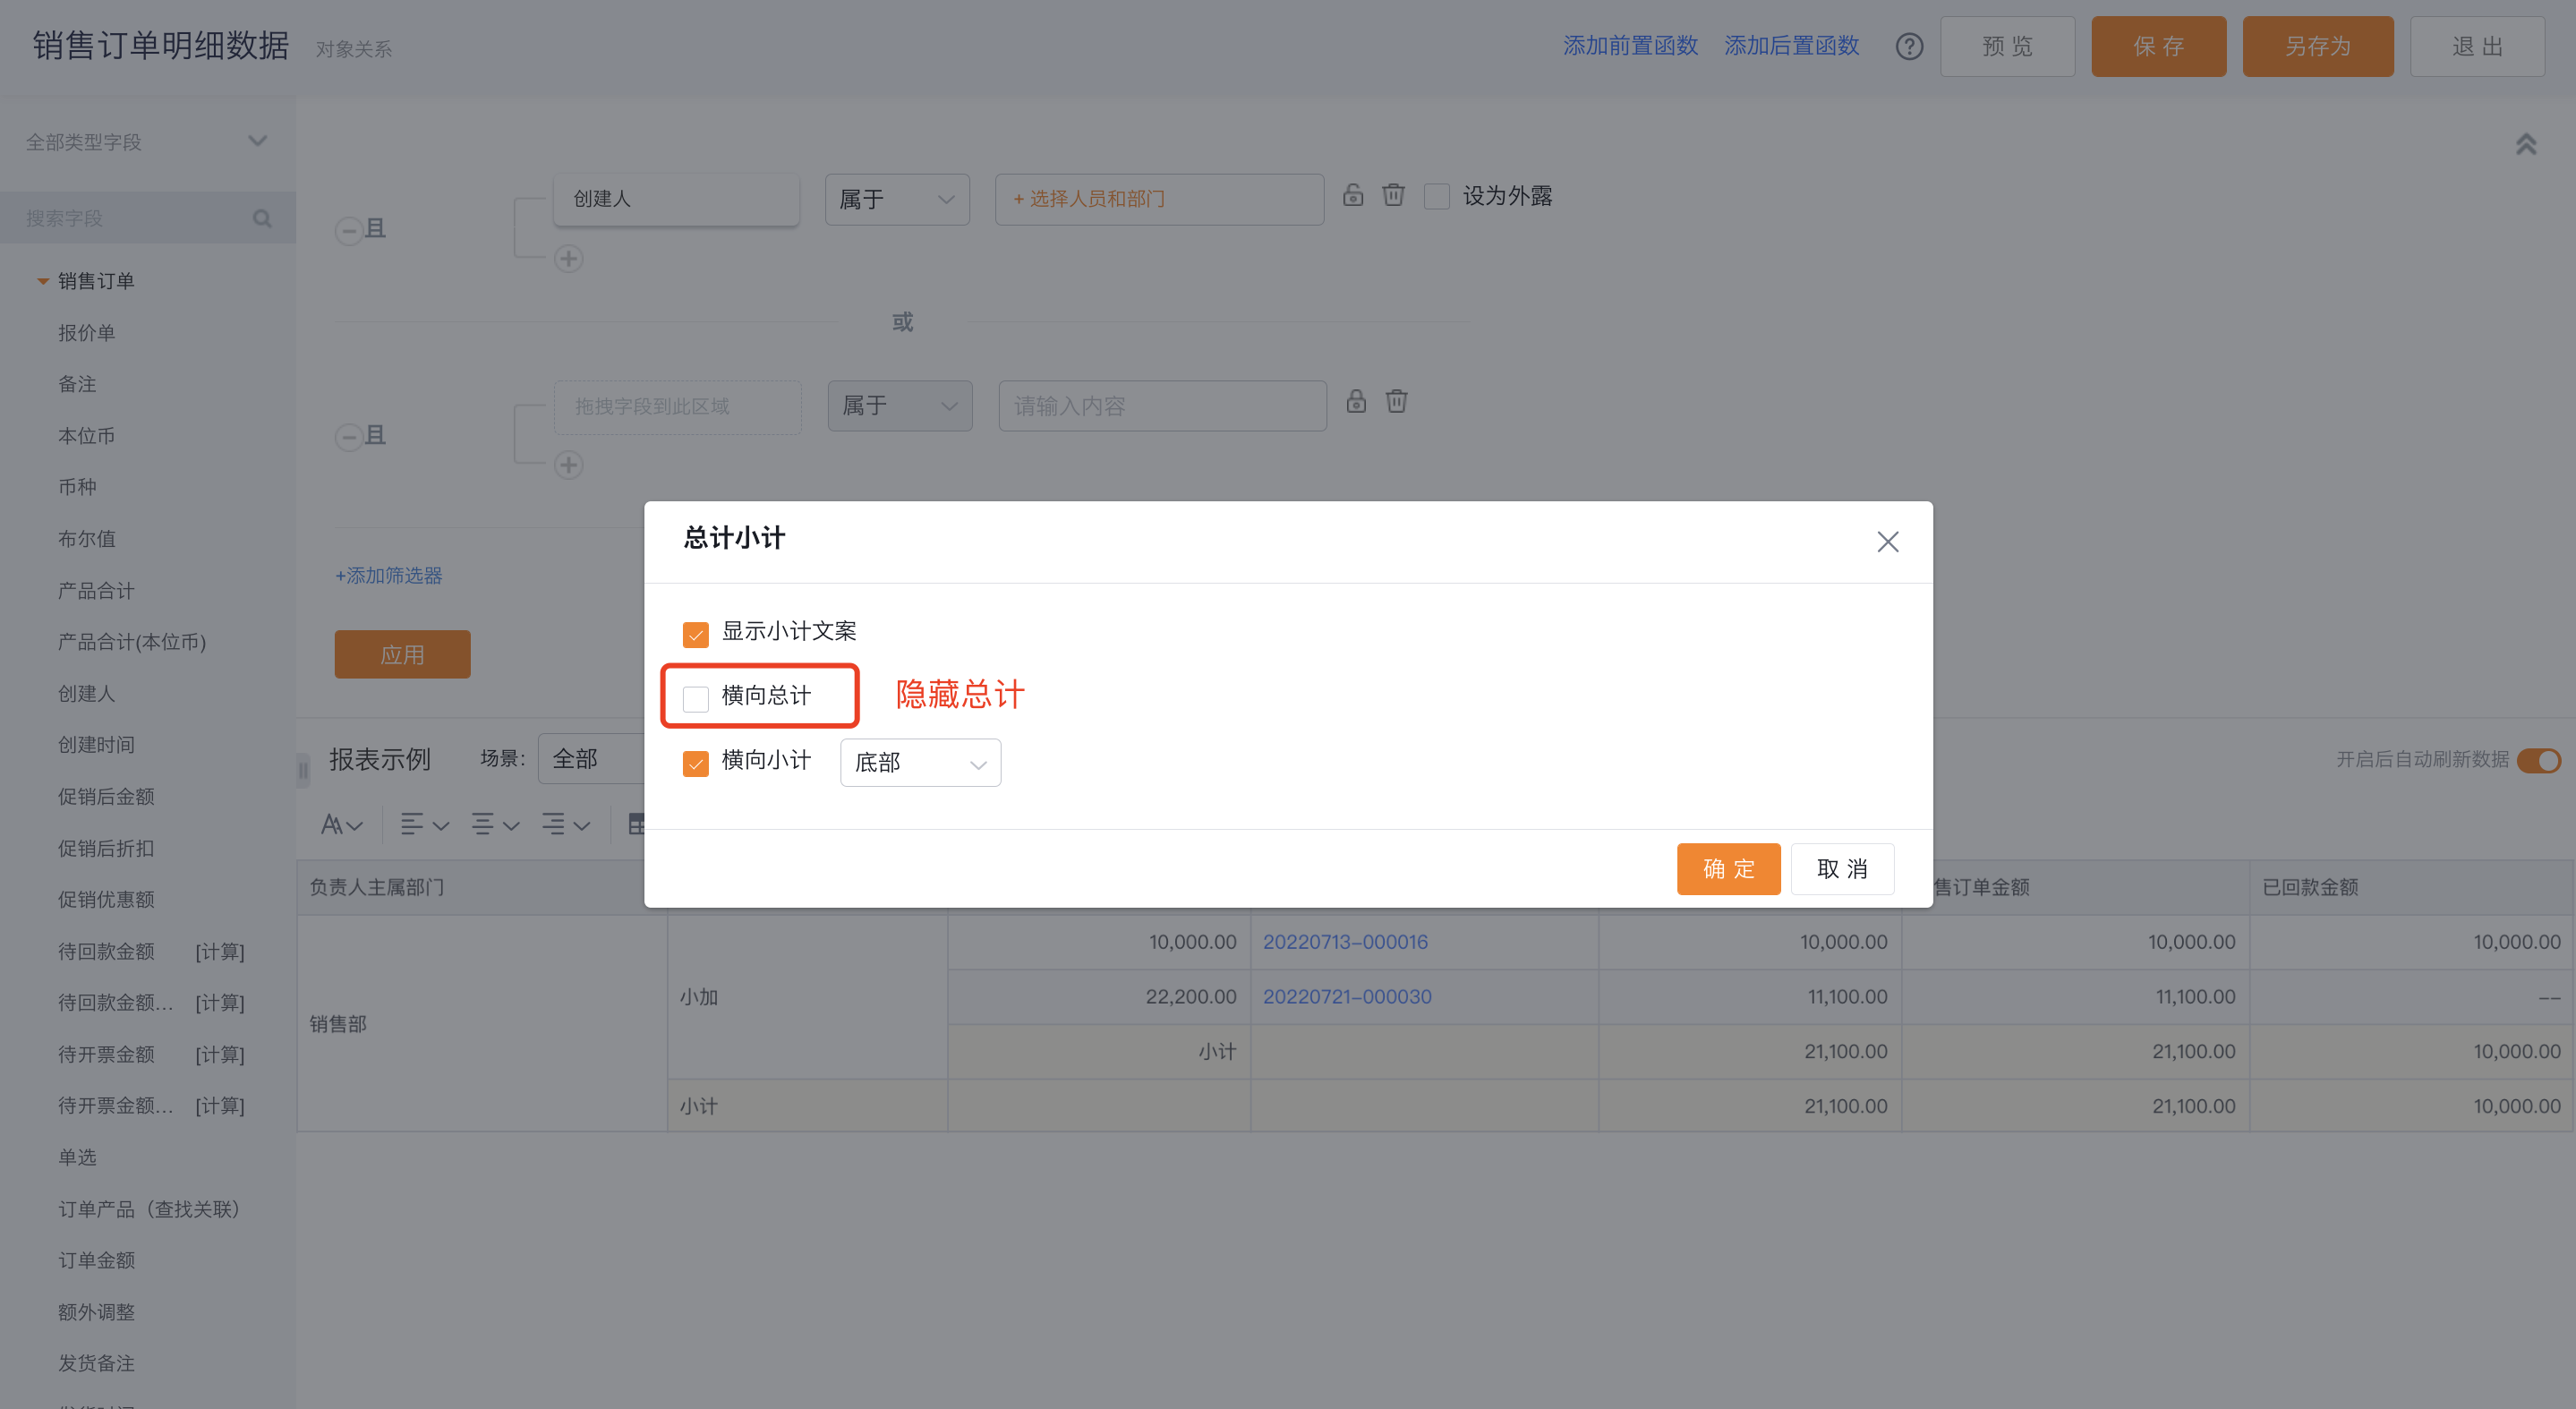 </img>
- Horizontal subtotals: Enabled by default and shown at the bottom; you can move them to the top or disable them (behaves the same as Horizontal totals).
- If subtotals are disabled, the "Show subtotal labels" option cannot be configured.
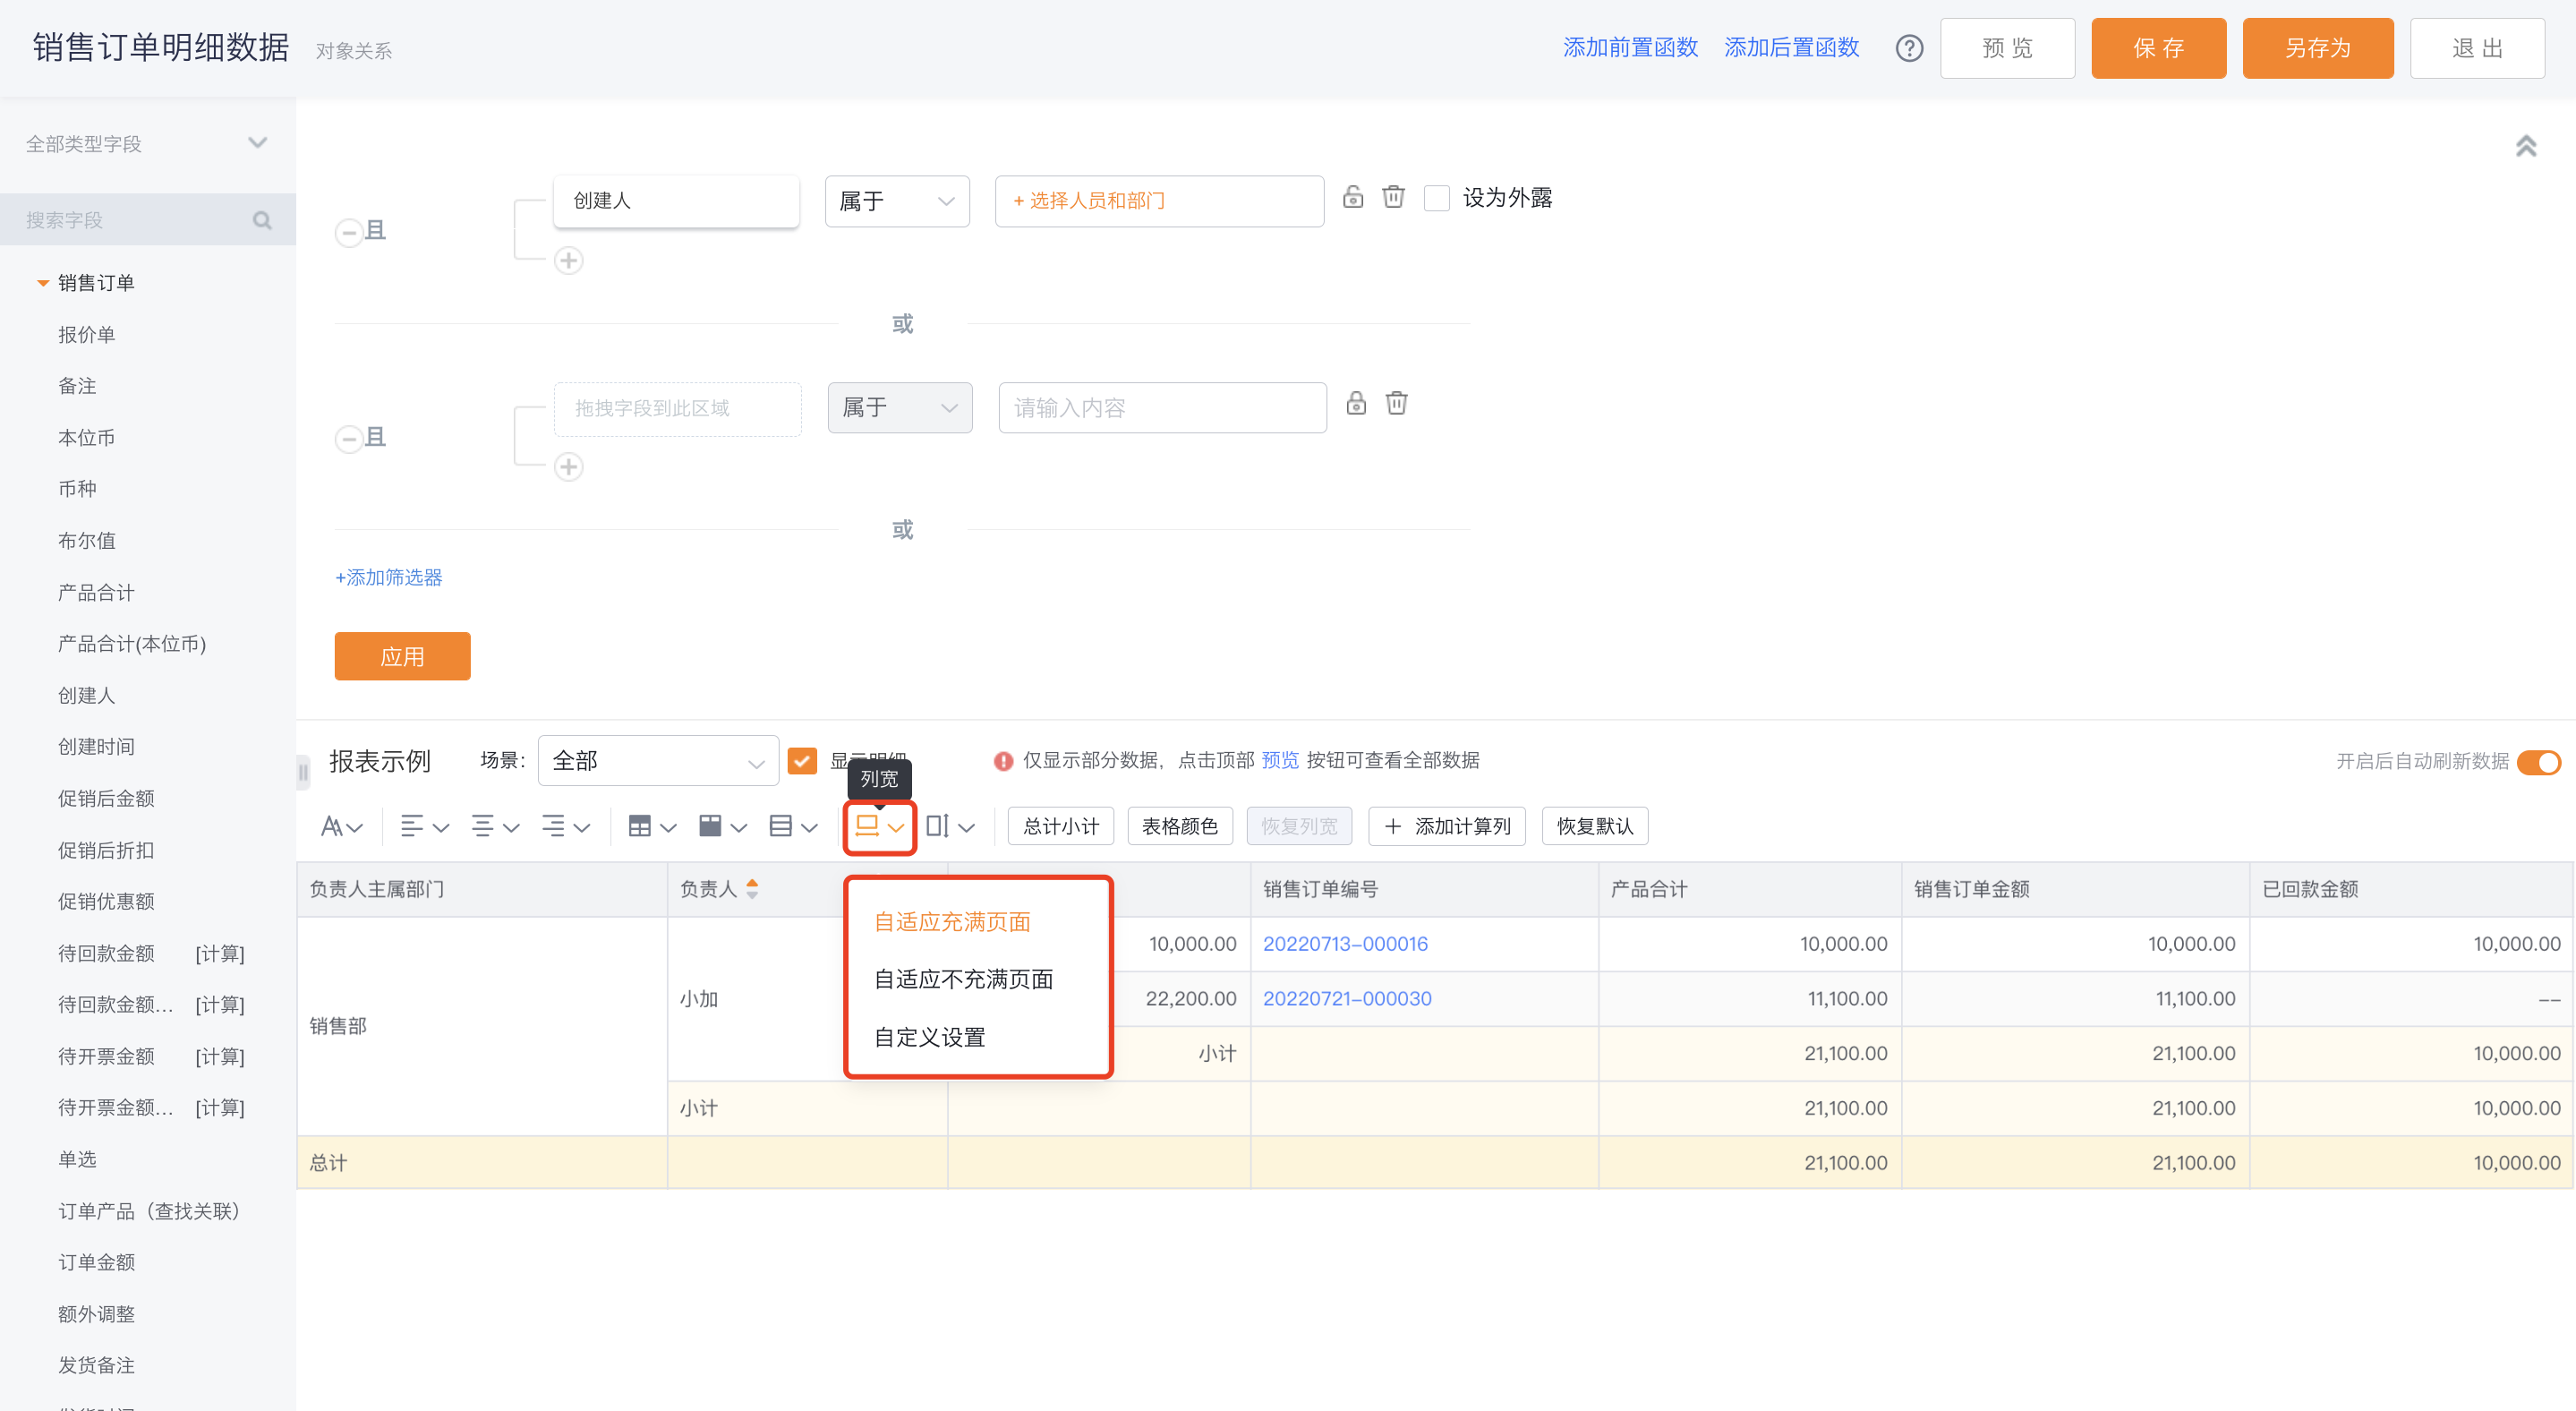
- Column width: Default is auto-fit to full width. You may toggle to non-full width and manually enter custom column widths.
 </img>
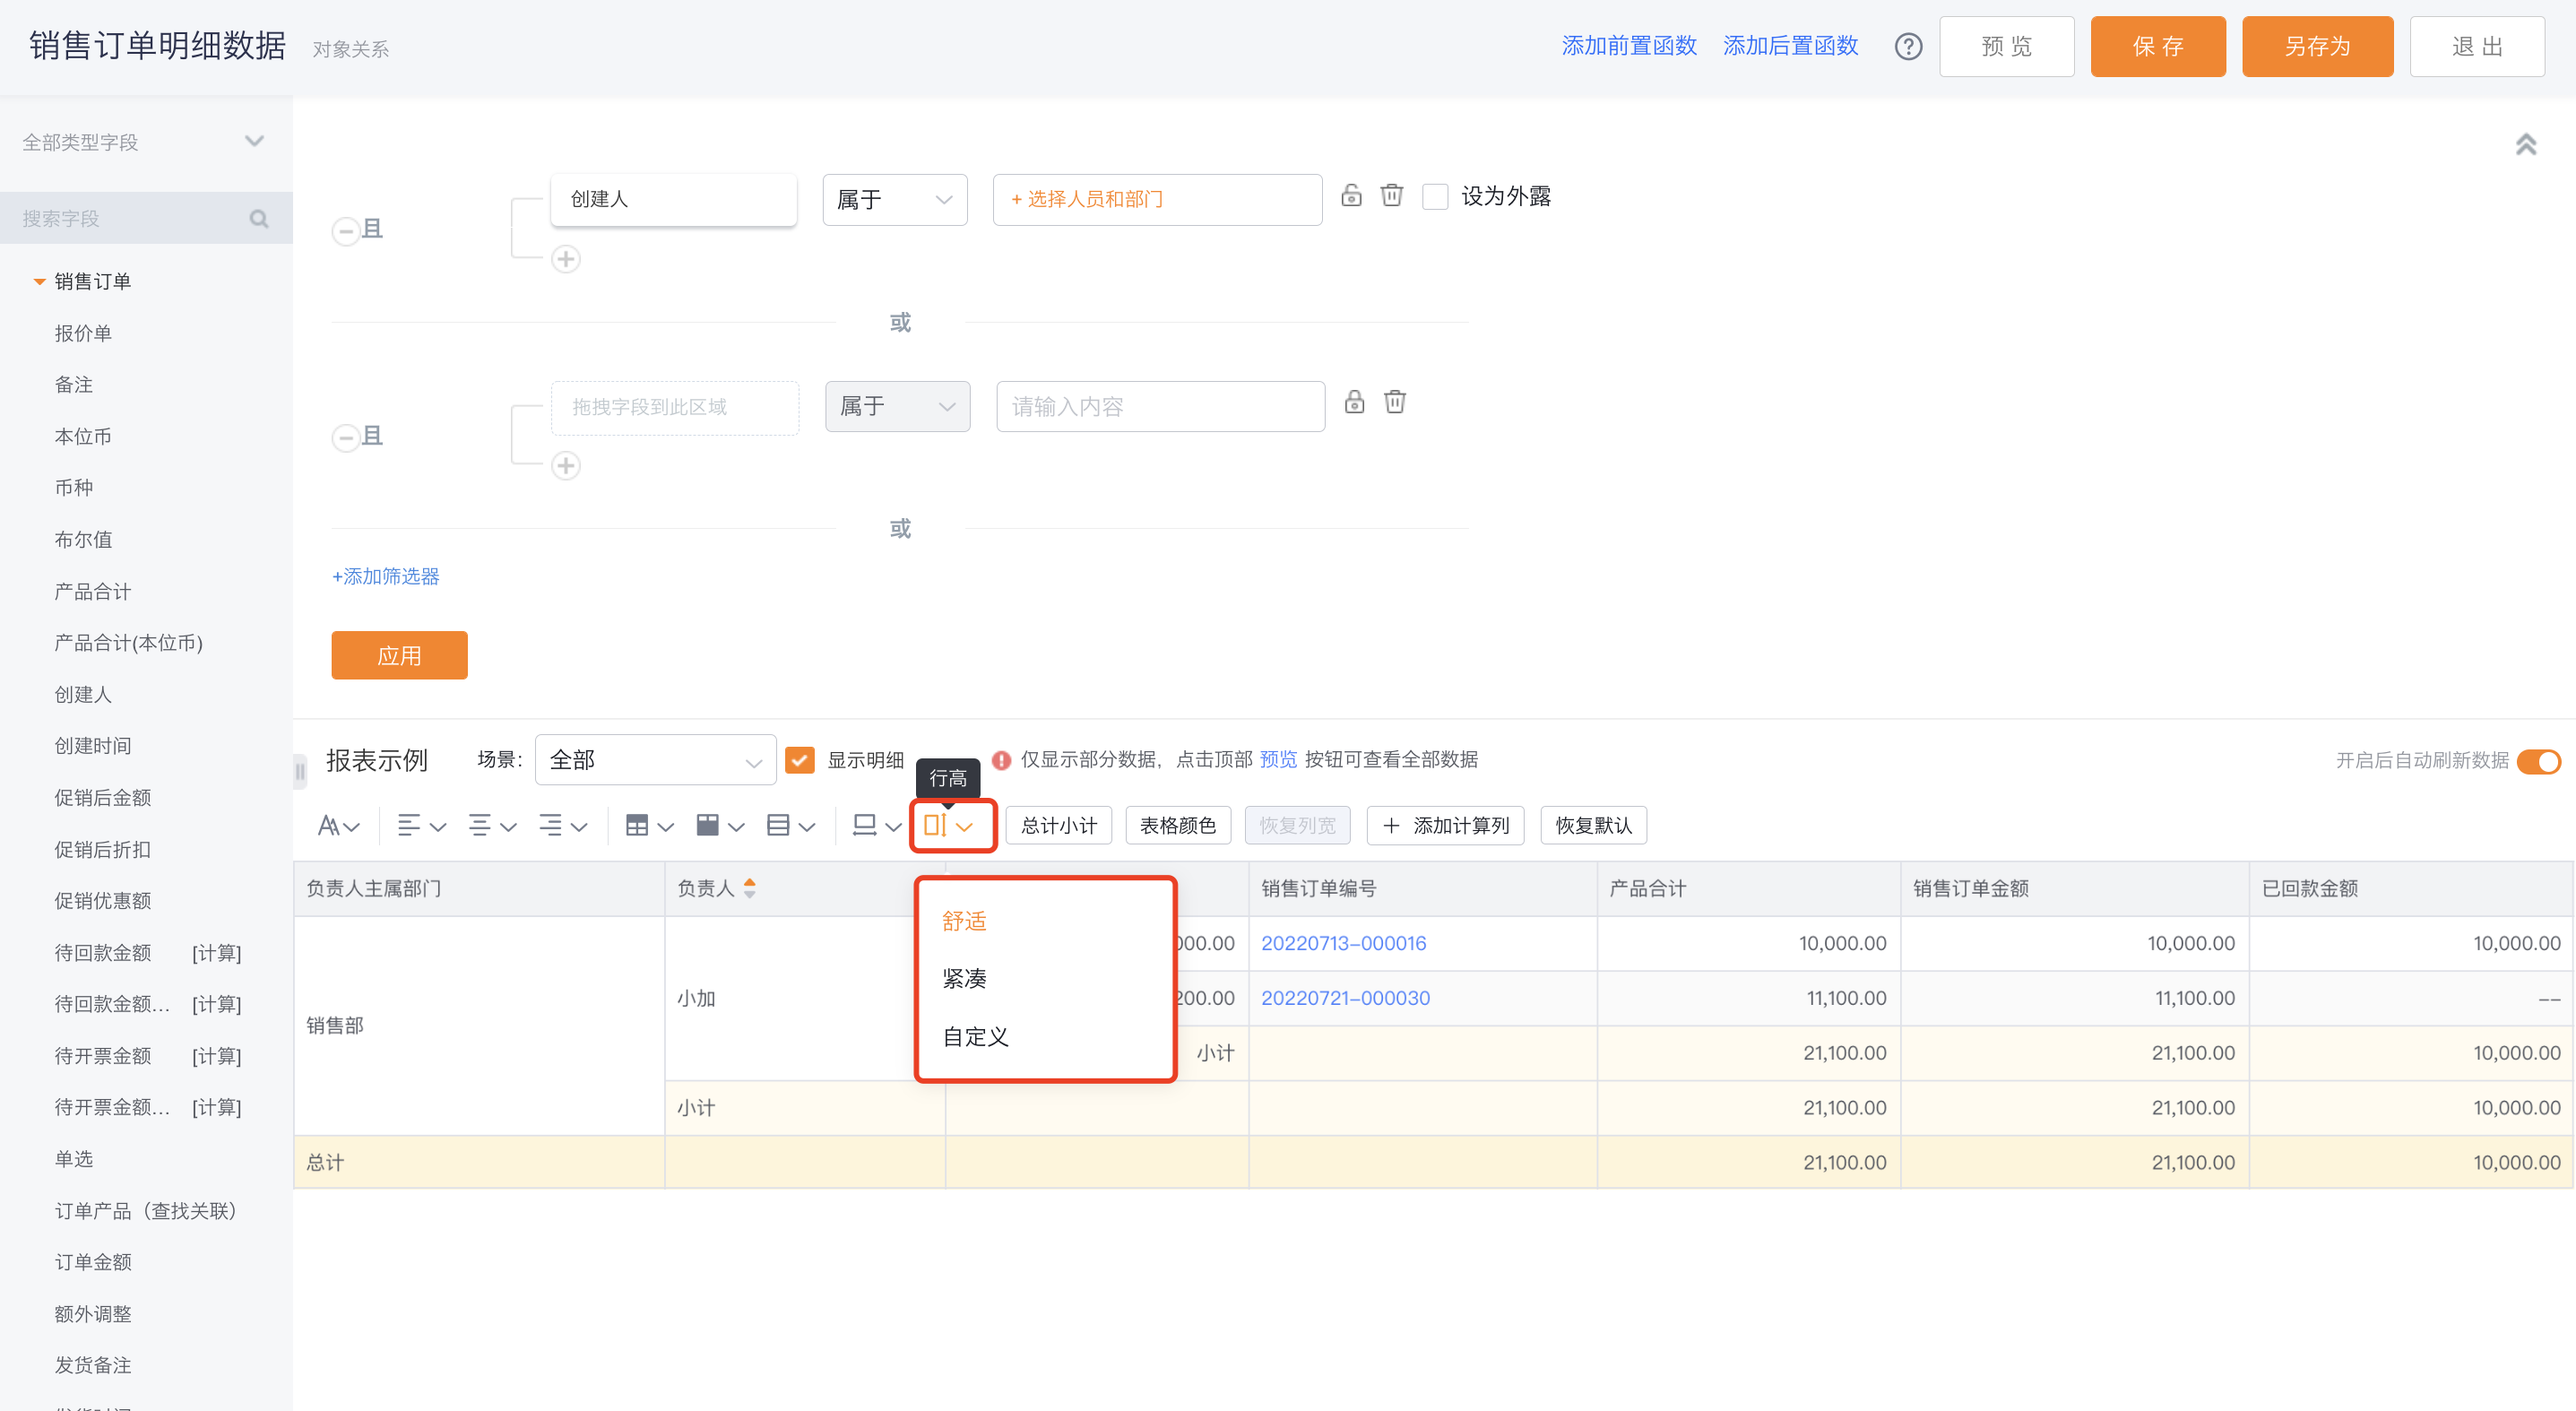
- Row height: Default is Comfortable; you can switch to Compact.
 </img>
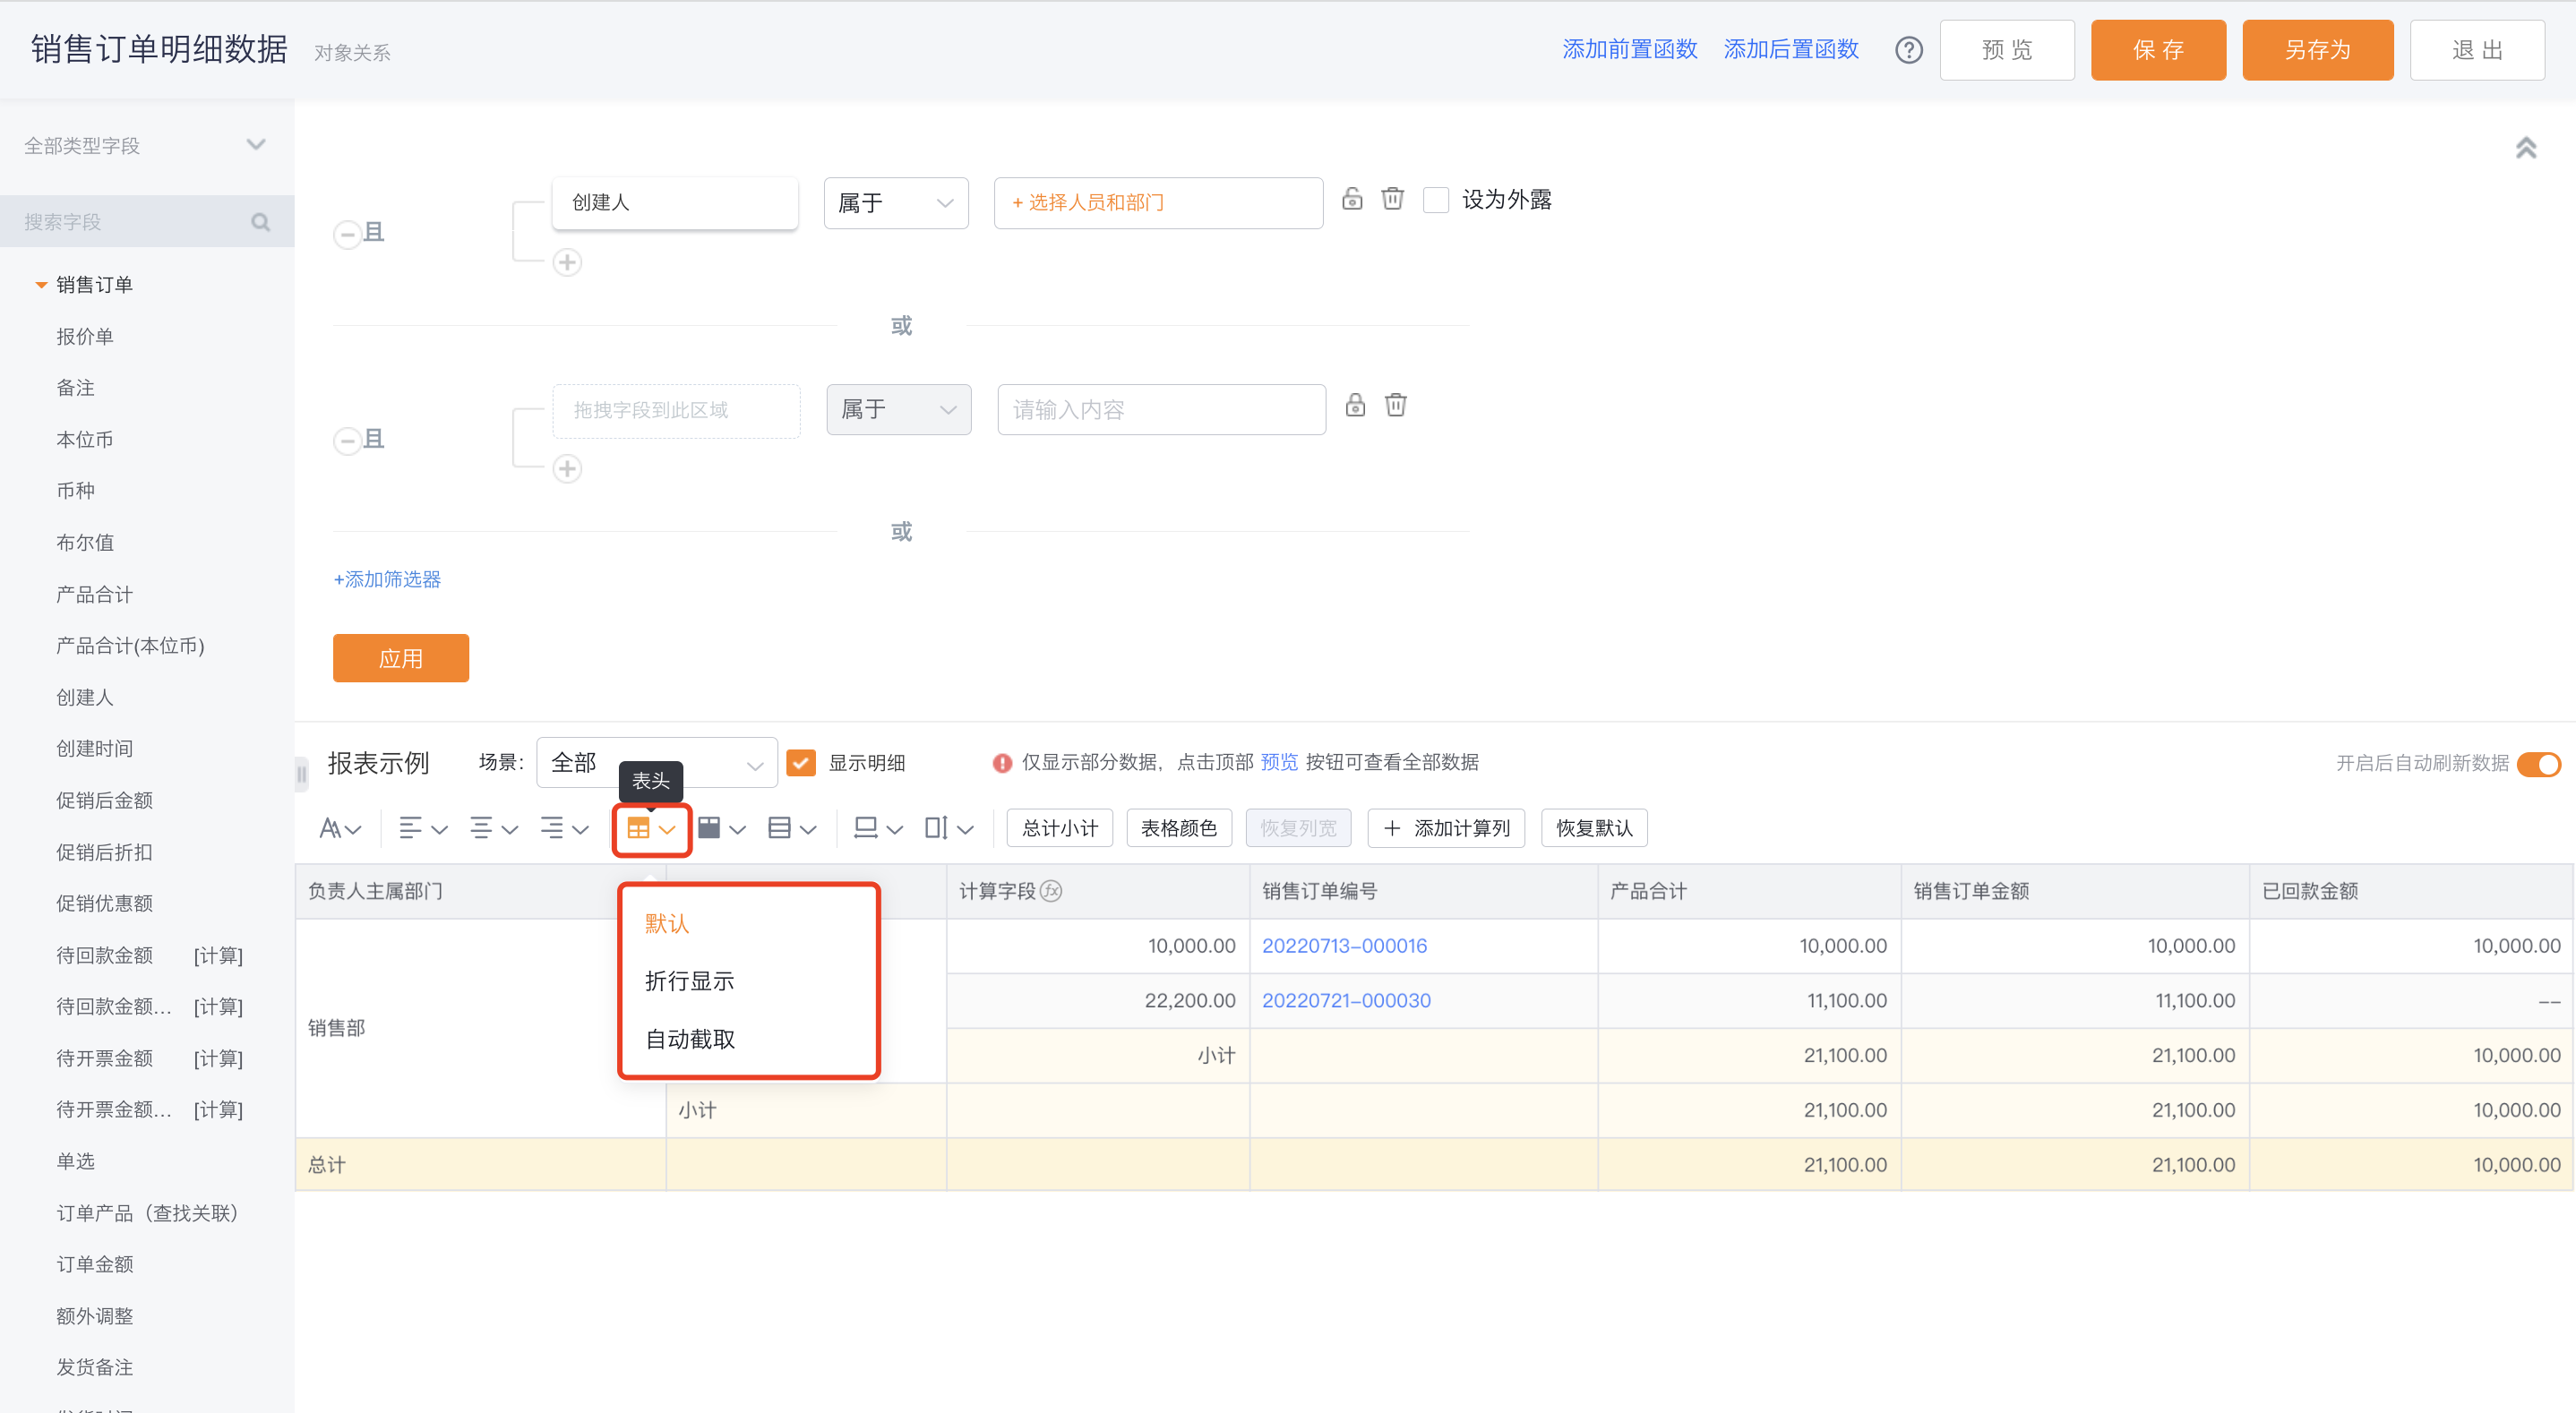
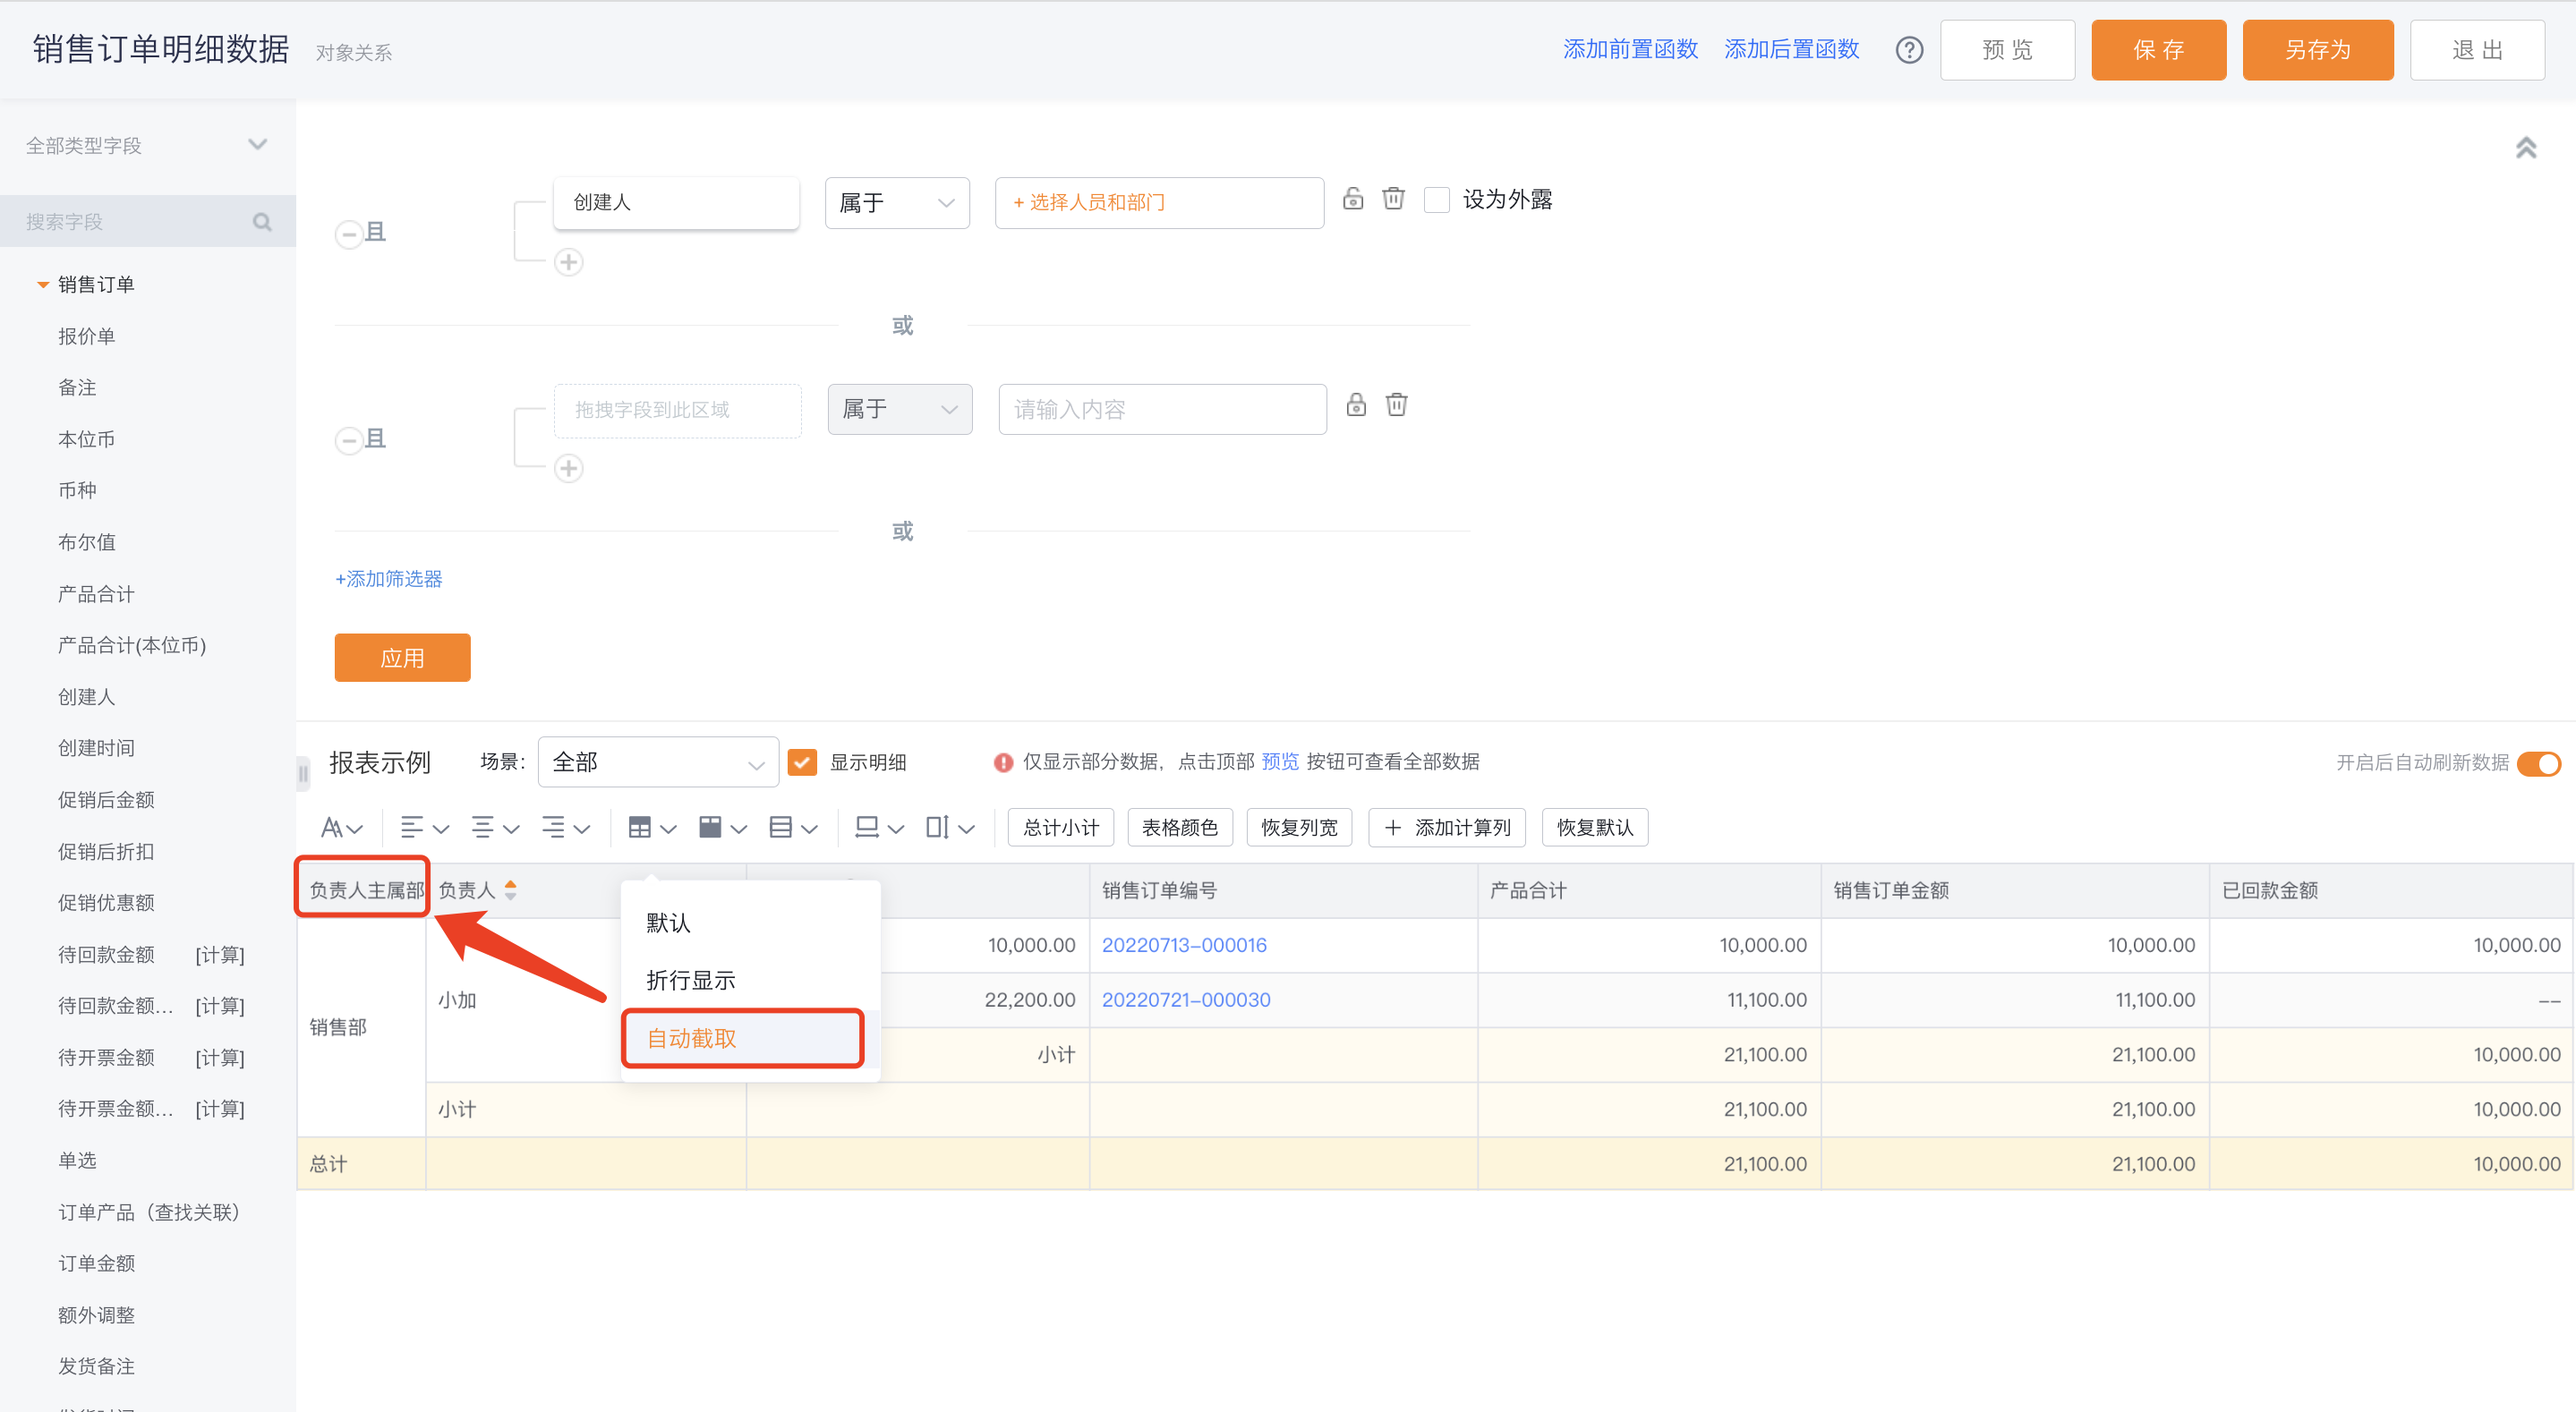
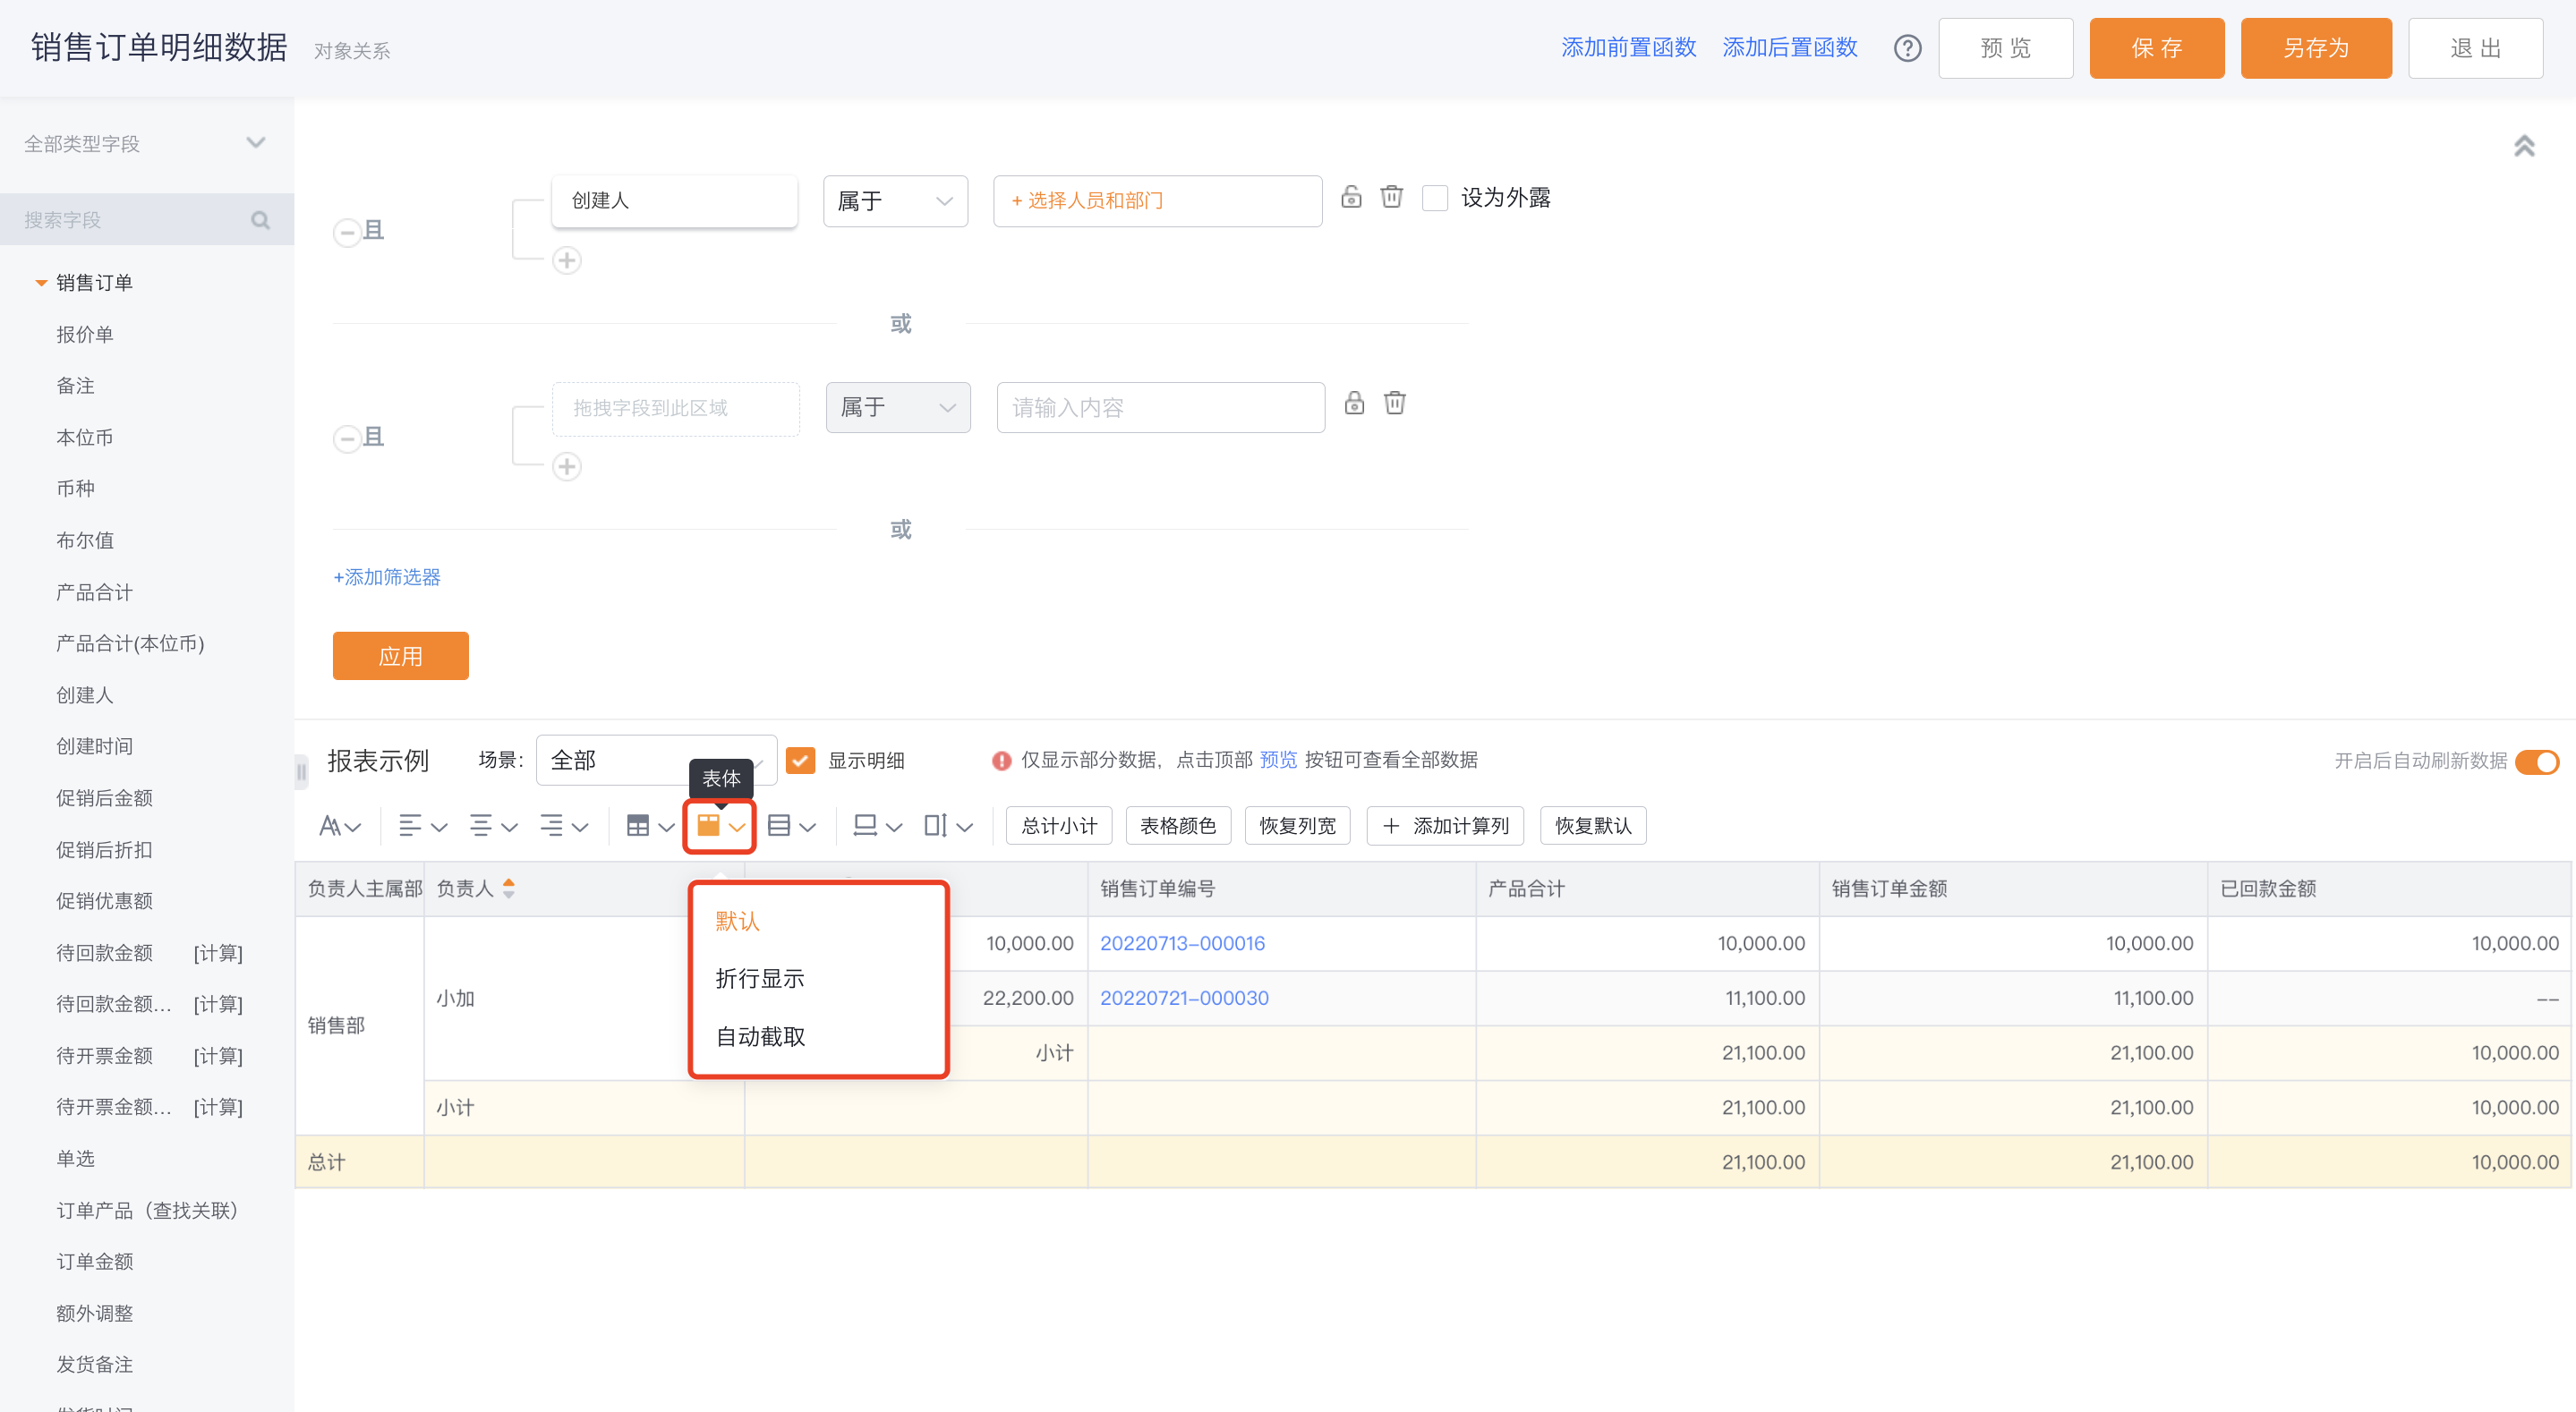
- Header display: Controls how table headers render. Options: Default, Wrap text, Auto truncate.
 </img>
- Default: Headers follow existing report logic. Content that exceeds column width shows "..."
 </img>
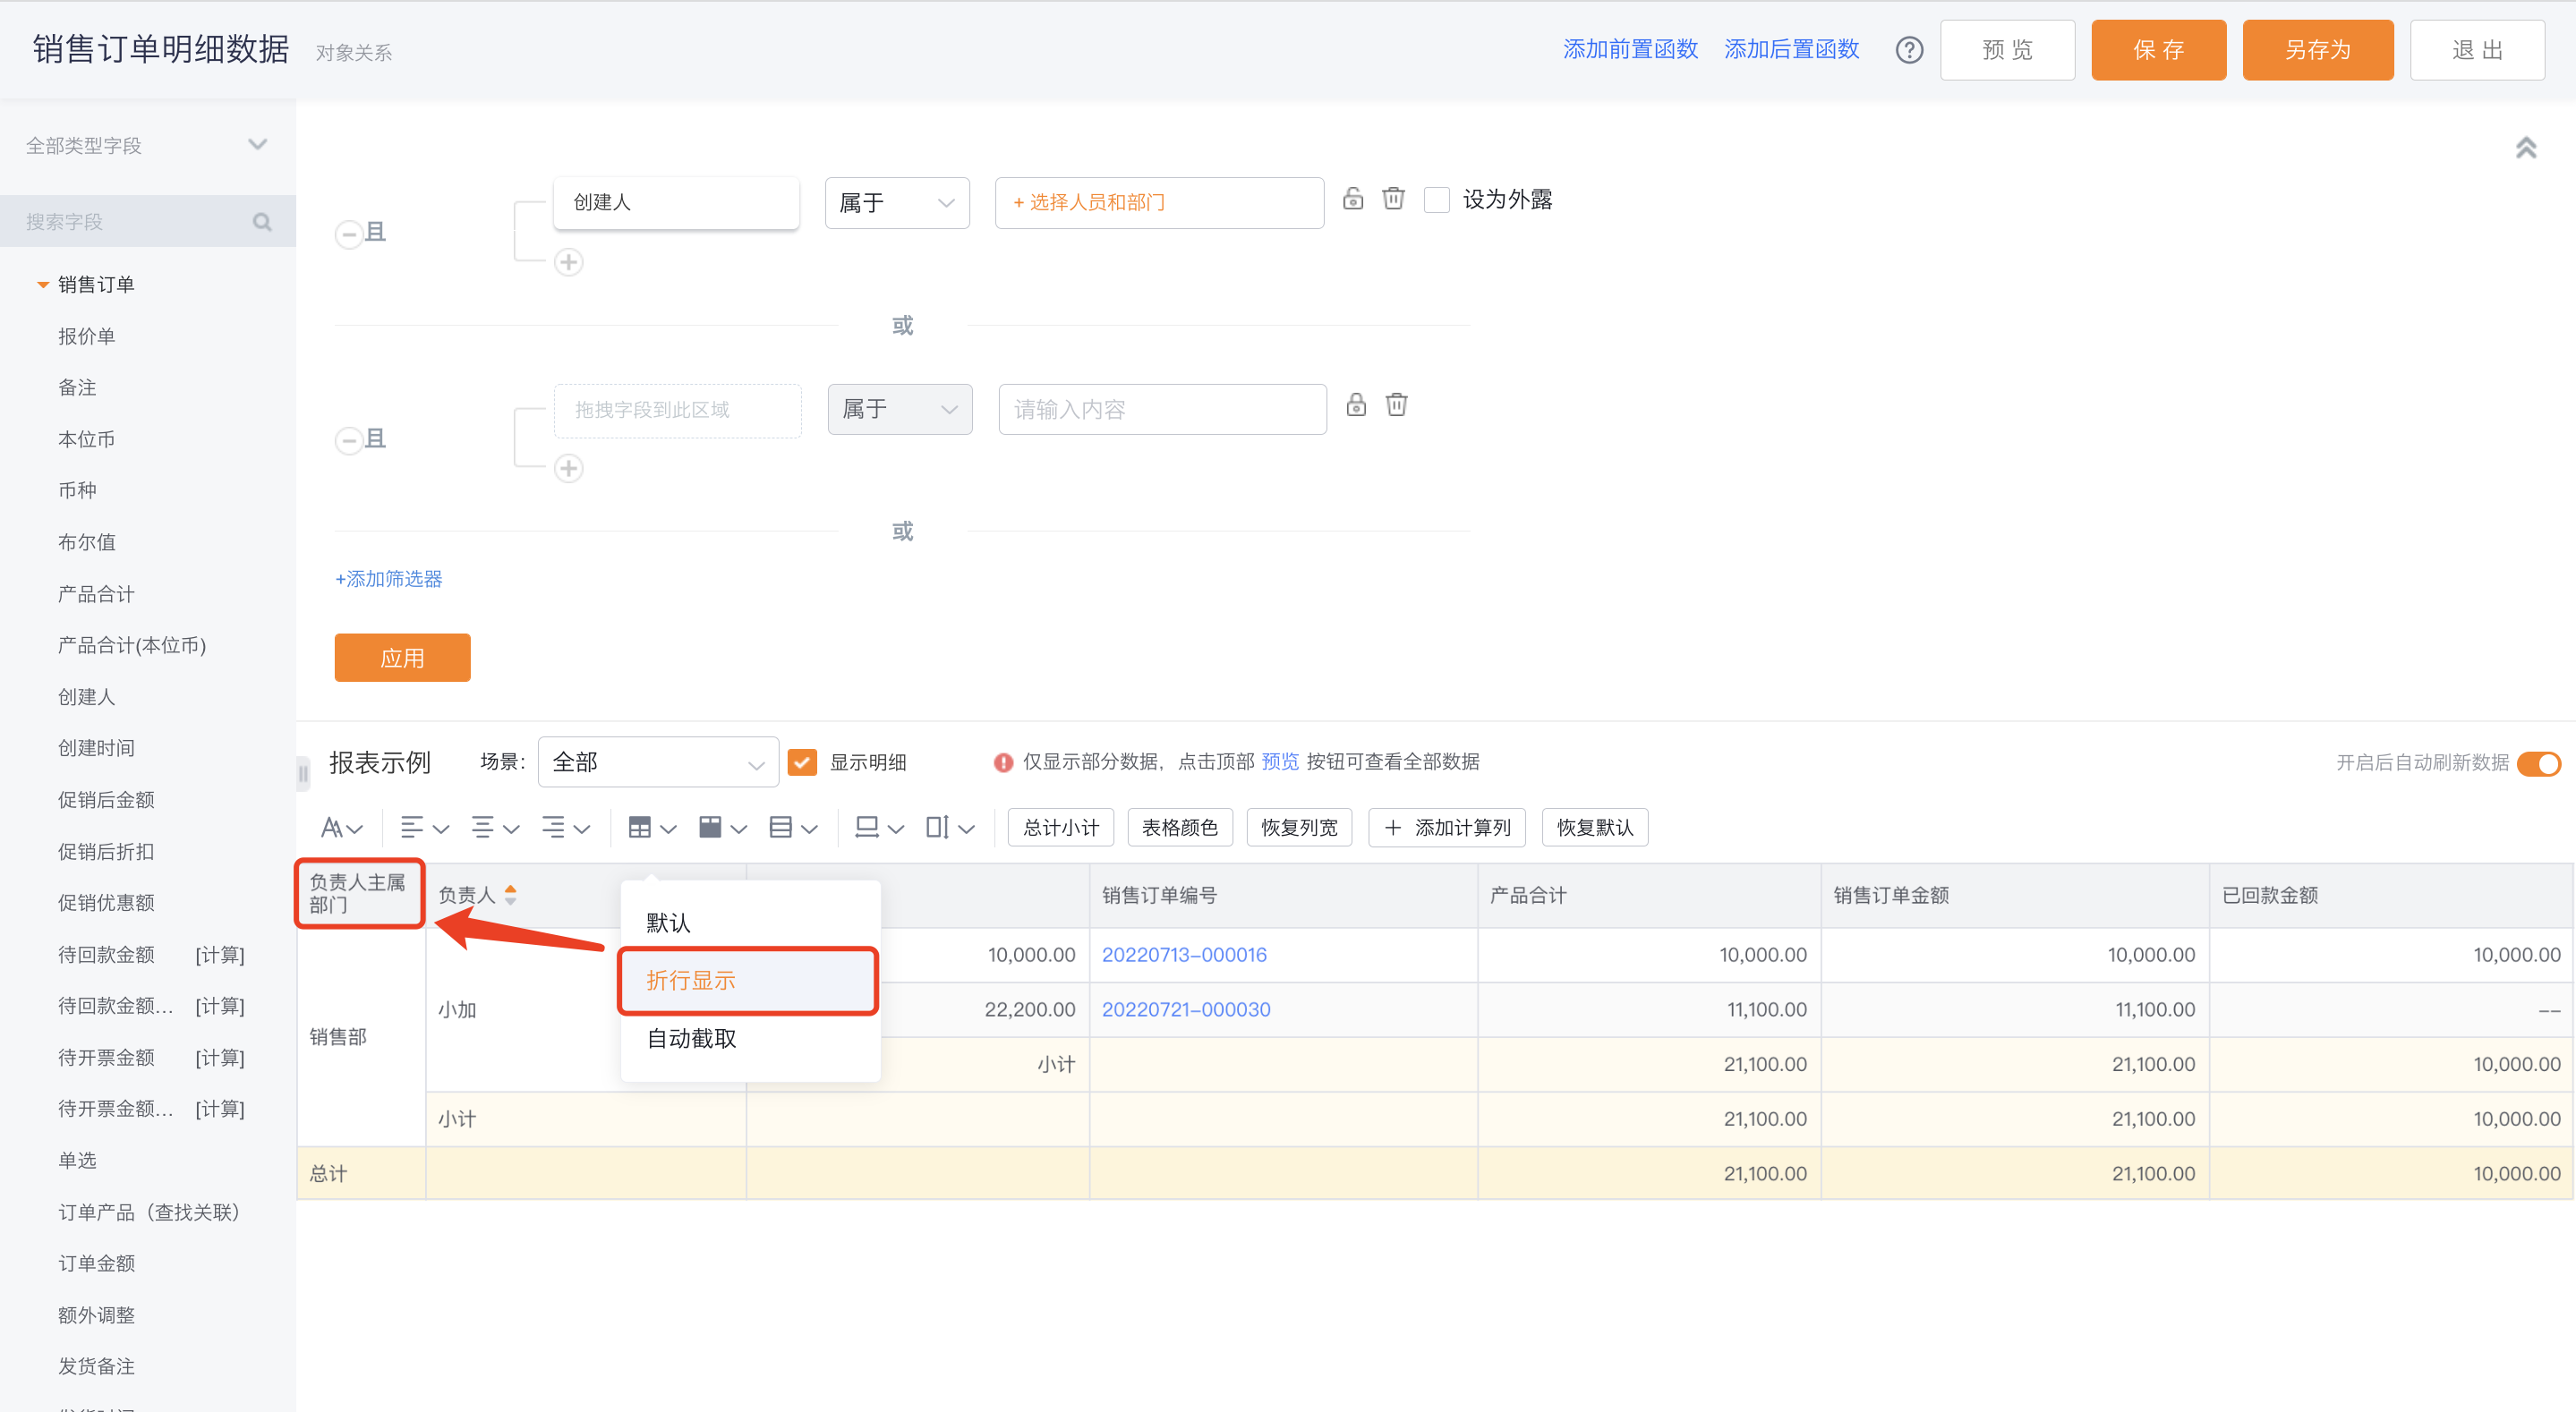
- Wrap text: Headers wrap within the column width when content overflows.
 </img>
- Auto truncate: Headers are truncated to the column width and trailing content is hidden.
 </img>
- Body display follows header settings; see "Header display" for details.
 </img>
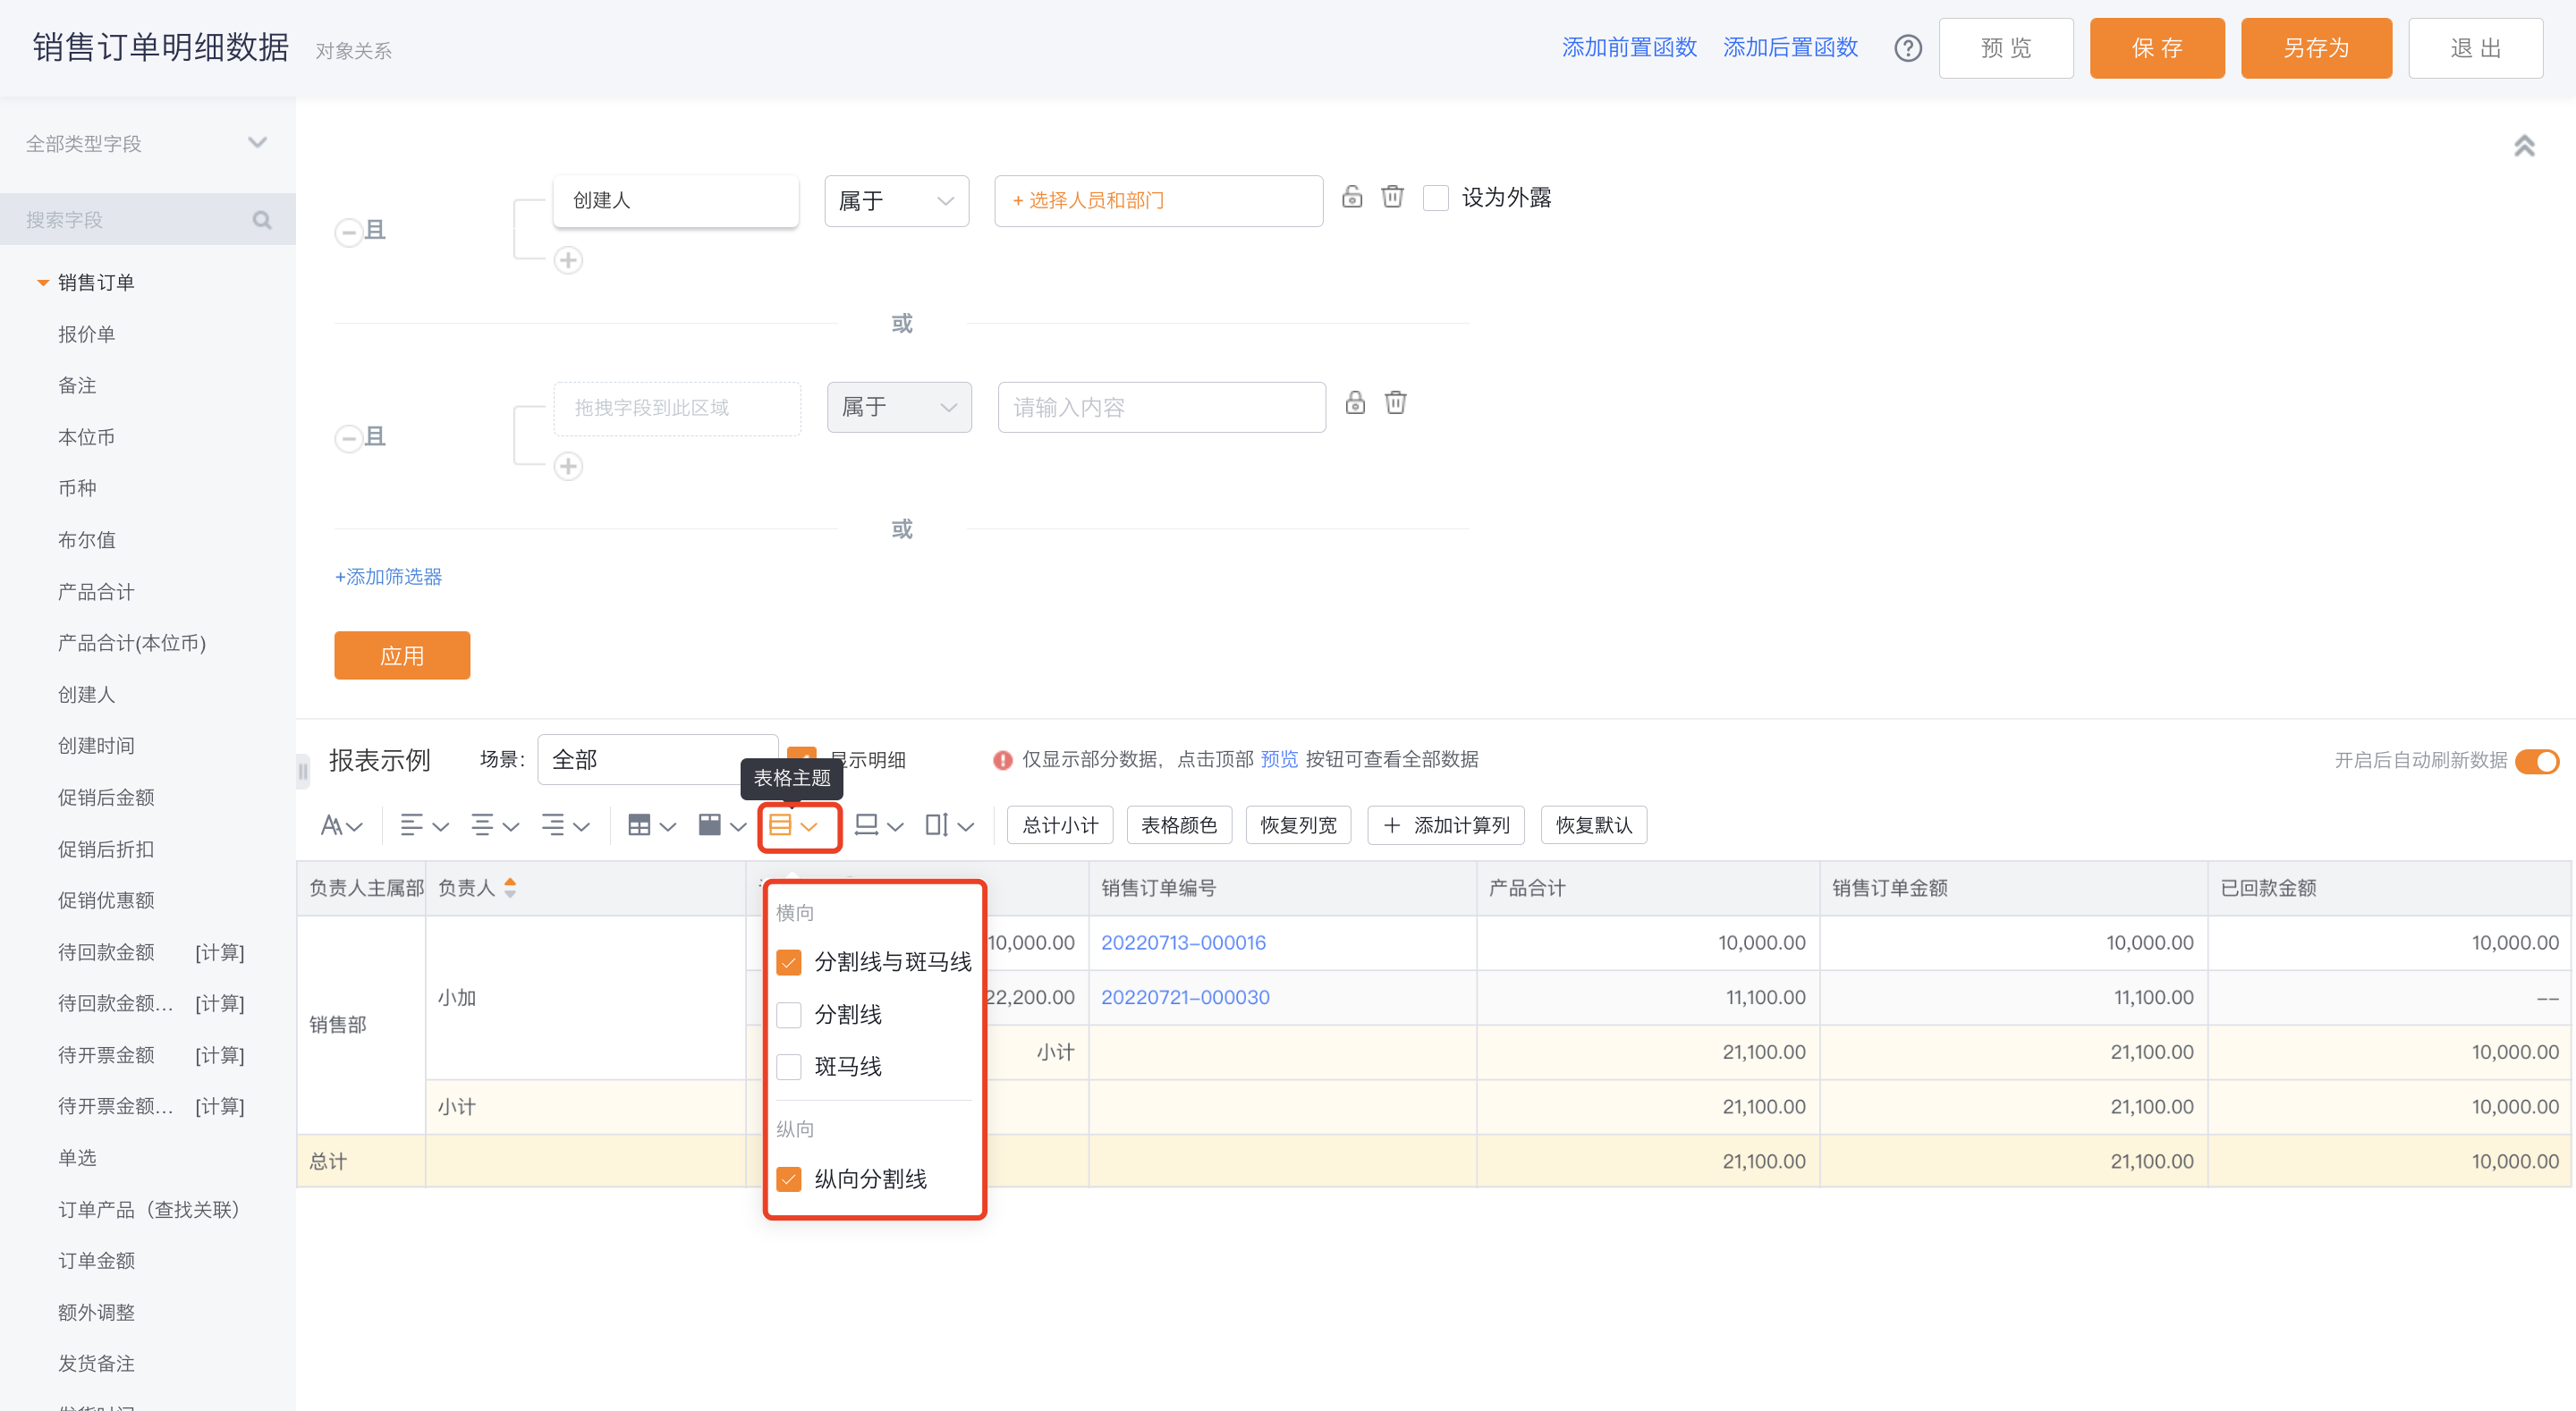
- Table theme: Configure overall table style: choose whether to show gridlines, Alternate Row Colors, and vertical gridlines. Defaults: show gridlines and Alternate Row Colors, and enable vertical gridlines.
- Gridlines + Alternate Row Colors: both visible
- Gridlines only: only gridlines visible
- Alternate Row Colors only: only zebra striping visible
- Vertical gridlines: Only applicable when Gridlines are enabled; disabled when Alternate Row Colors is selected
 </img>
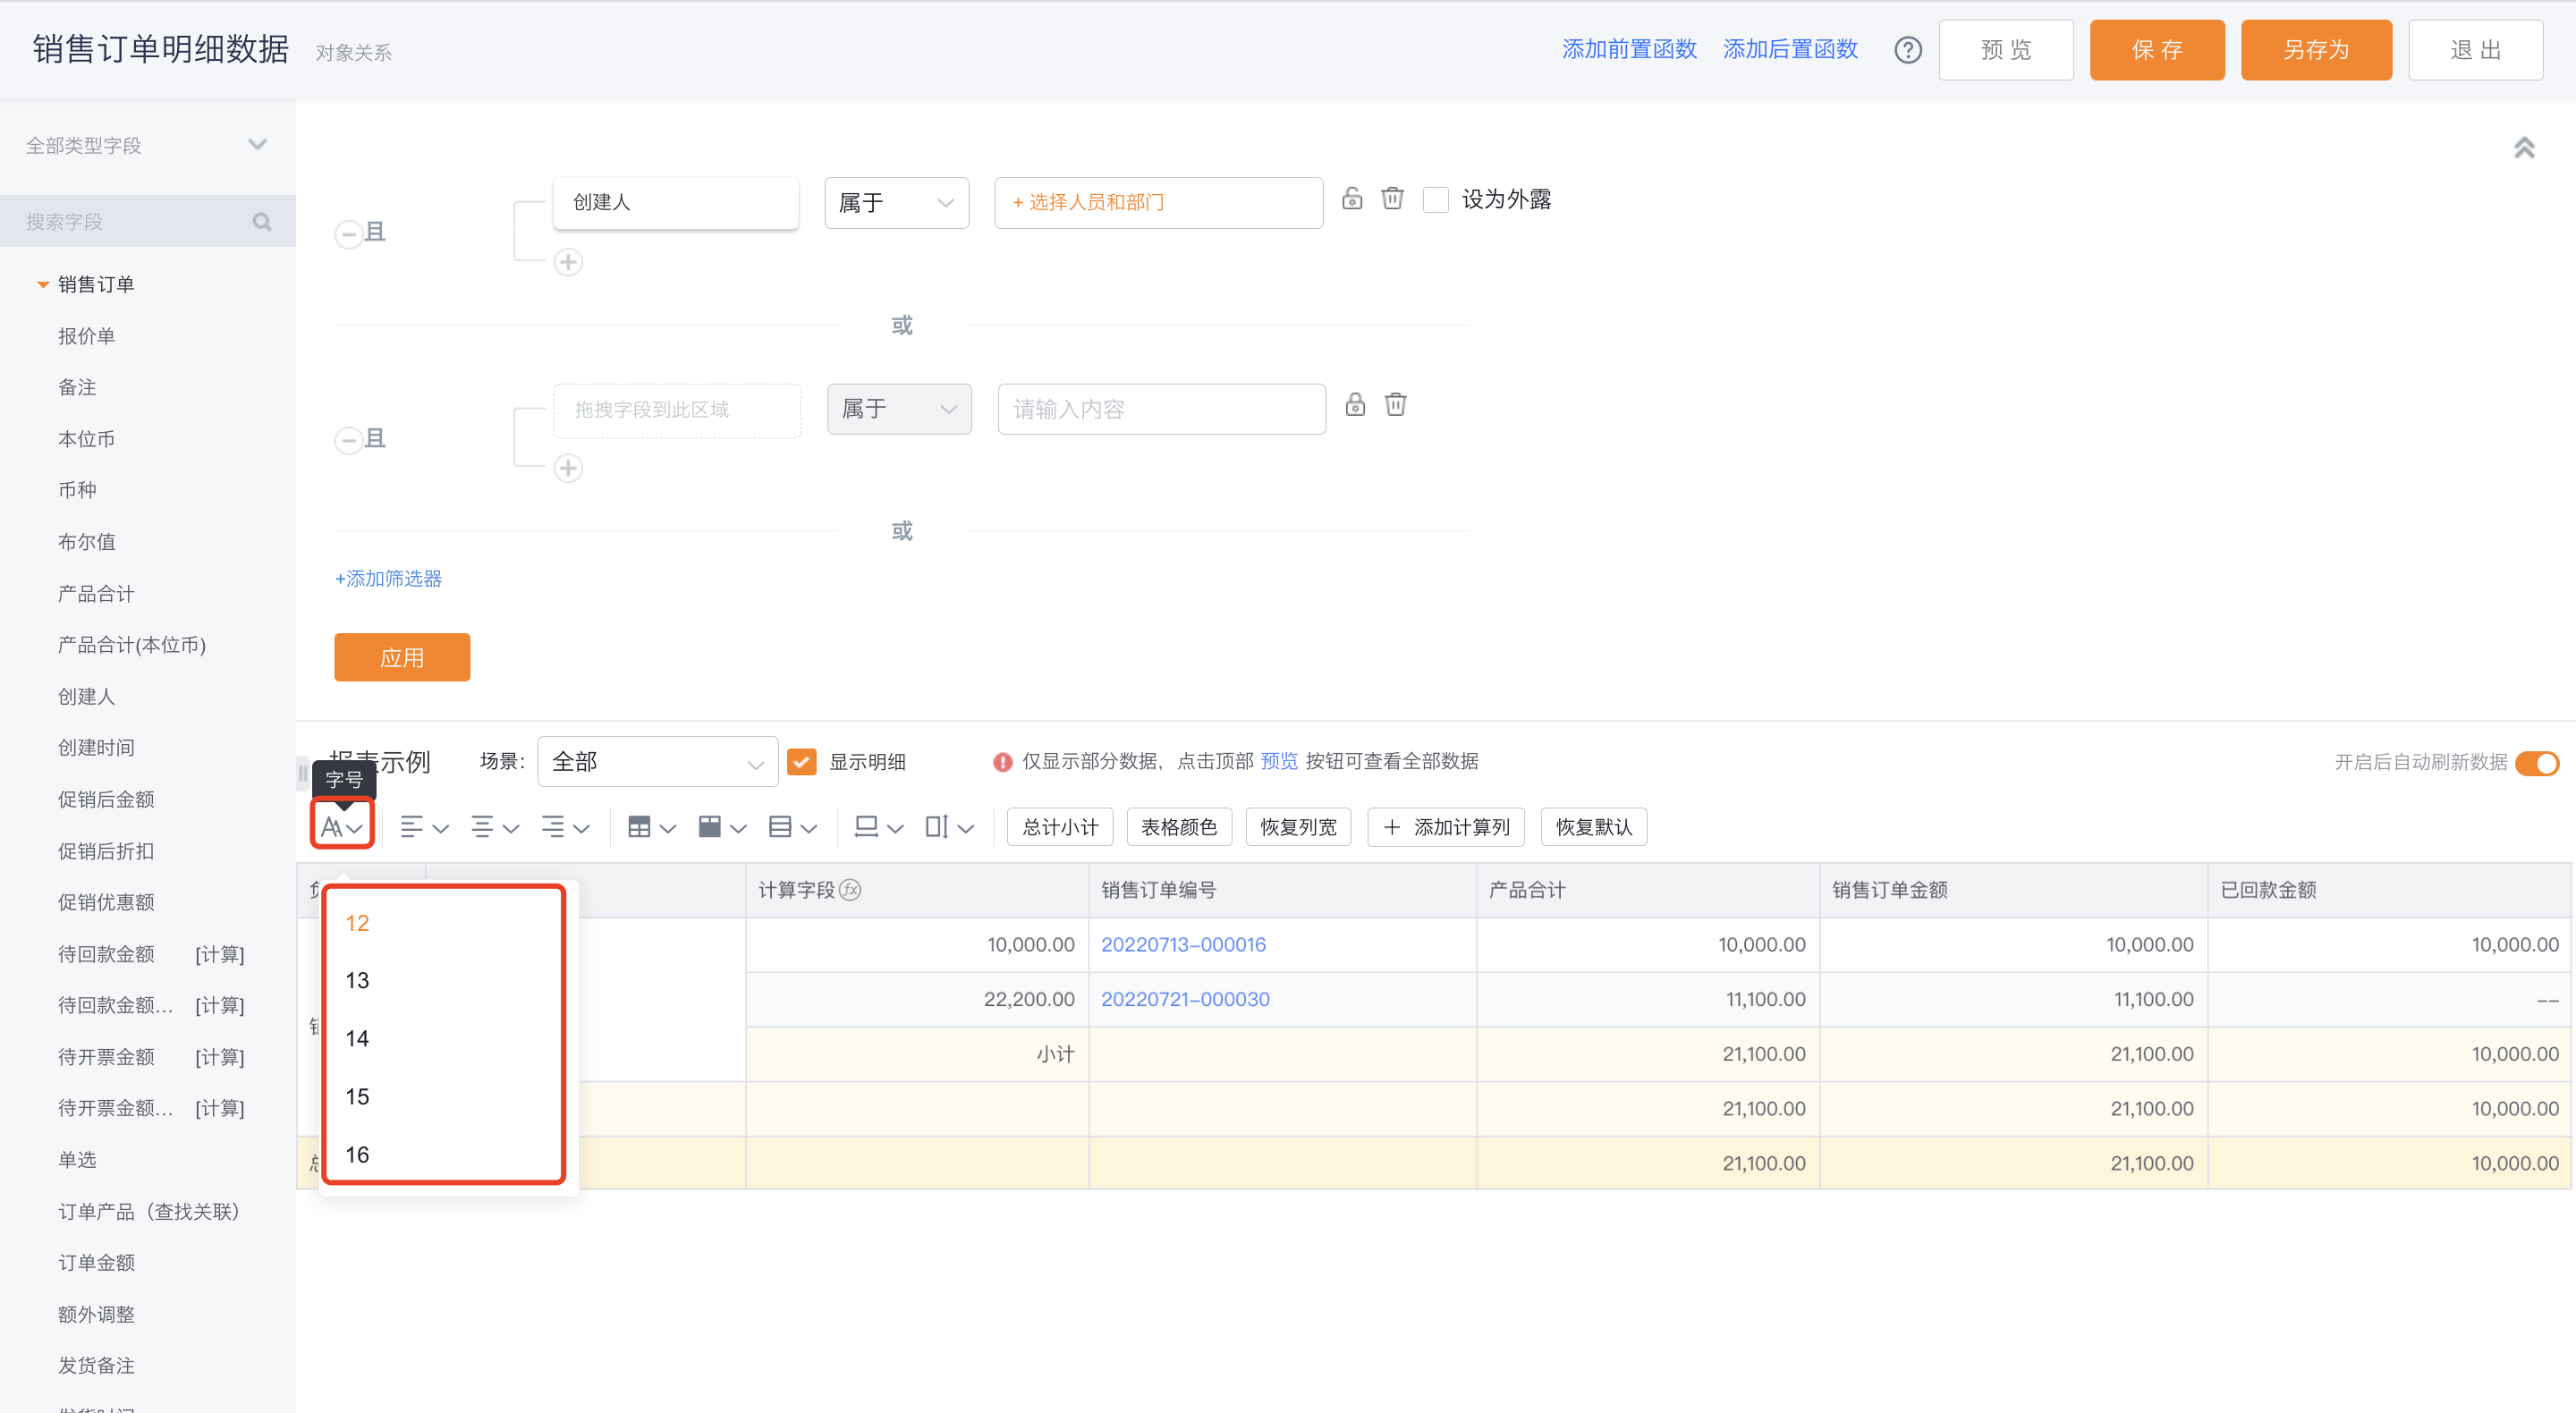
- Font size: Default 12; options: 13, 14, 15, 16.
 </img>
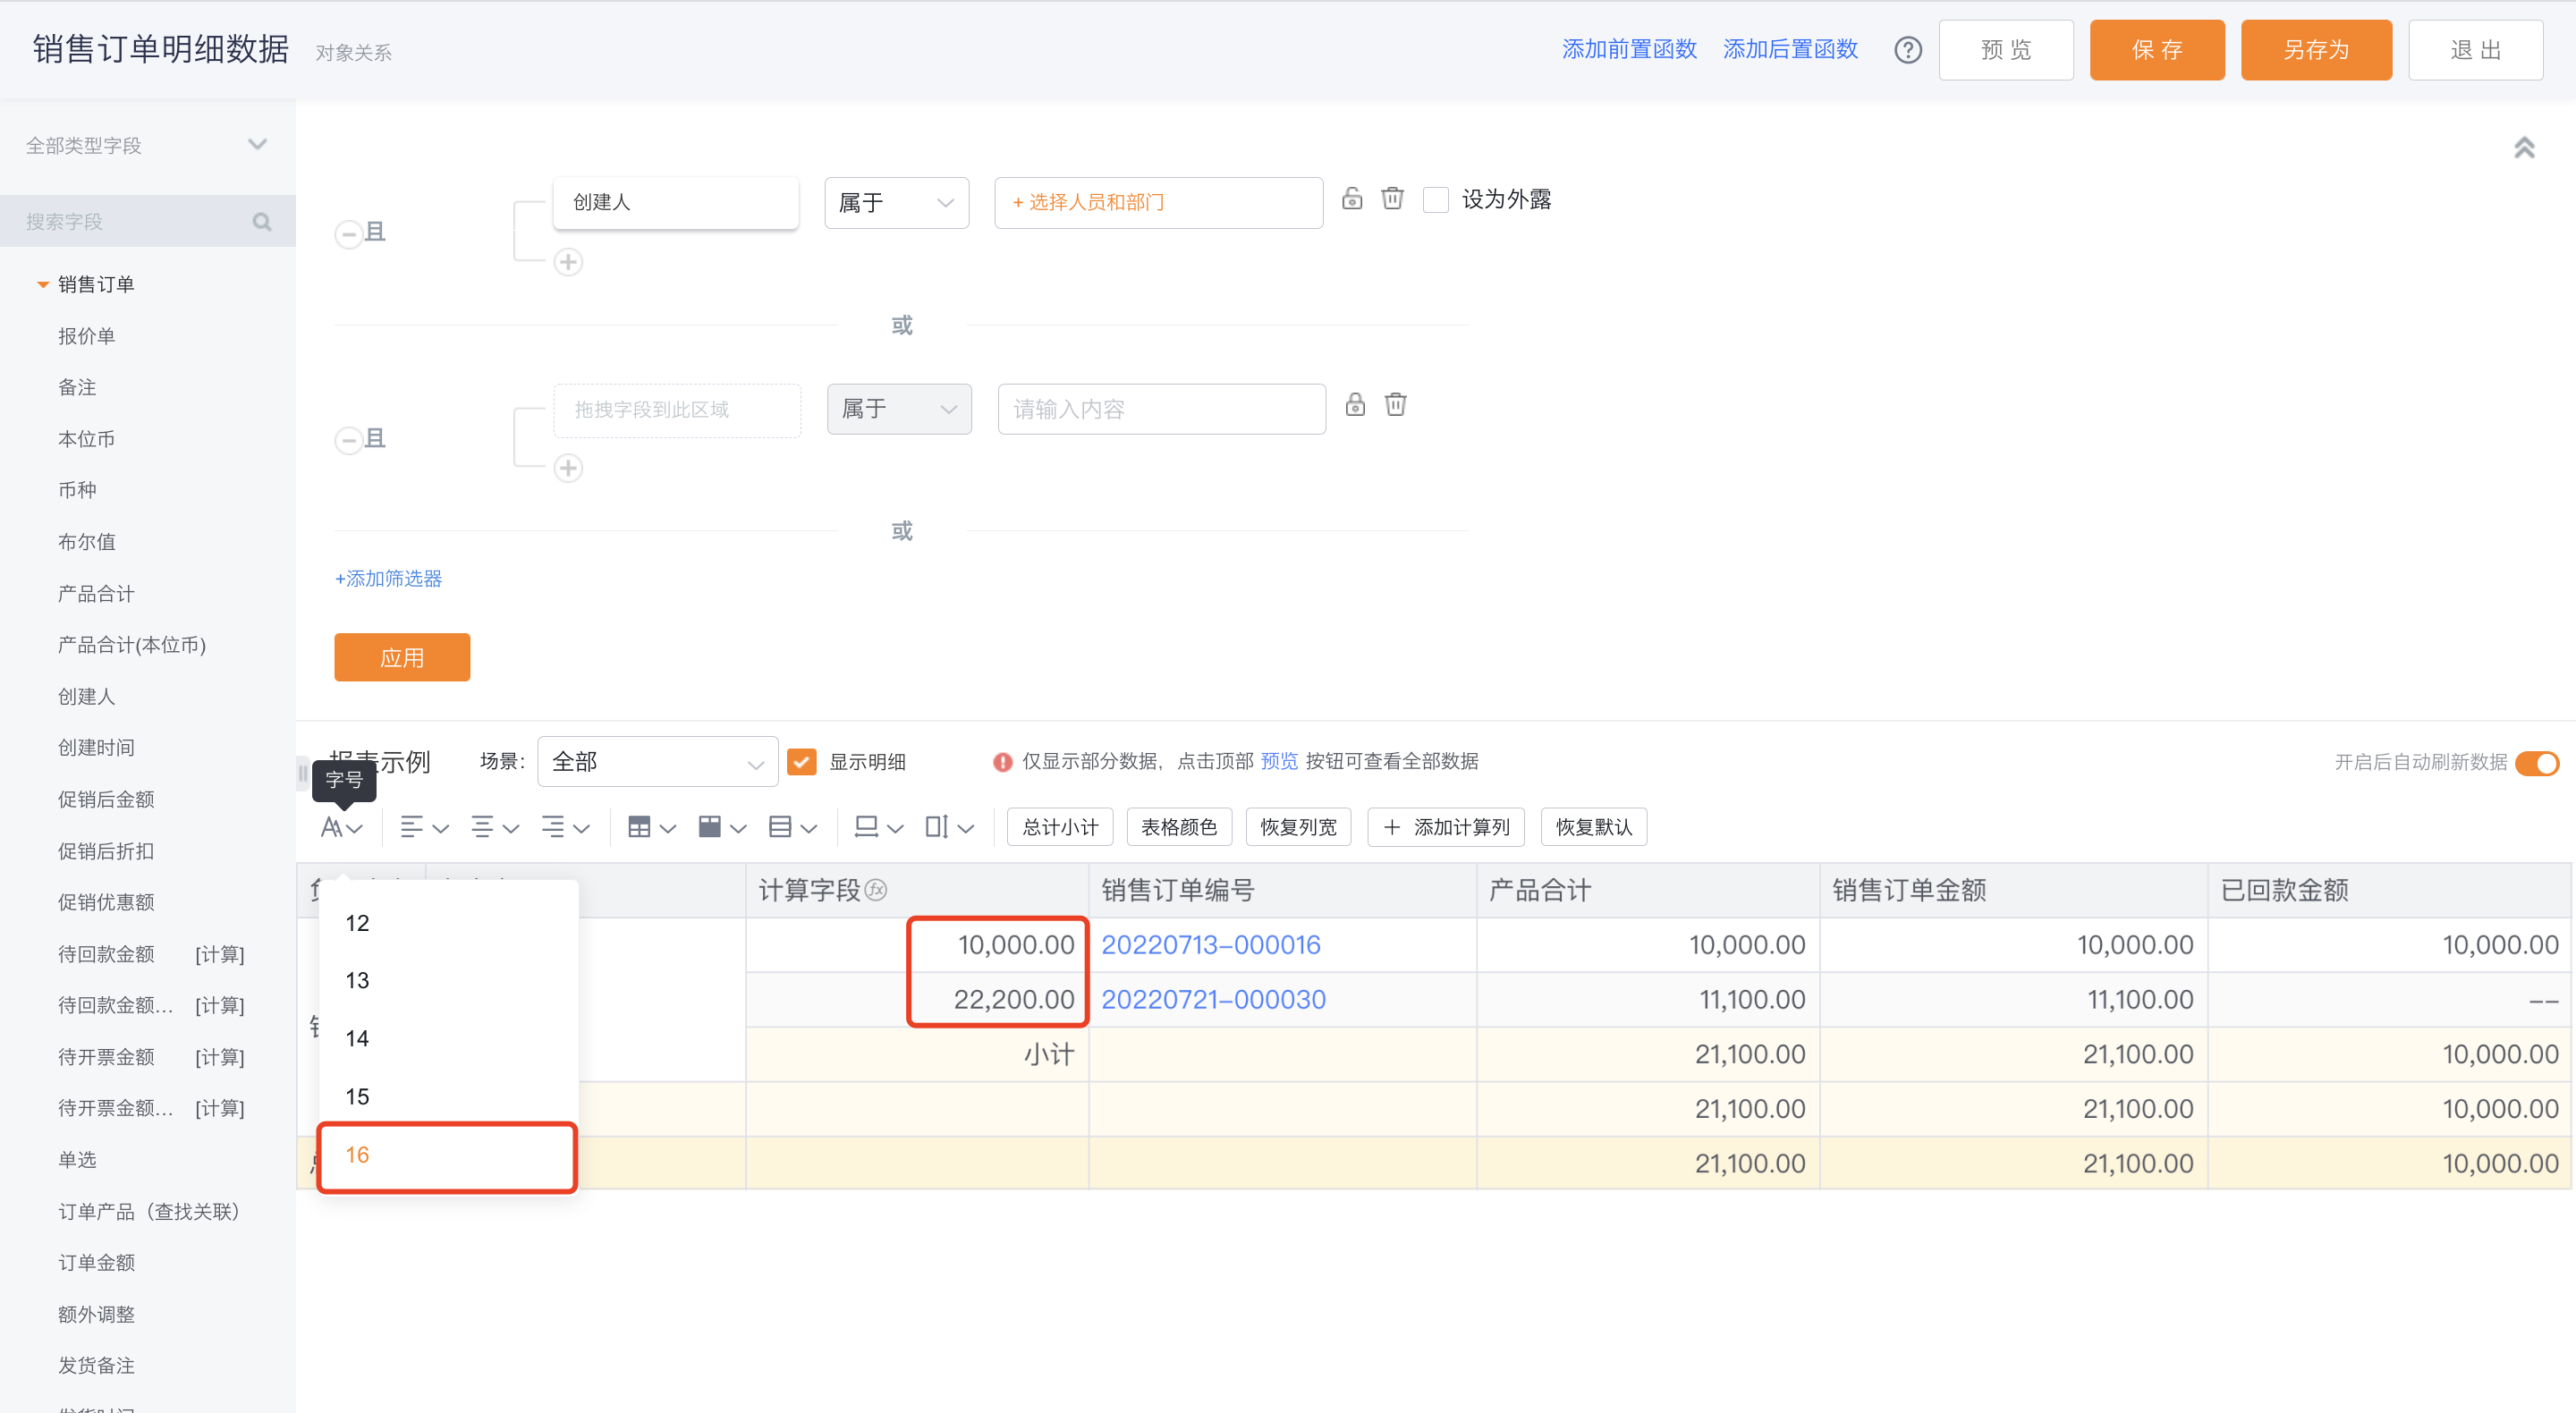 </img>
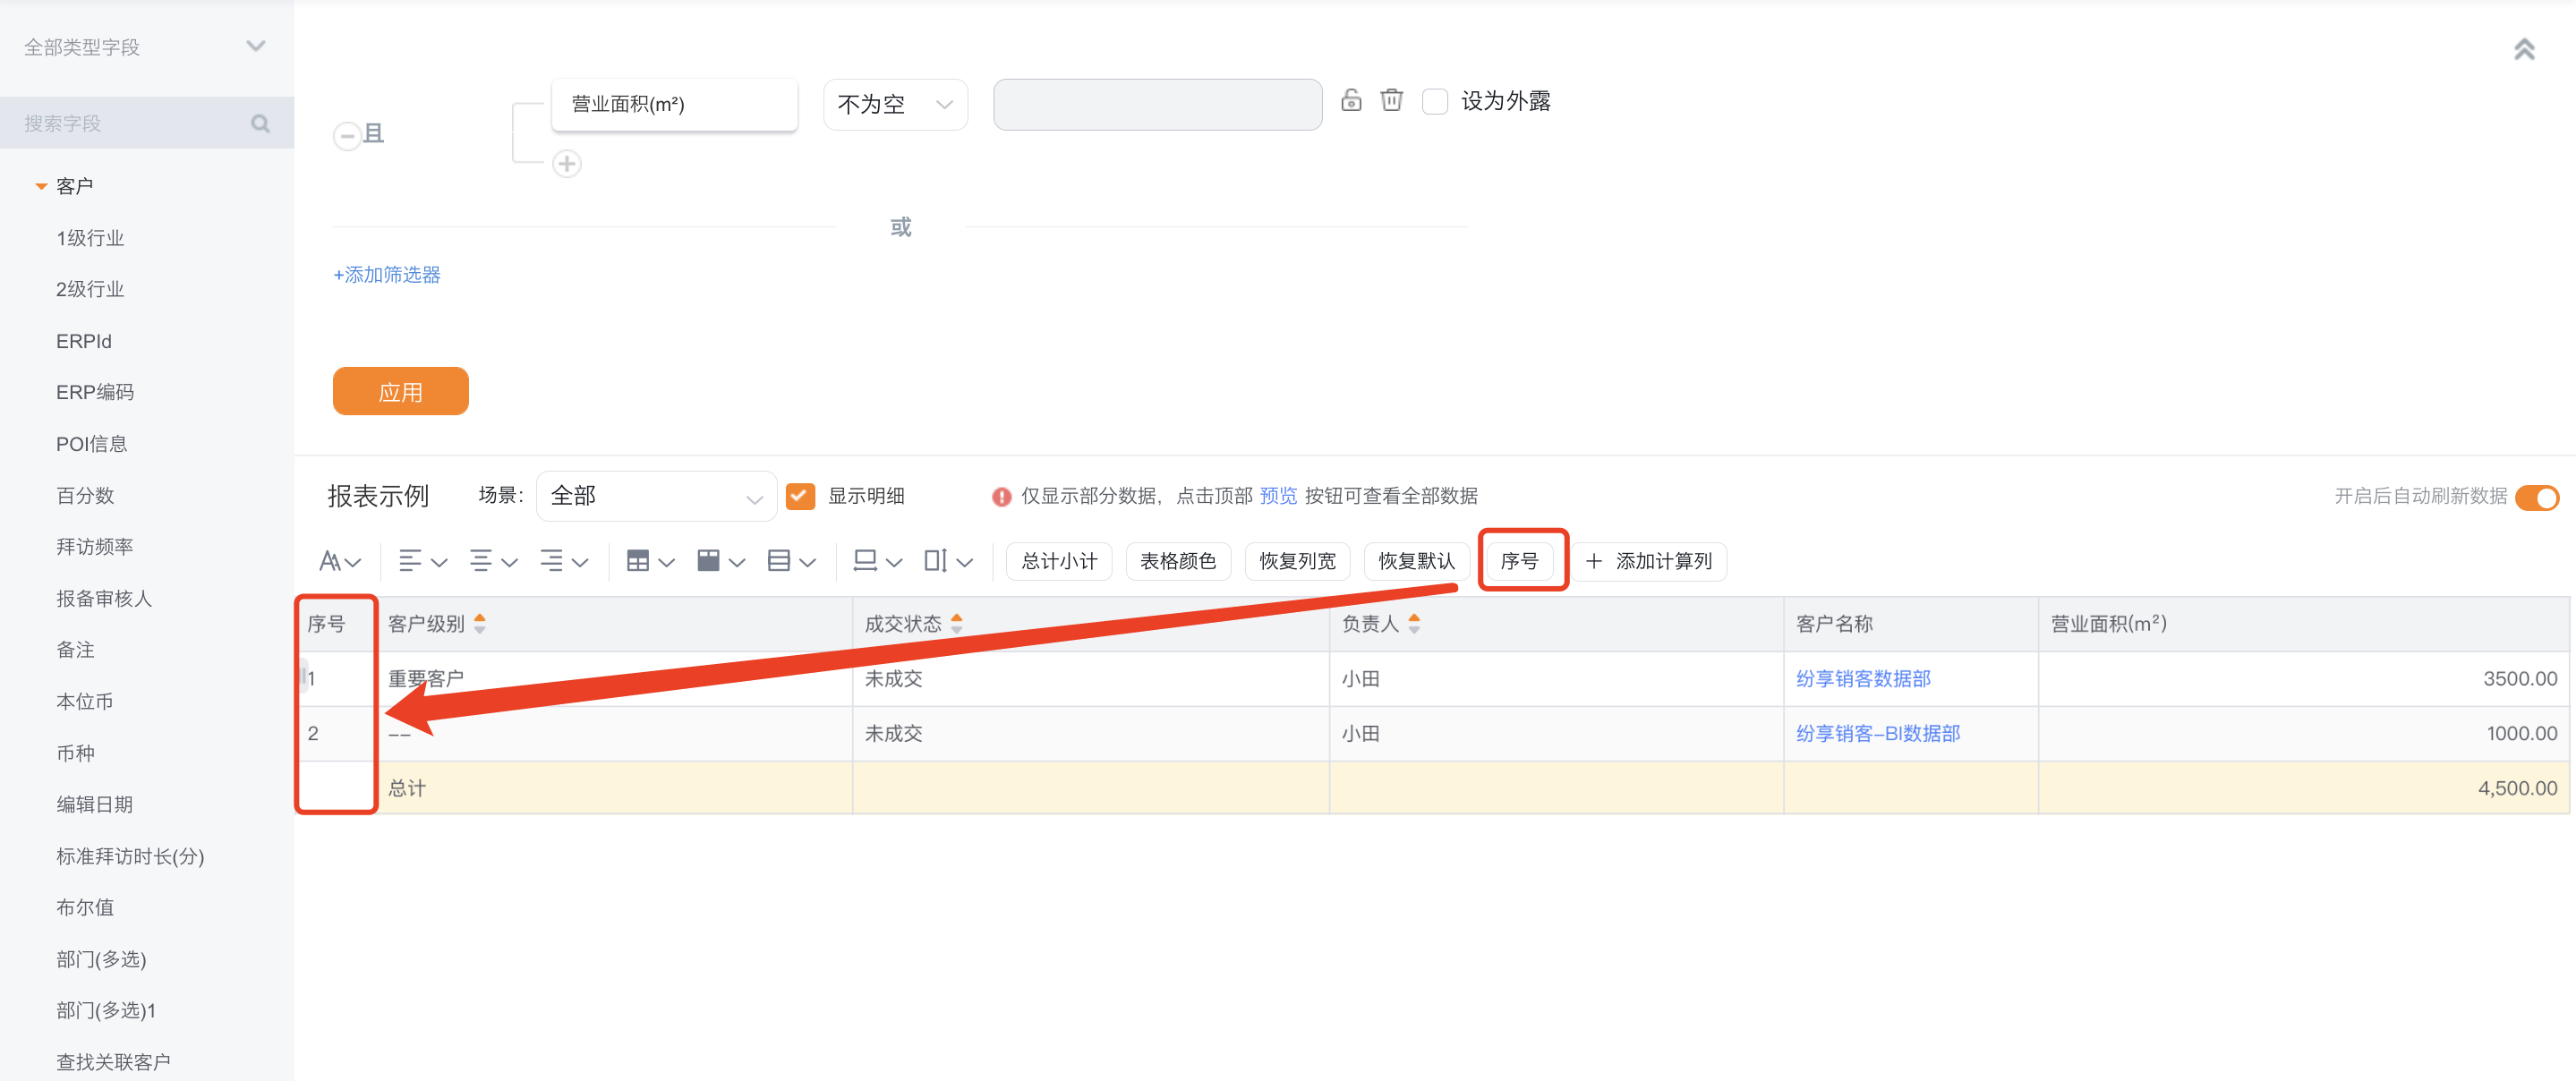
- Serial numbers (SN): Support SN generation based on grouping, merging, or detail rows.
 </img>
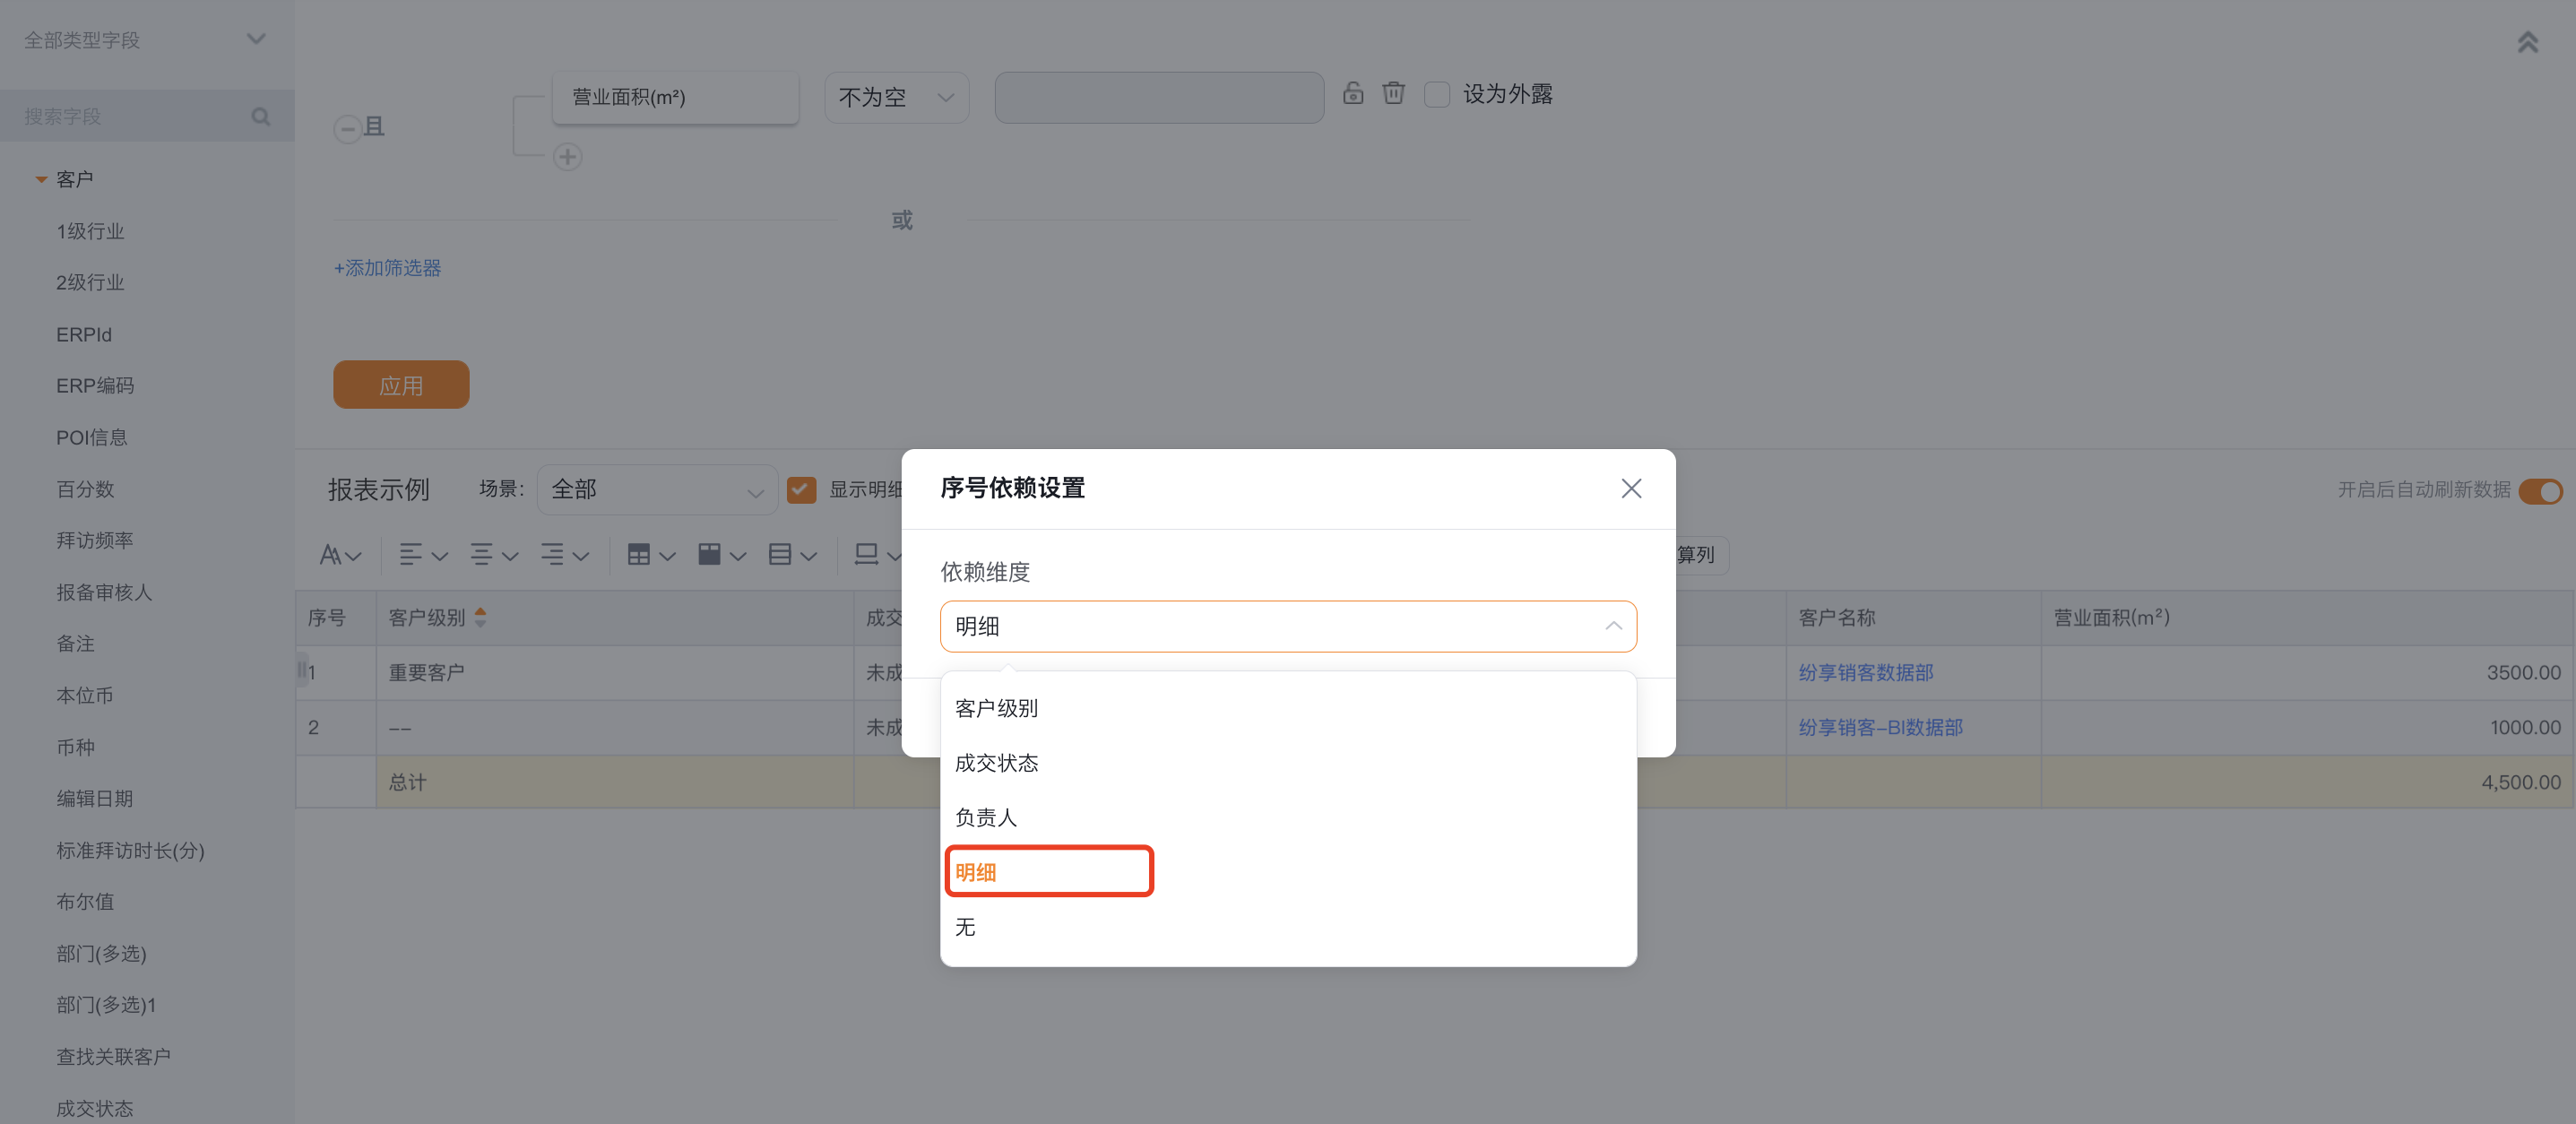 </img>
 </img>
Add SN by detail
 </img>
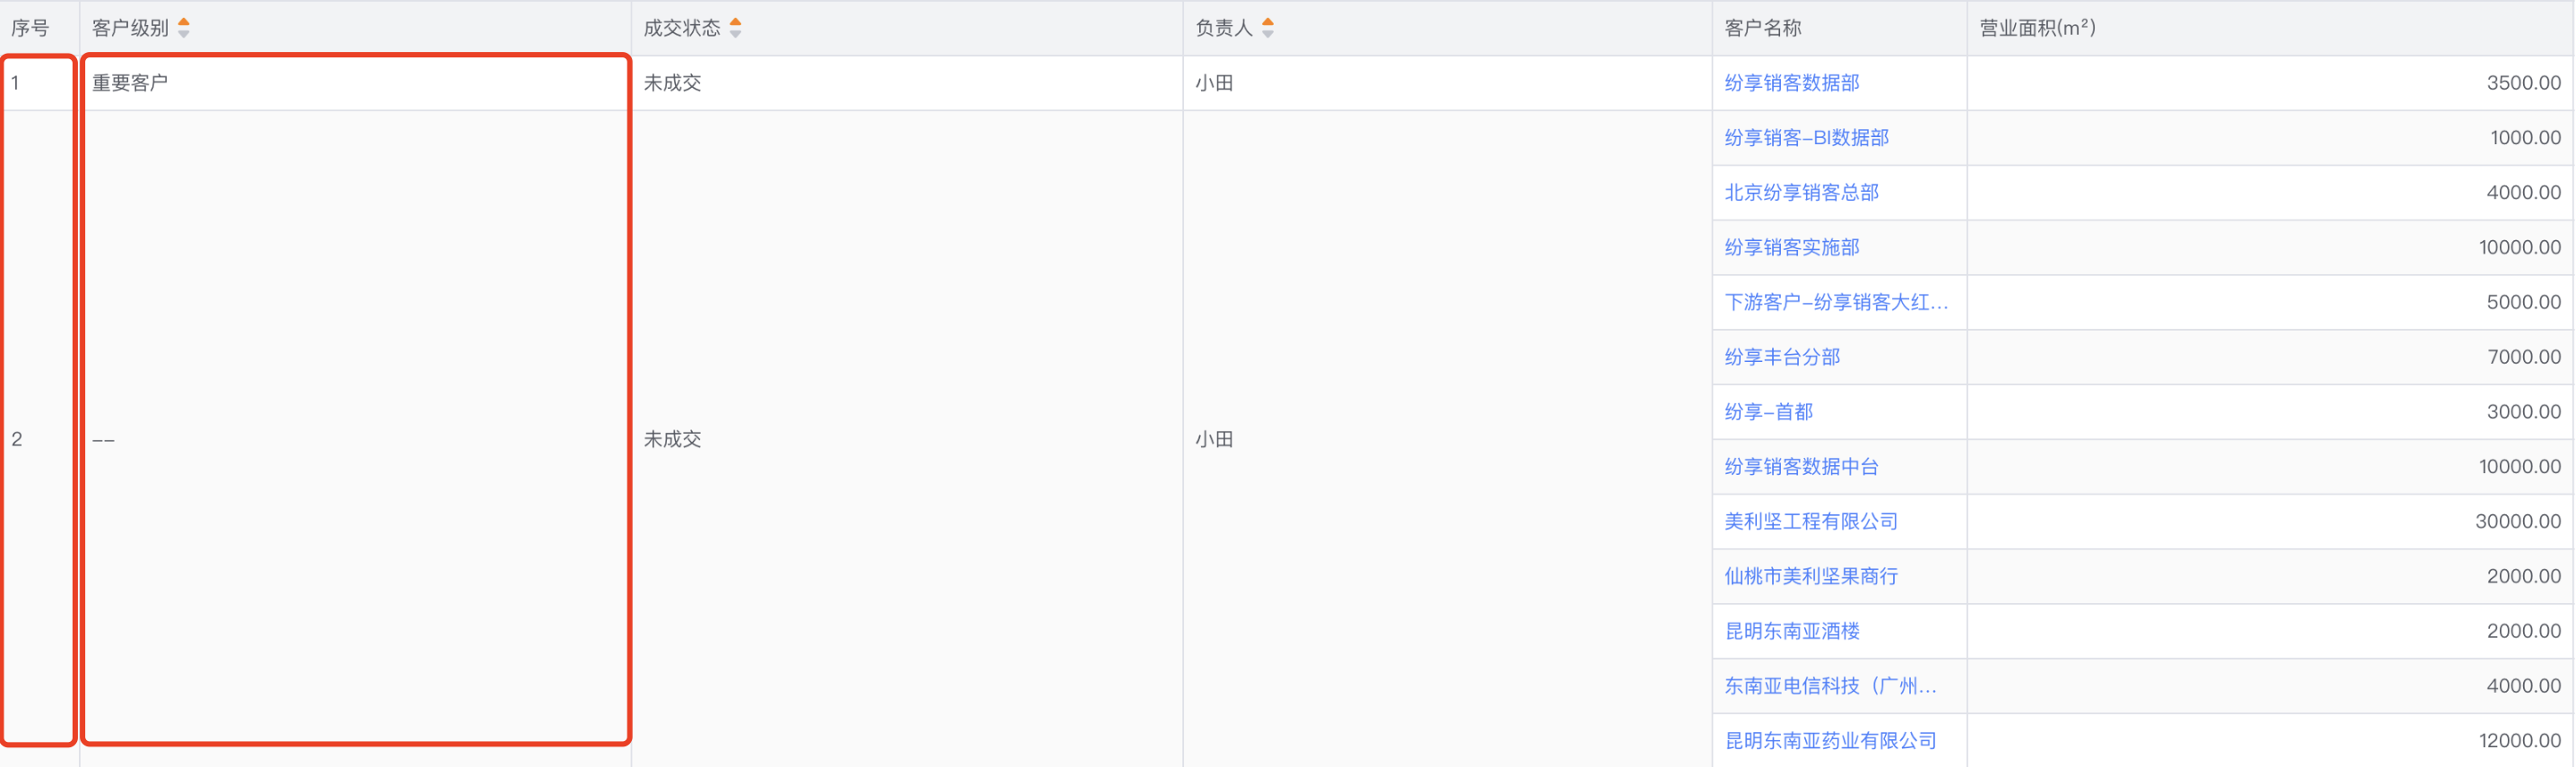
Add SN by group
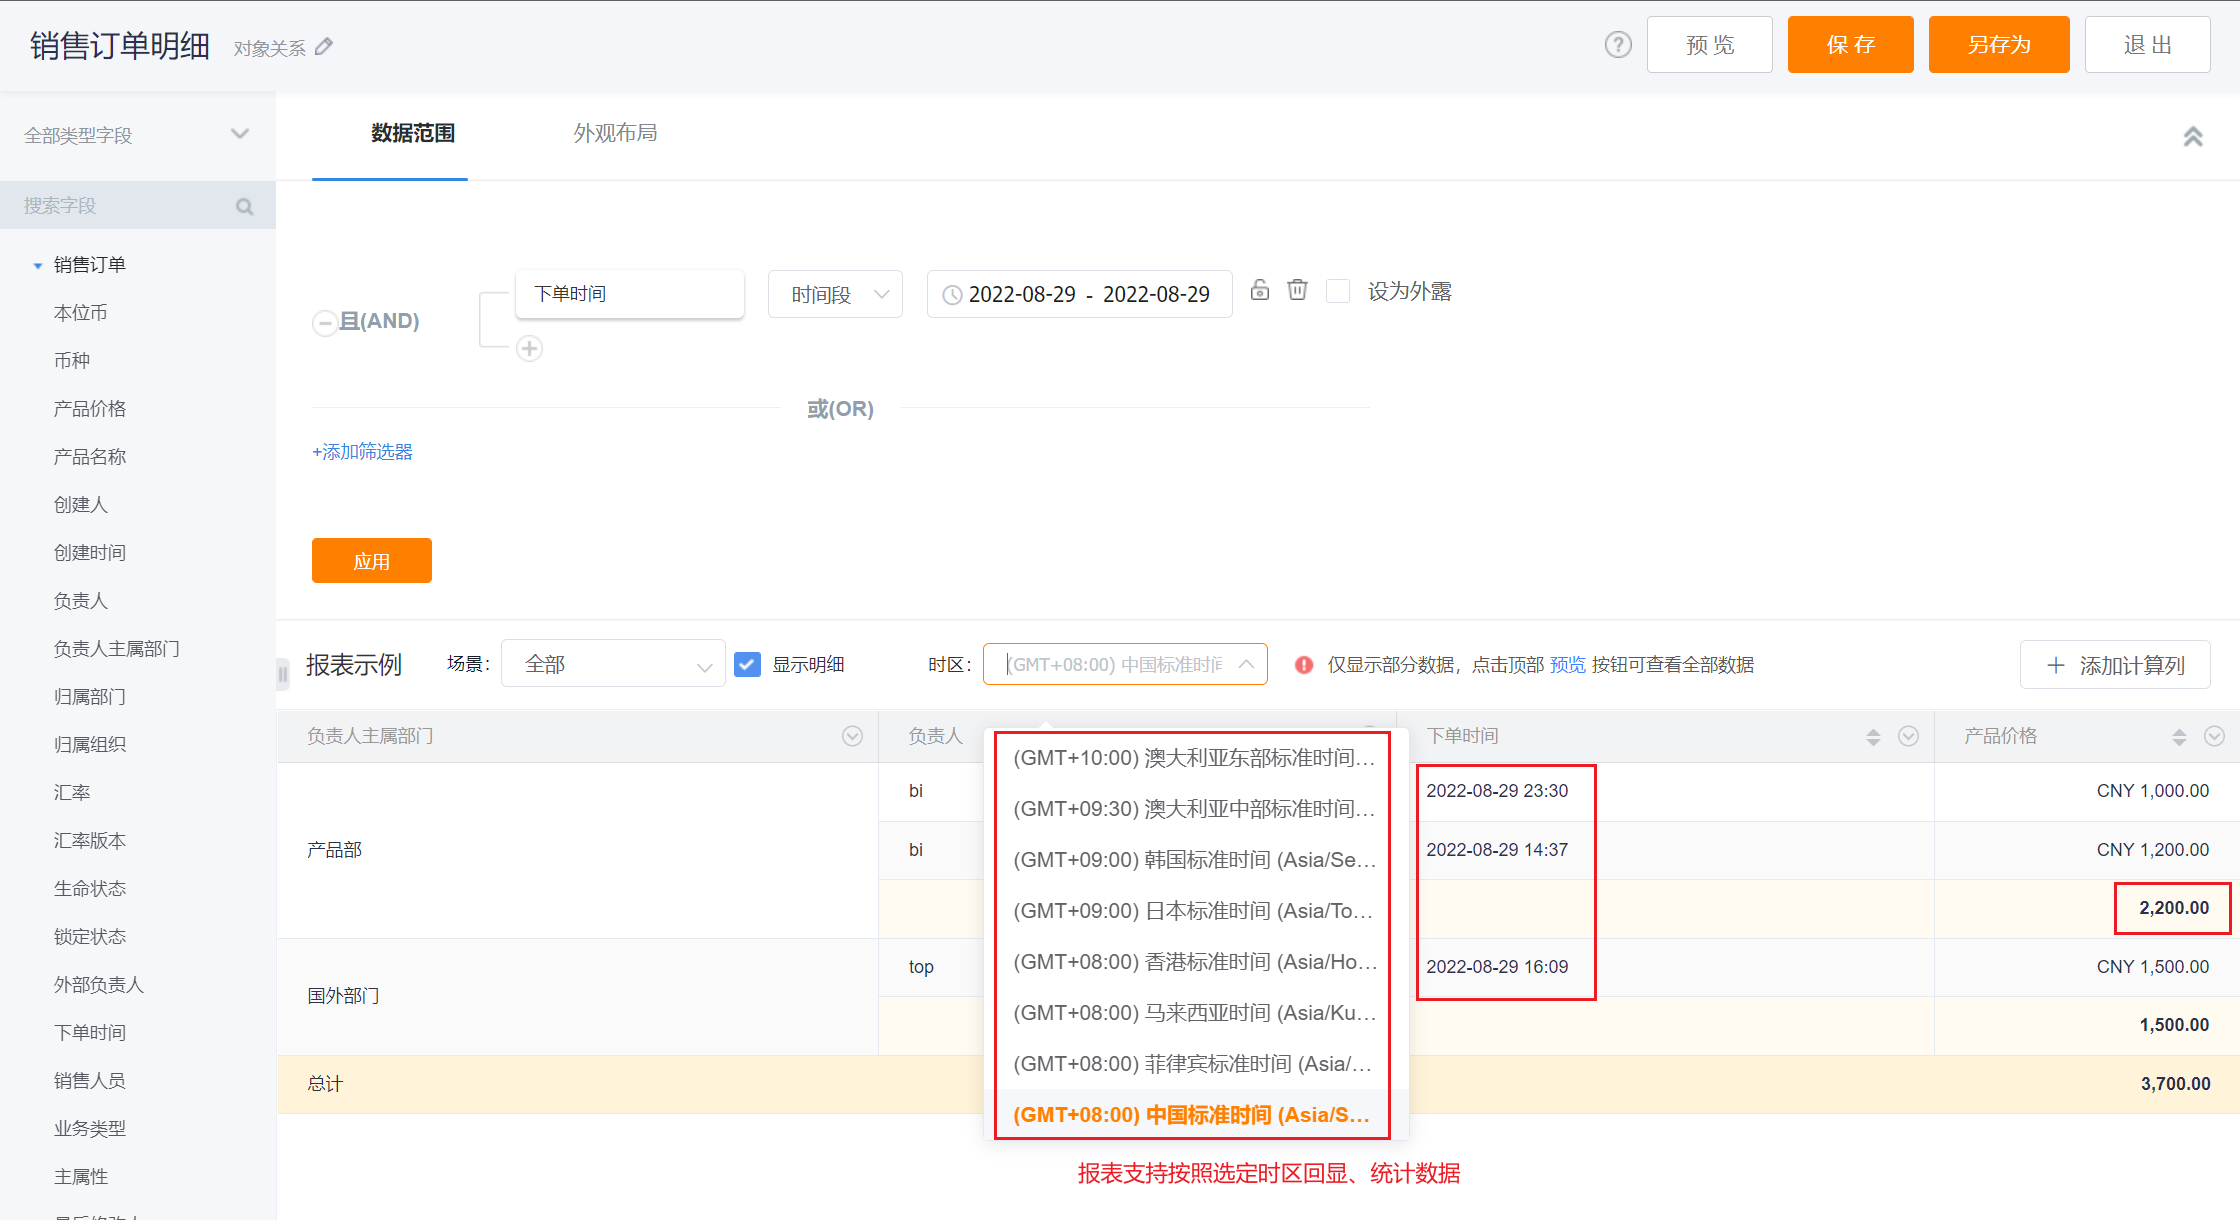
2.7 Time Zone Filters
- If your organization has Multi-Time Zone enabled, the report editor supports time zone filtering. After selecting a time zone, the report will display and aggregate data according to that time zone. If you choose "Business Occurrence Time Zone," the report uses the time zone where the business event actually occurred.
 </img>
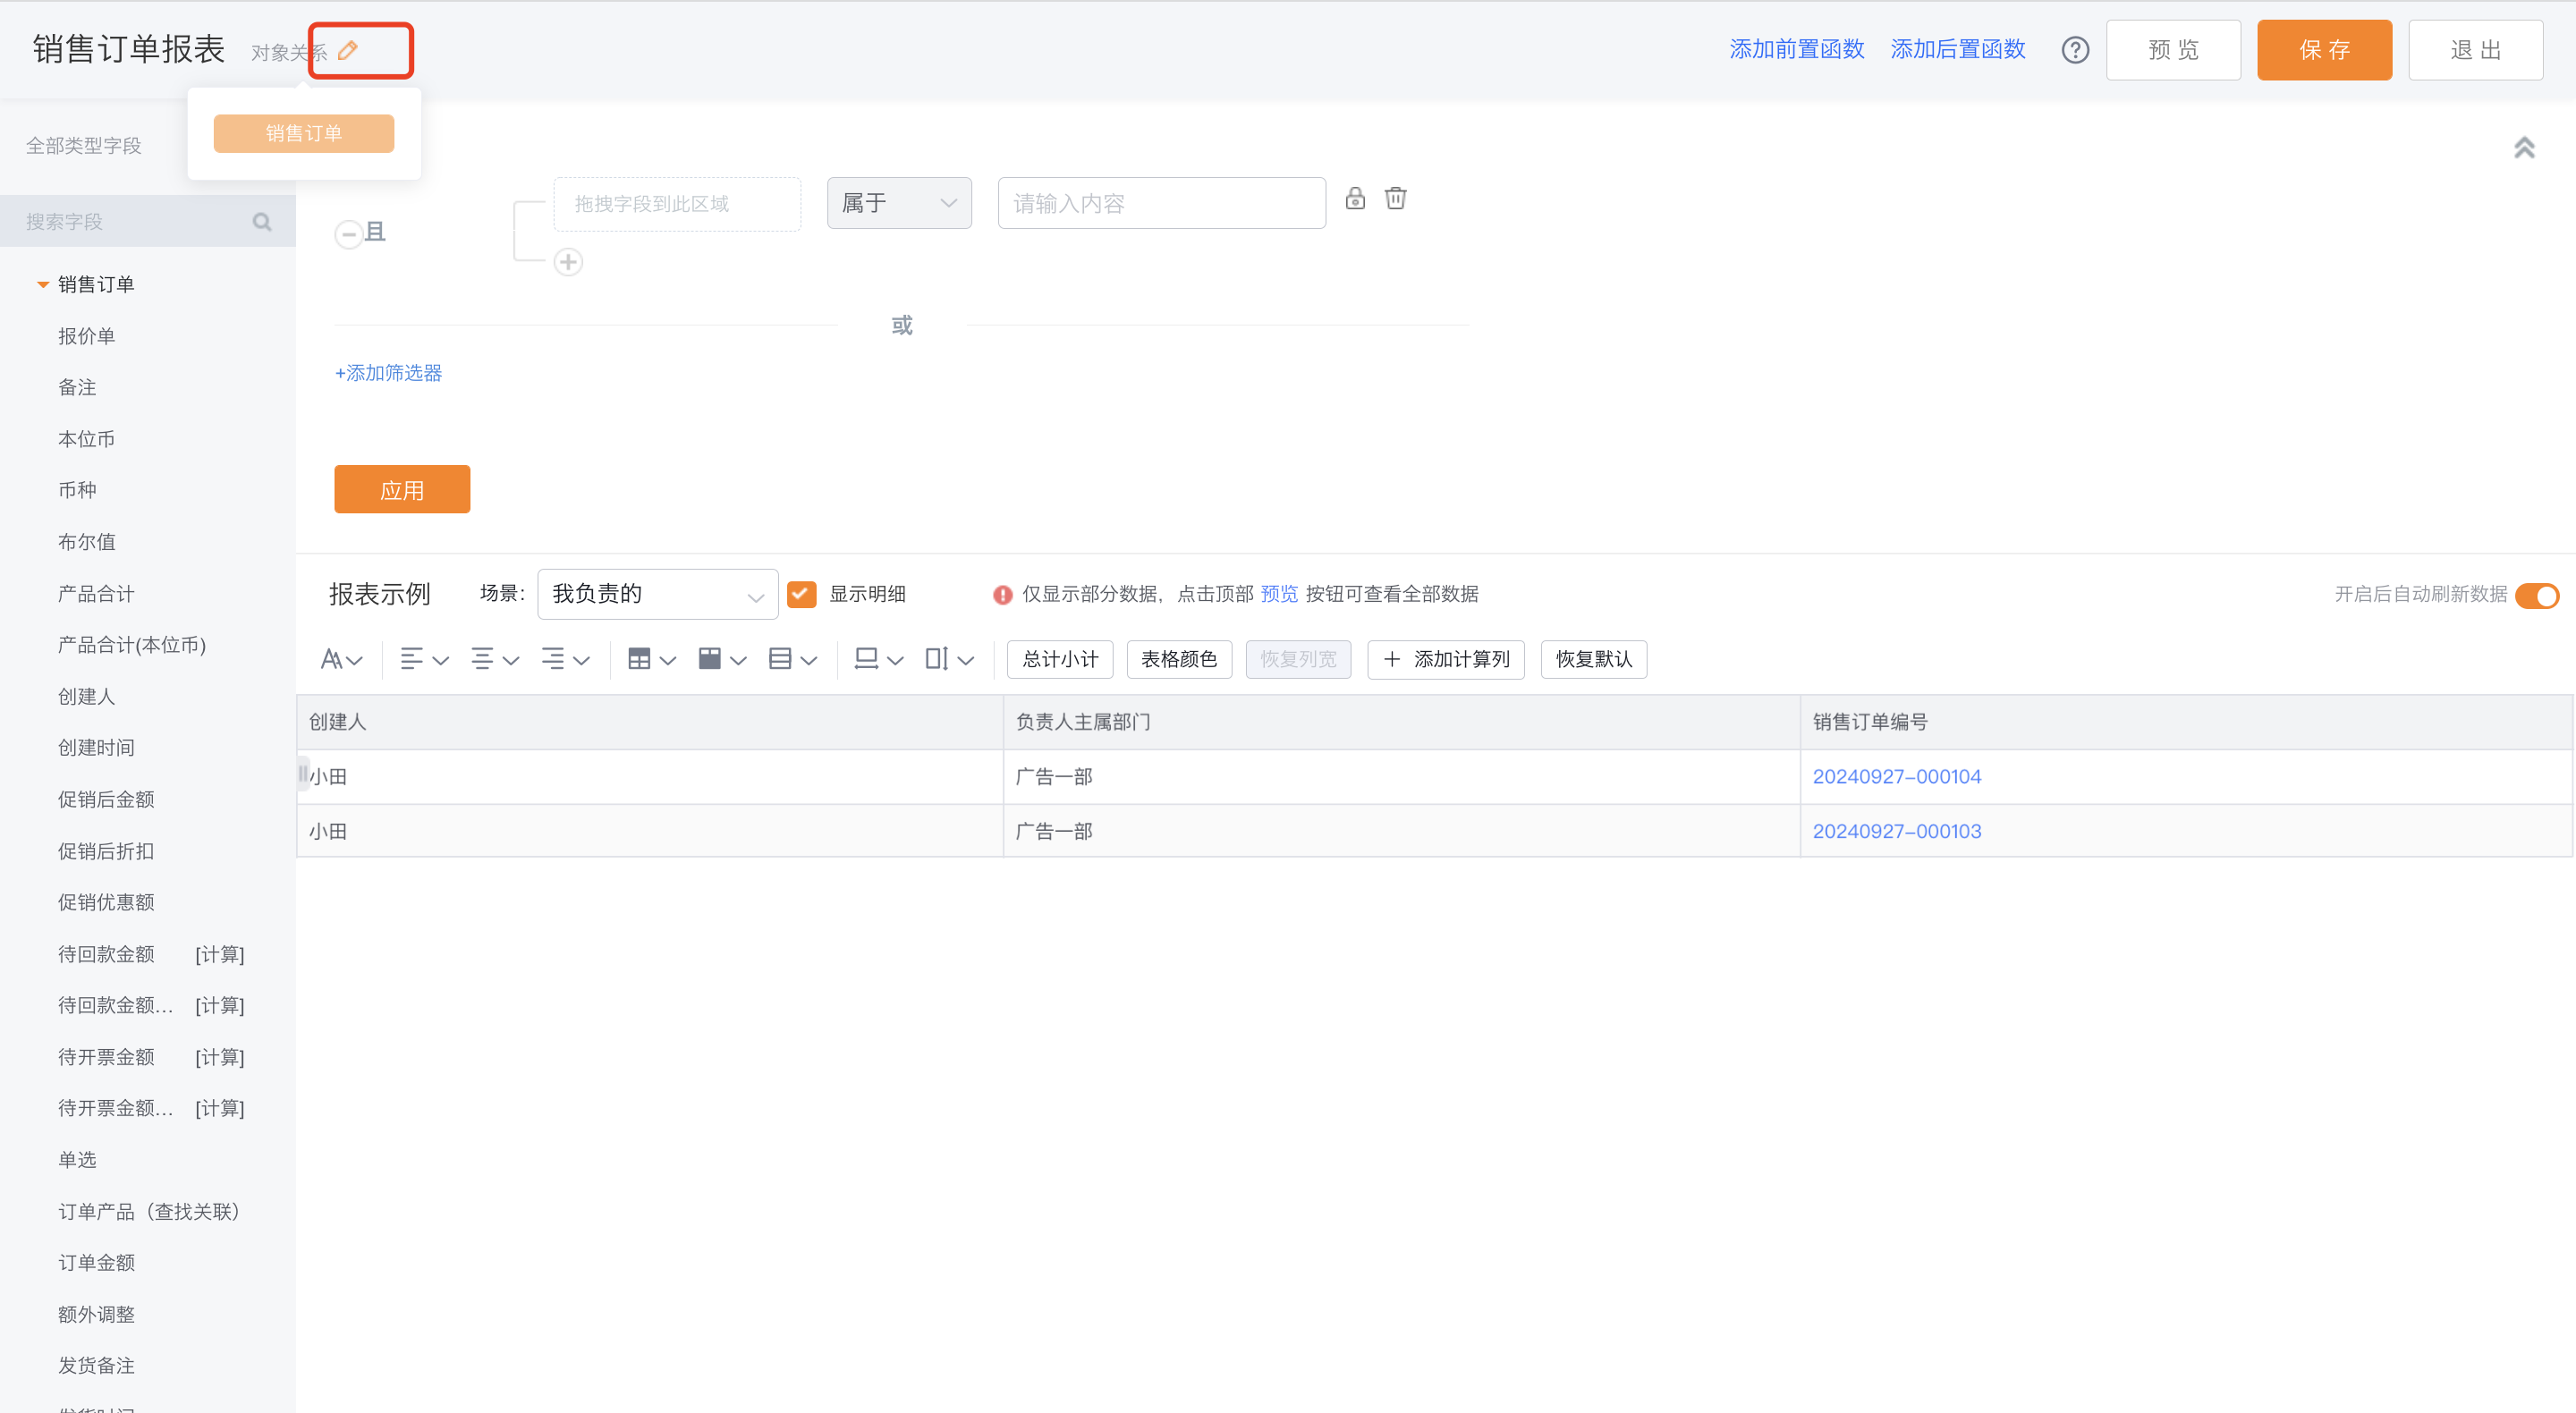
2.8 Modify Object Relationships
- In edit mode you can change object relationships by replacing objects used in the report.
- Applicable roles: Report Admin, CRM Admin
 </img>
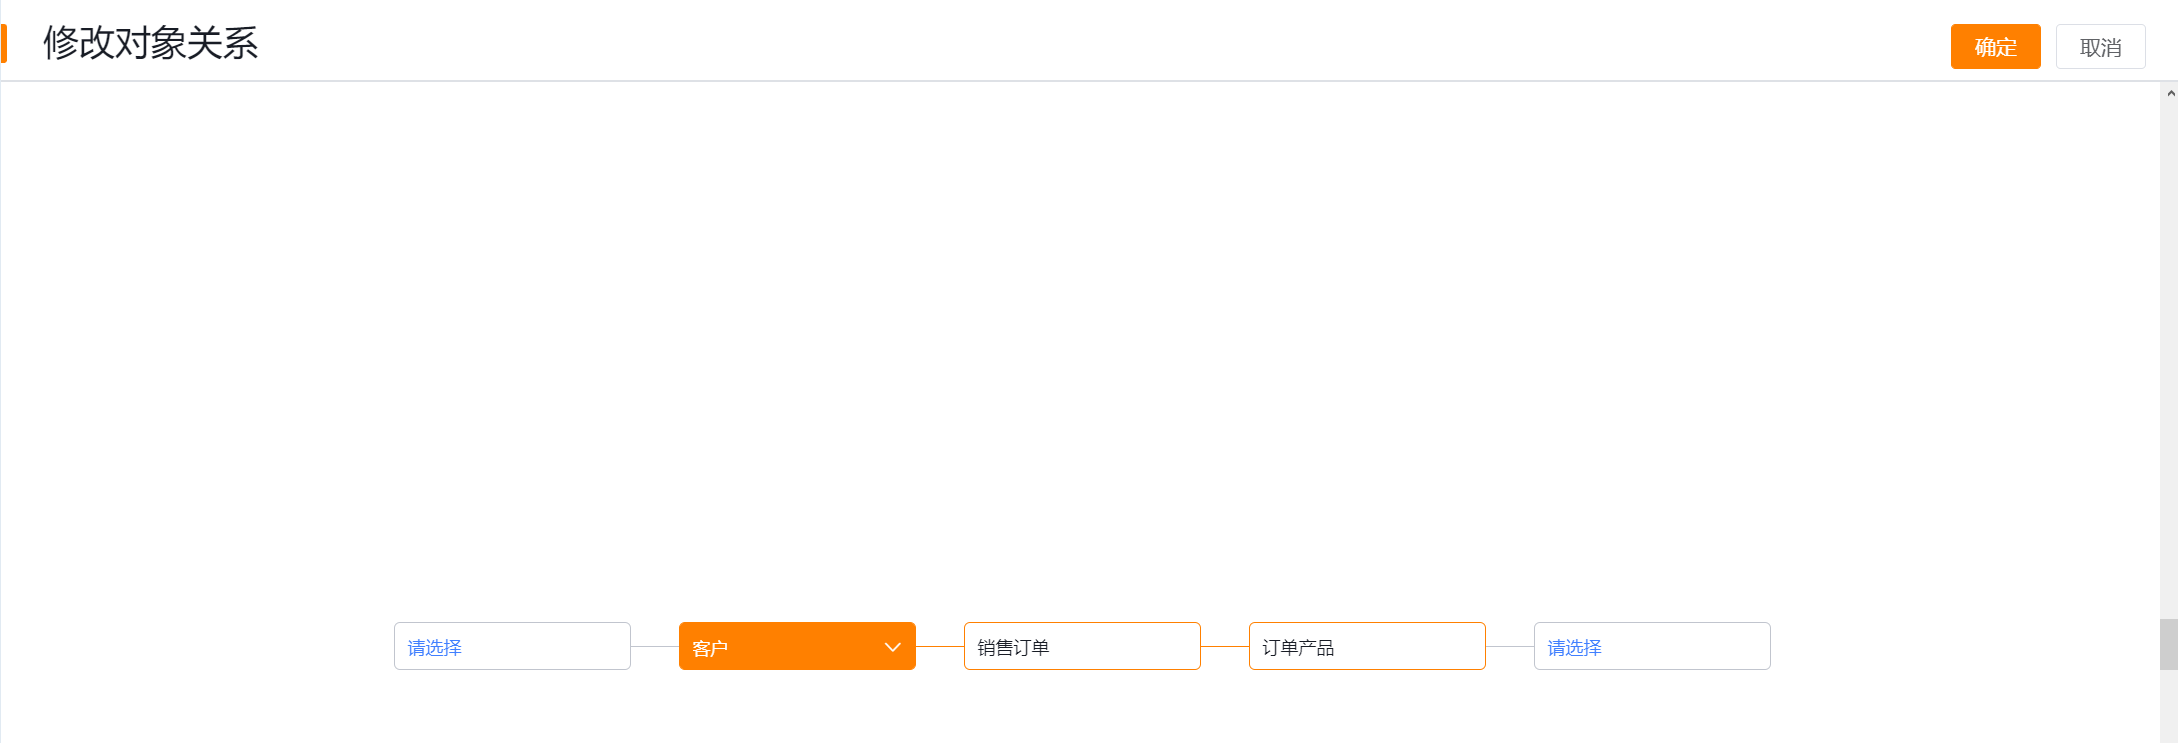 </img>
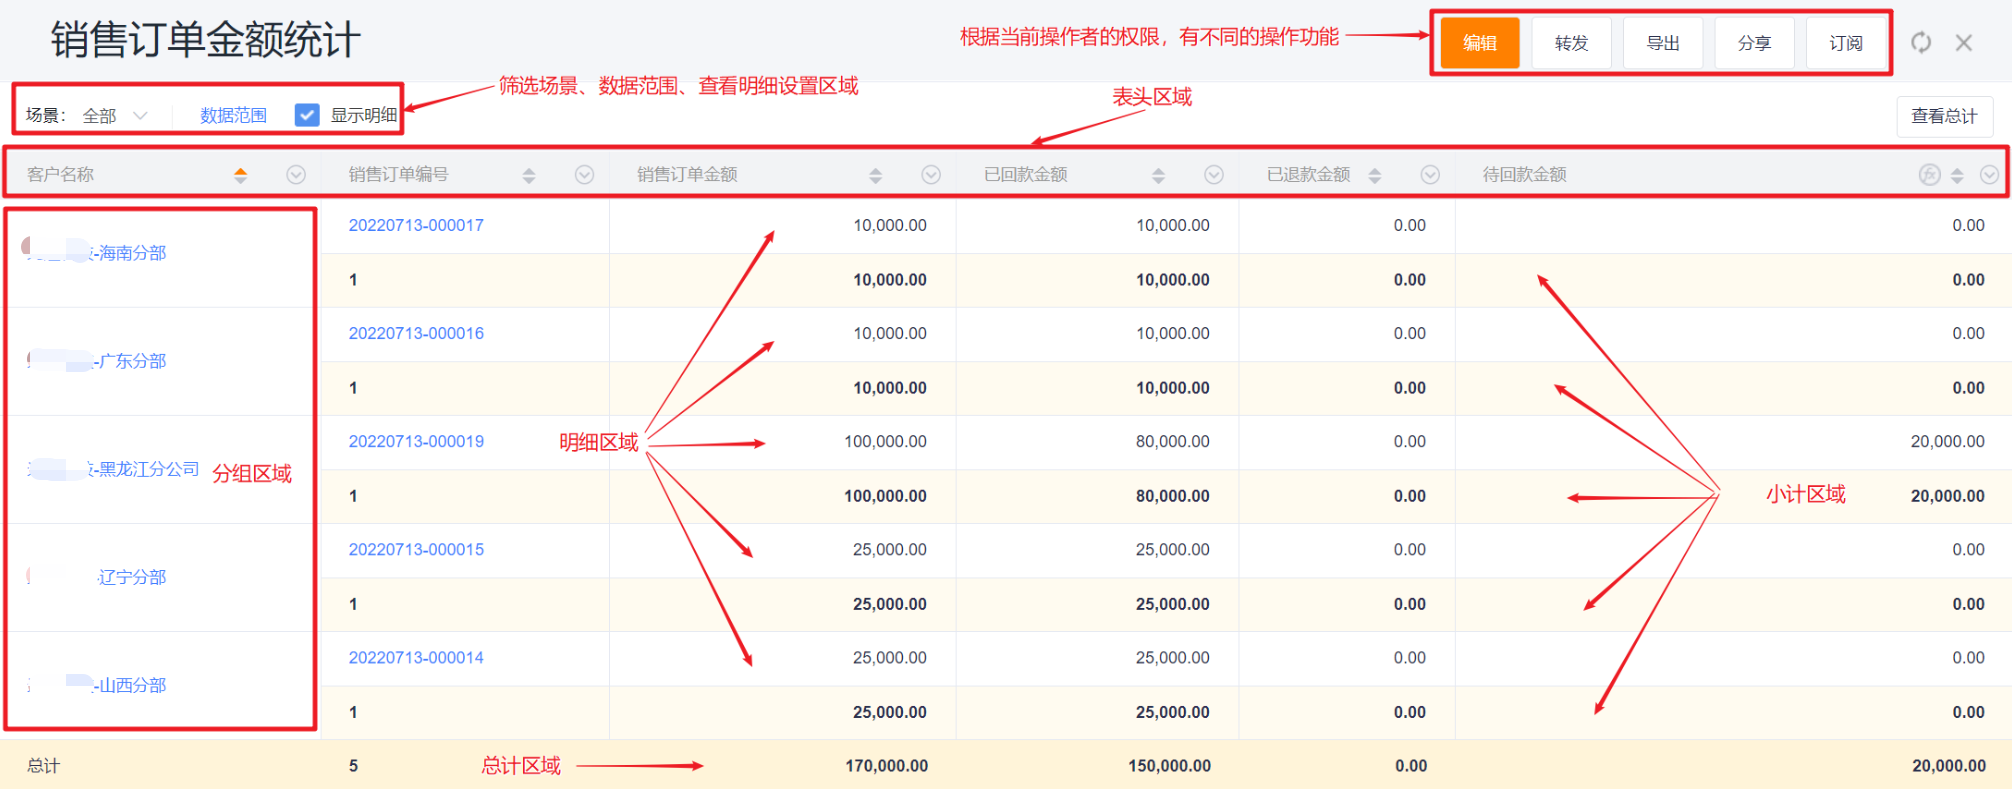
3. Viewing Standard Reports
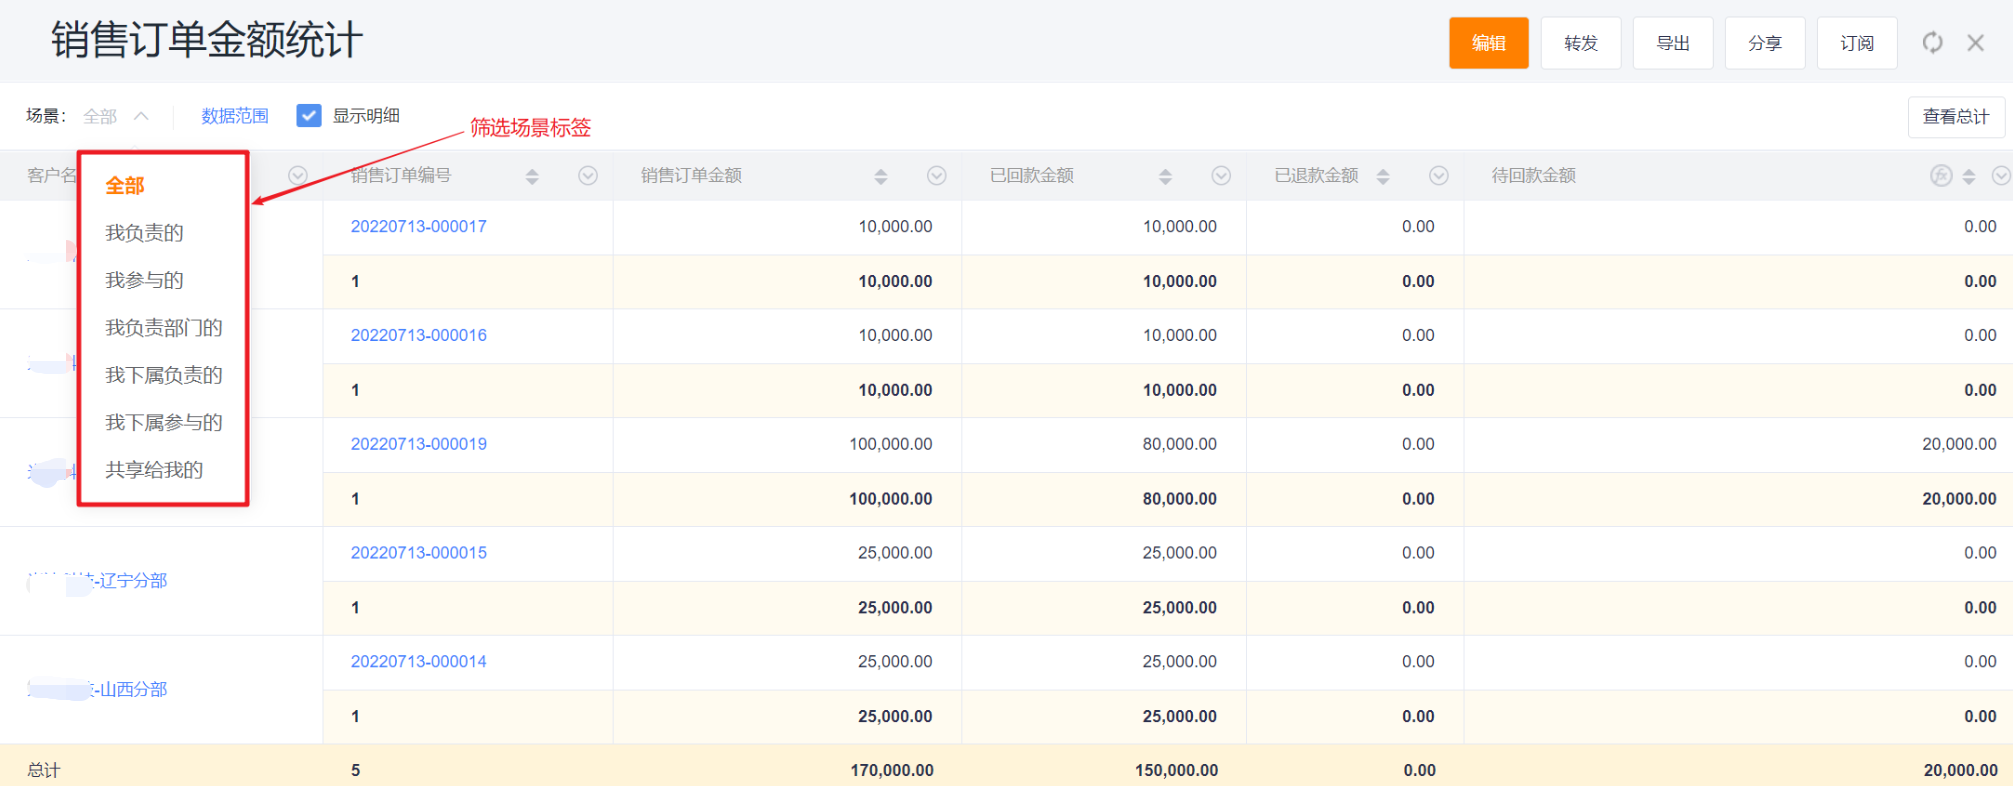
- Report view layout:
- Filter scene tabs: Switch among different scenes.
- Header area: Sort and filter data per column.
- Data scope: Modify unlocked preset filter values and toggle visibility.
- Data display area:
- Group area: Displays grouped rows in merged format.
- Detail area: Displays group details as rows.
- Subtotal area: Aggregates per group level.
- Total area: Provides overall aggregations across all data.
 </img>
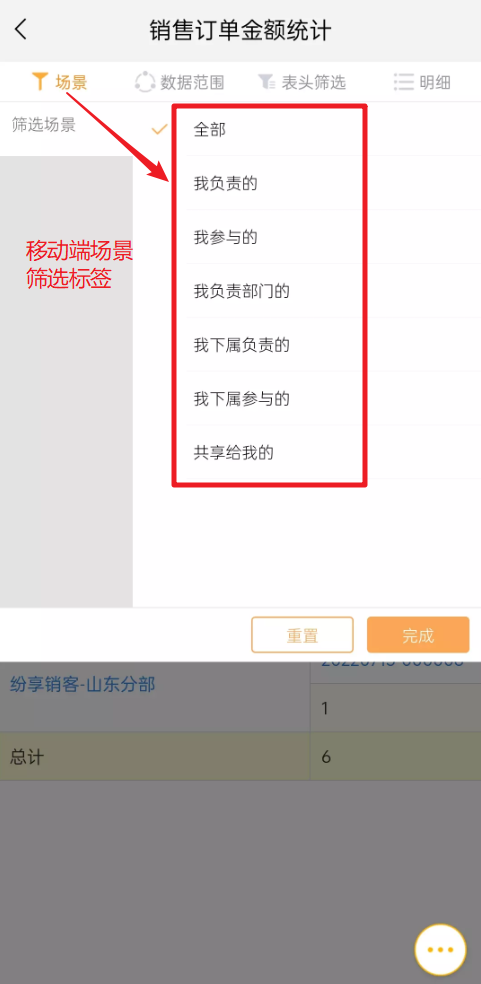
3.1 Filter Scenes
- Switching scene tabs lets you quickly view data under different scenarios.
Web display:
 </img>
Mobile display:
 </img>
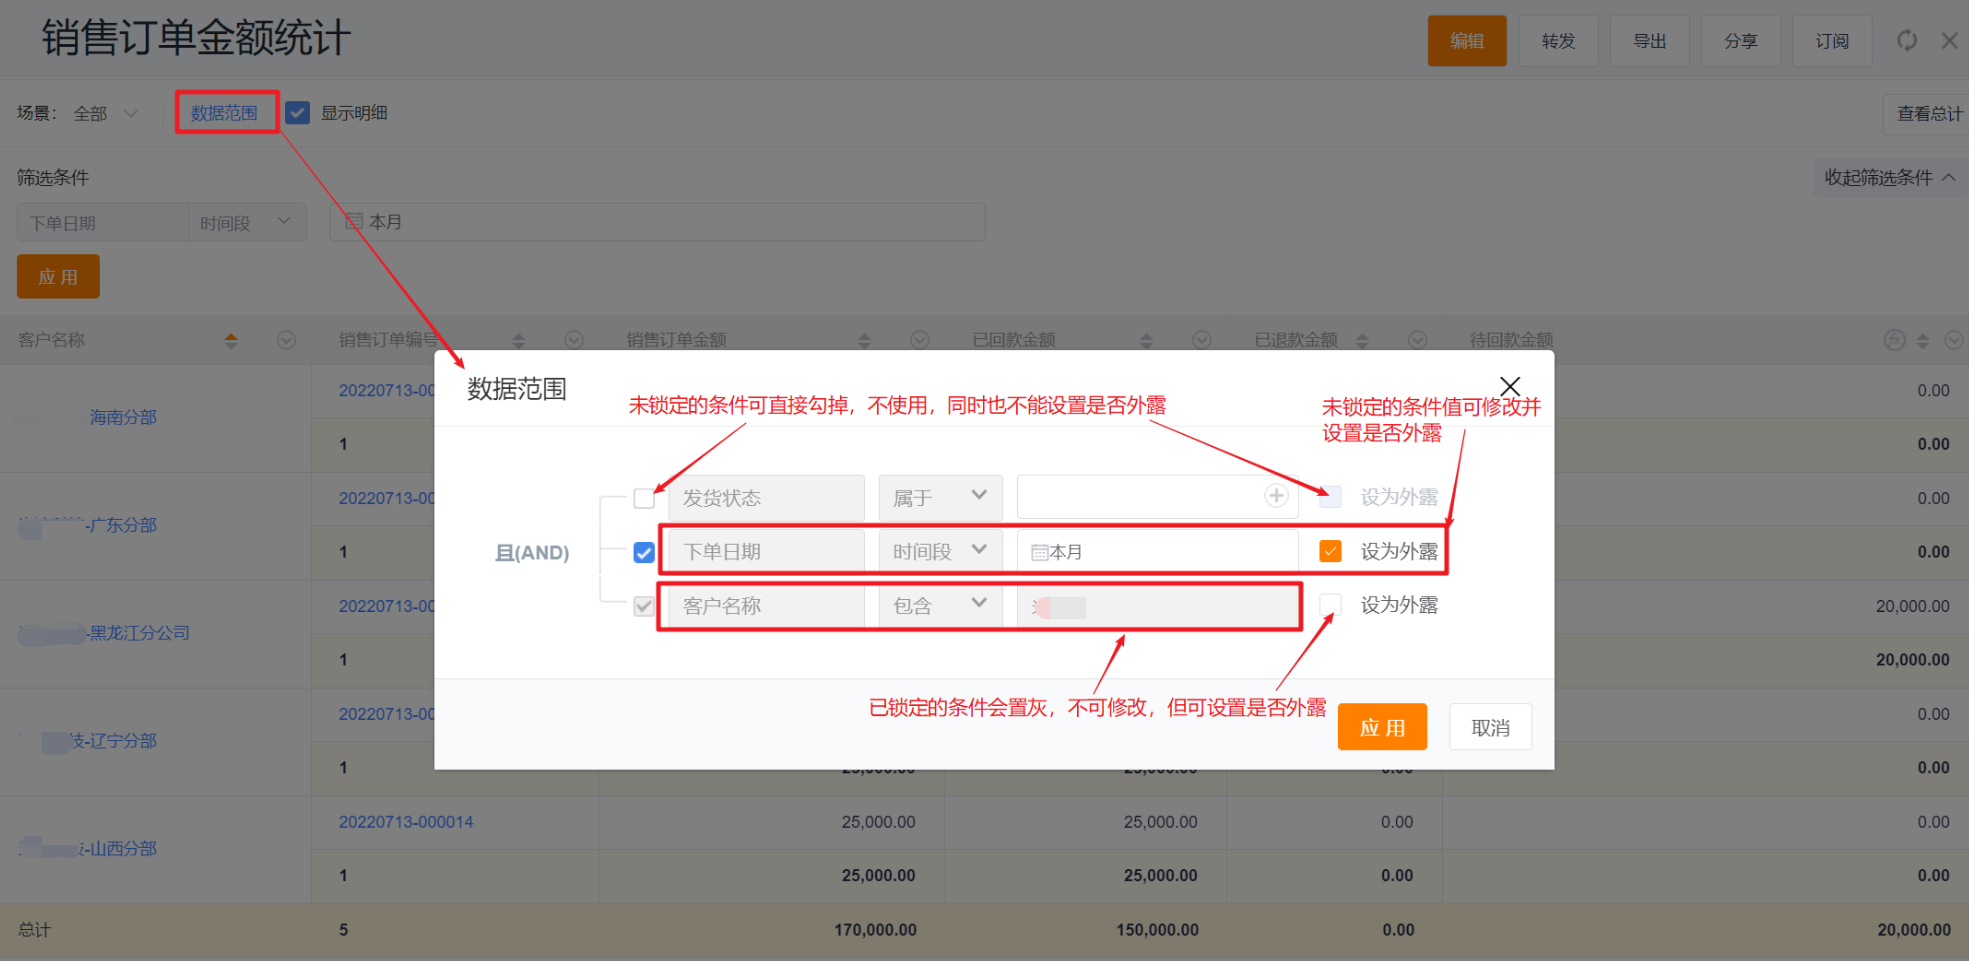
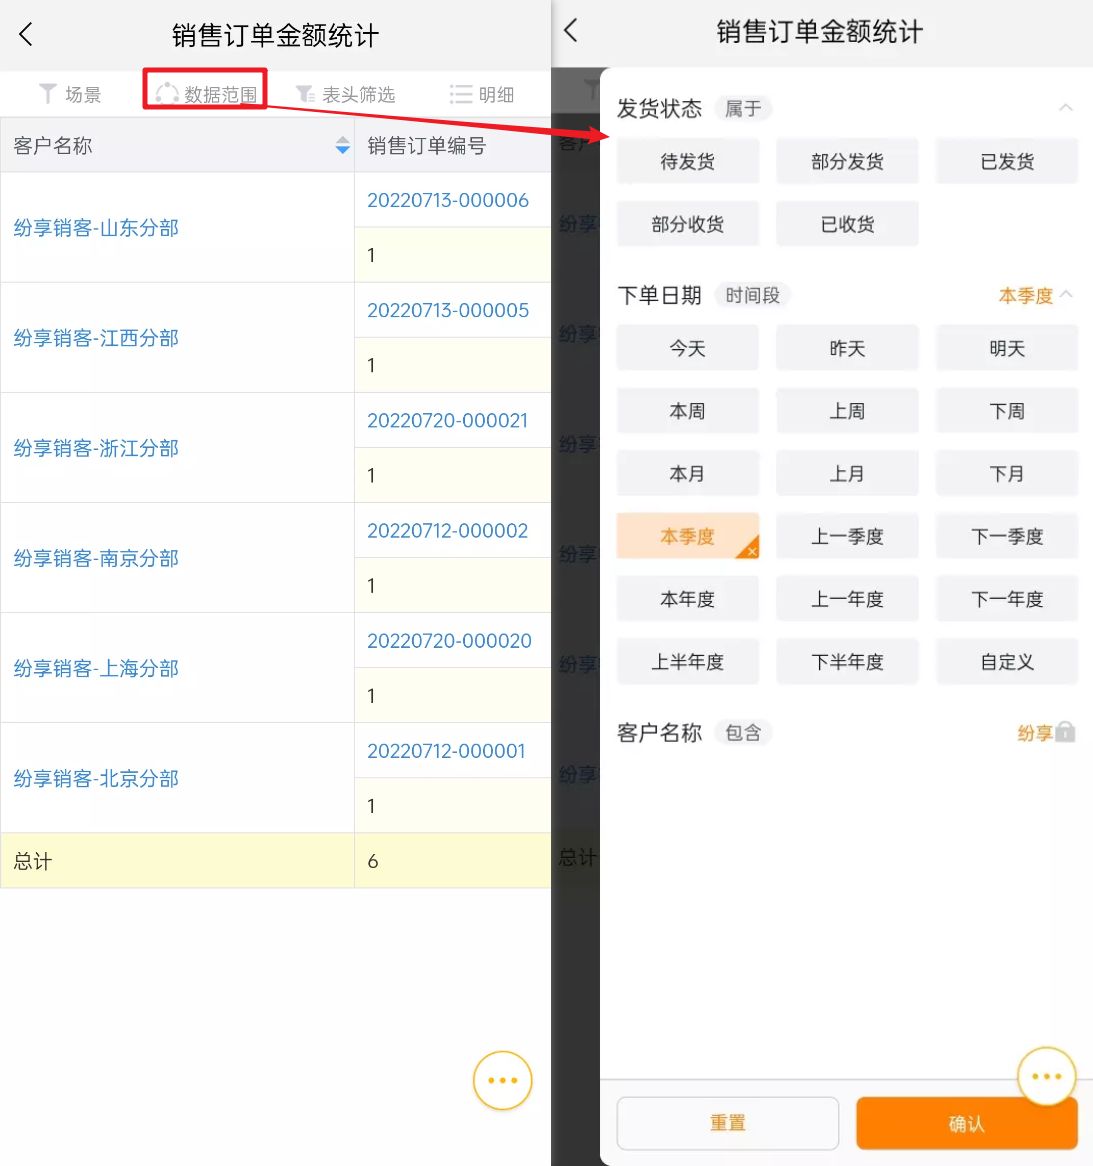
3.2 Data Scope
- While viewing a report you can modify unlocked conditions in the Data Scope overlay and set whether they are visible.
Web display:
 </img>
Mobile display:
 </img>
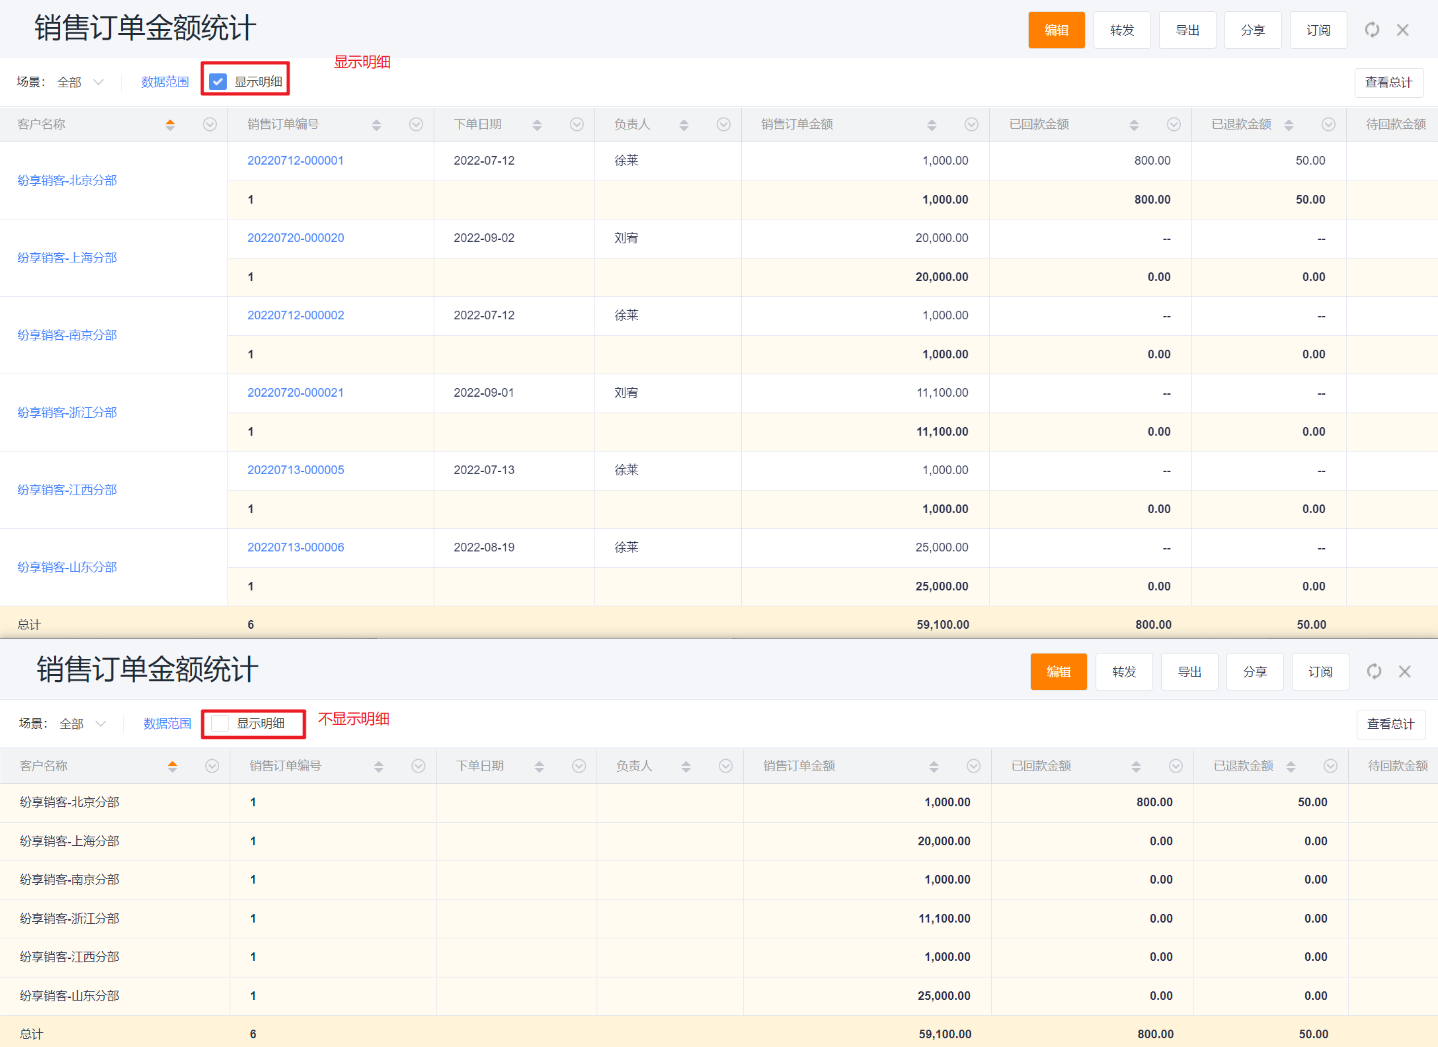
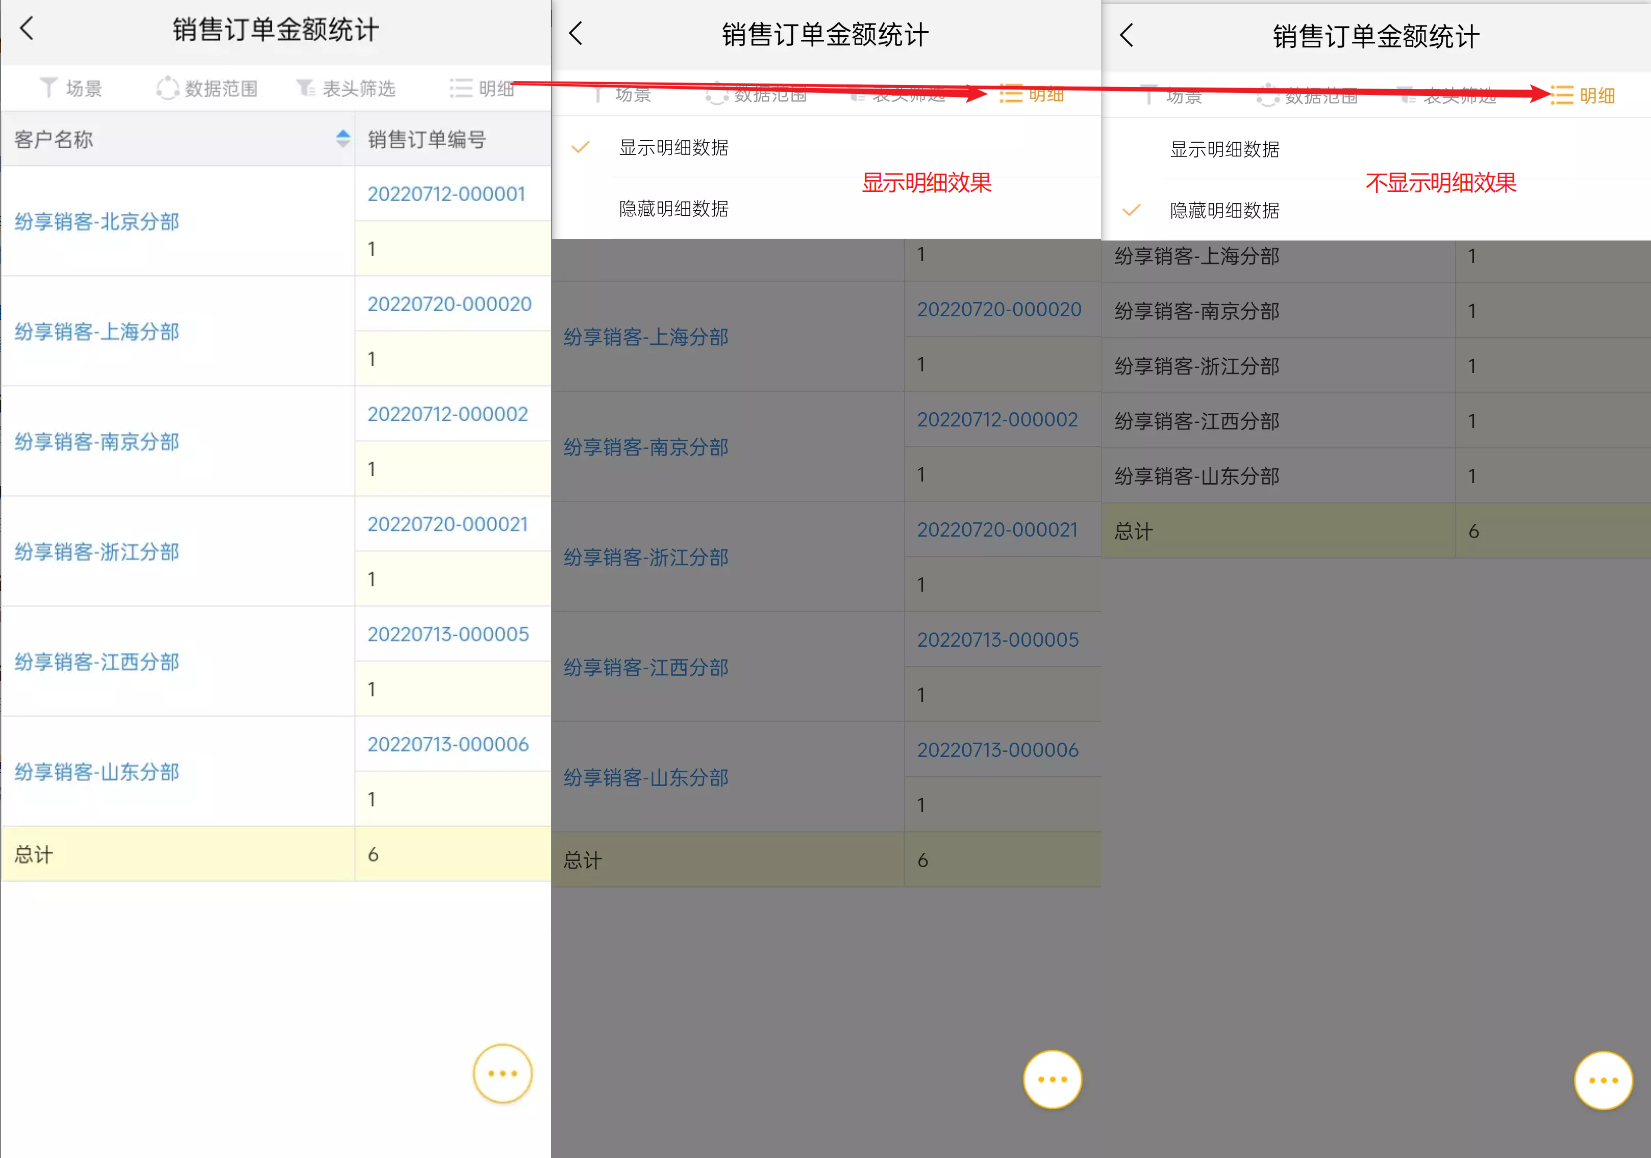
3.3 View Details
- If the report has aggregations enabled, you may toggle whether to show detail rows.
Web display:
 </img>
Mobile display:
 </img>
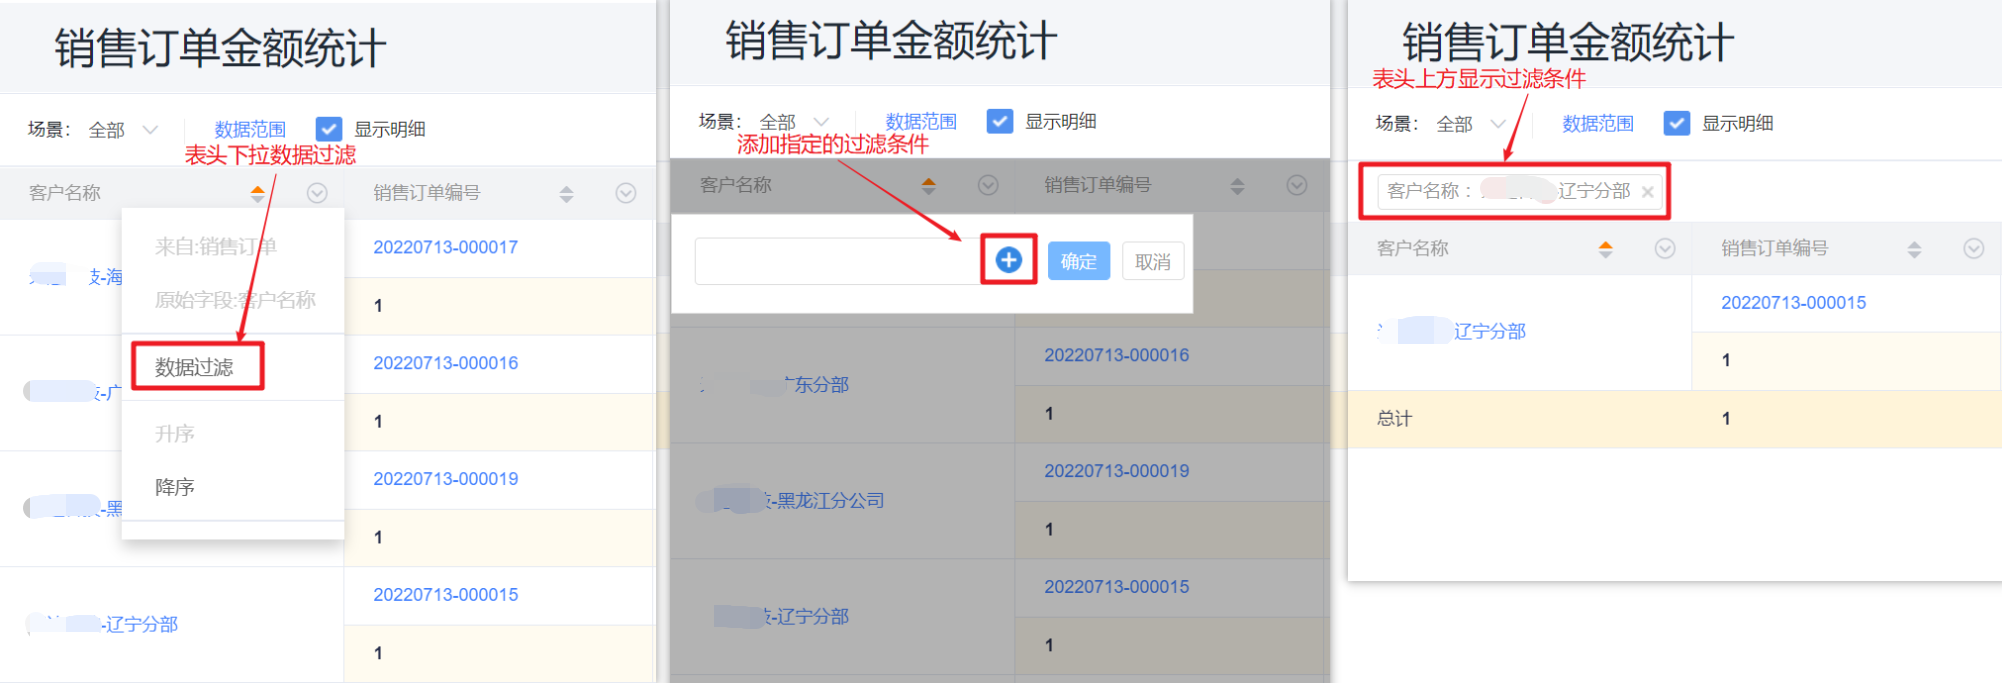
3.4 Header-based Filtering
- You can quickly filter data directly from column headers when viewing a report.
- Set conditions will appear above the header; click Edit to modify or the X to remove.
- Input controls vary by column data type.
Web display:
 </img>
Mobile display: (lists all header fields for filtering)
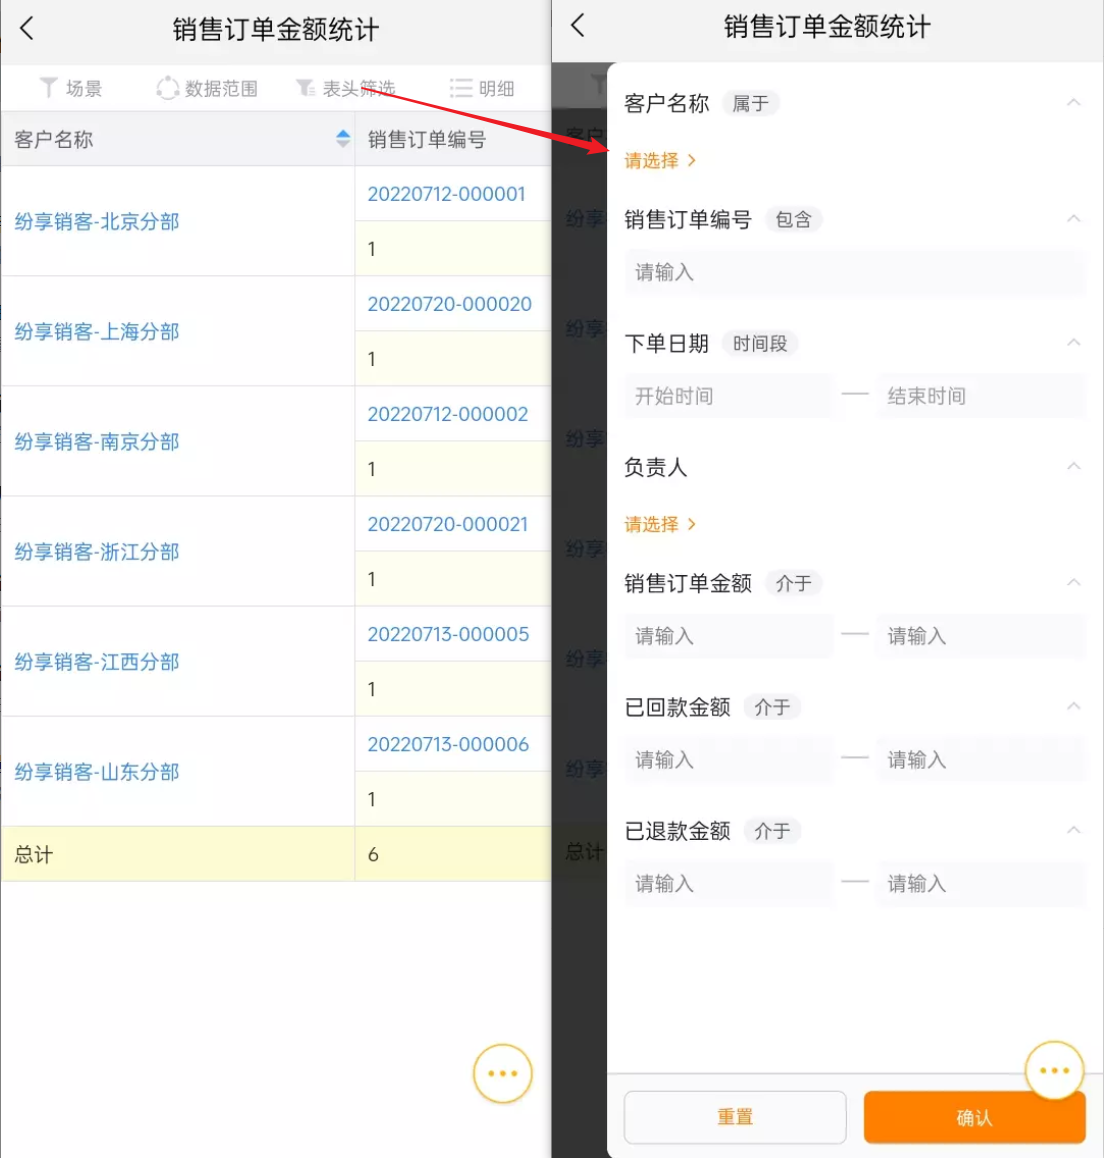 </img>
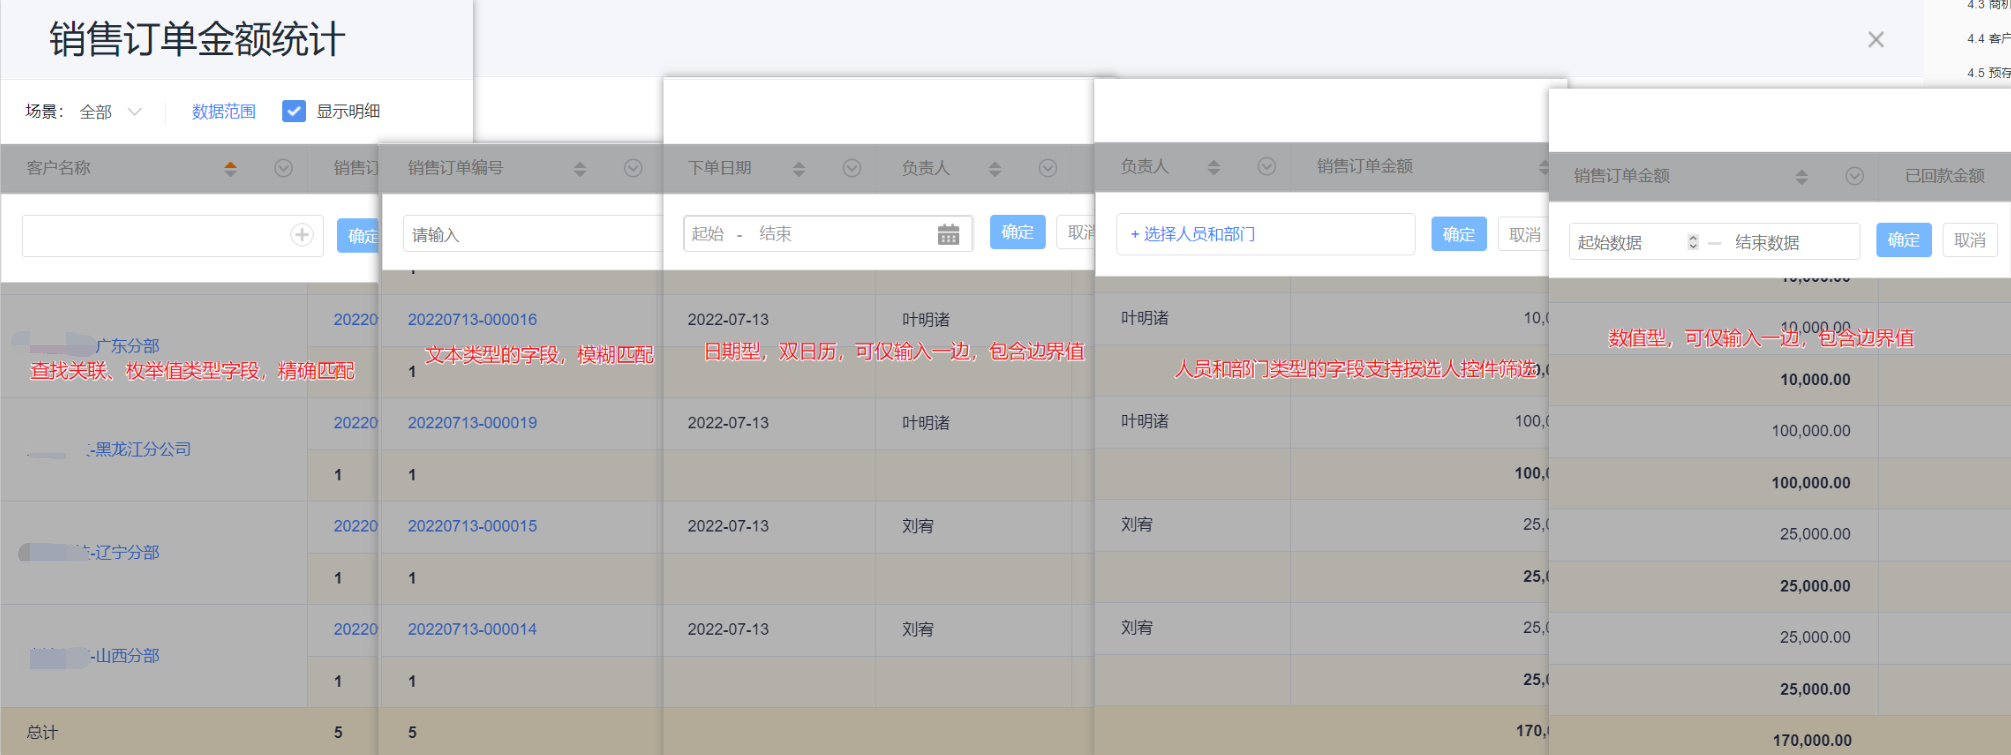 </img>
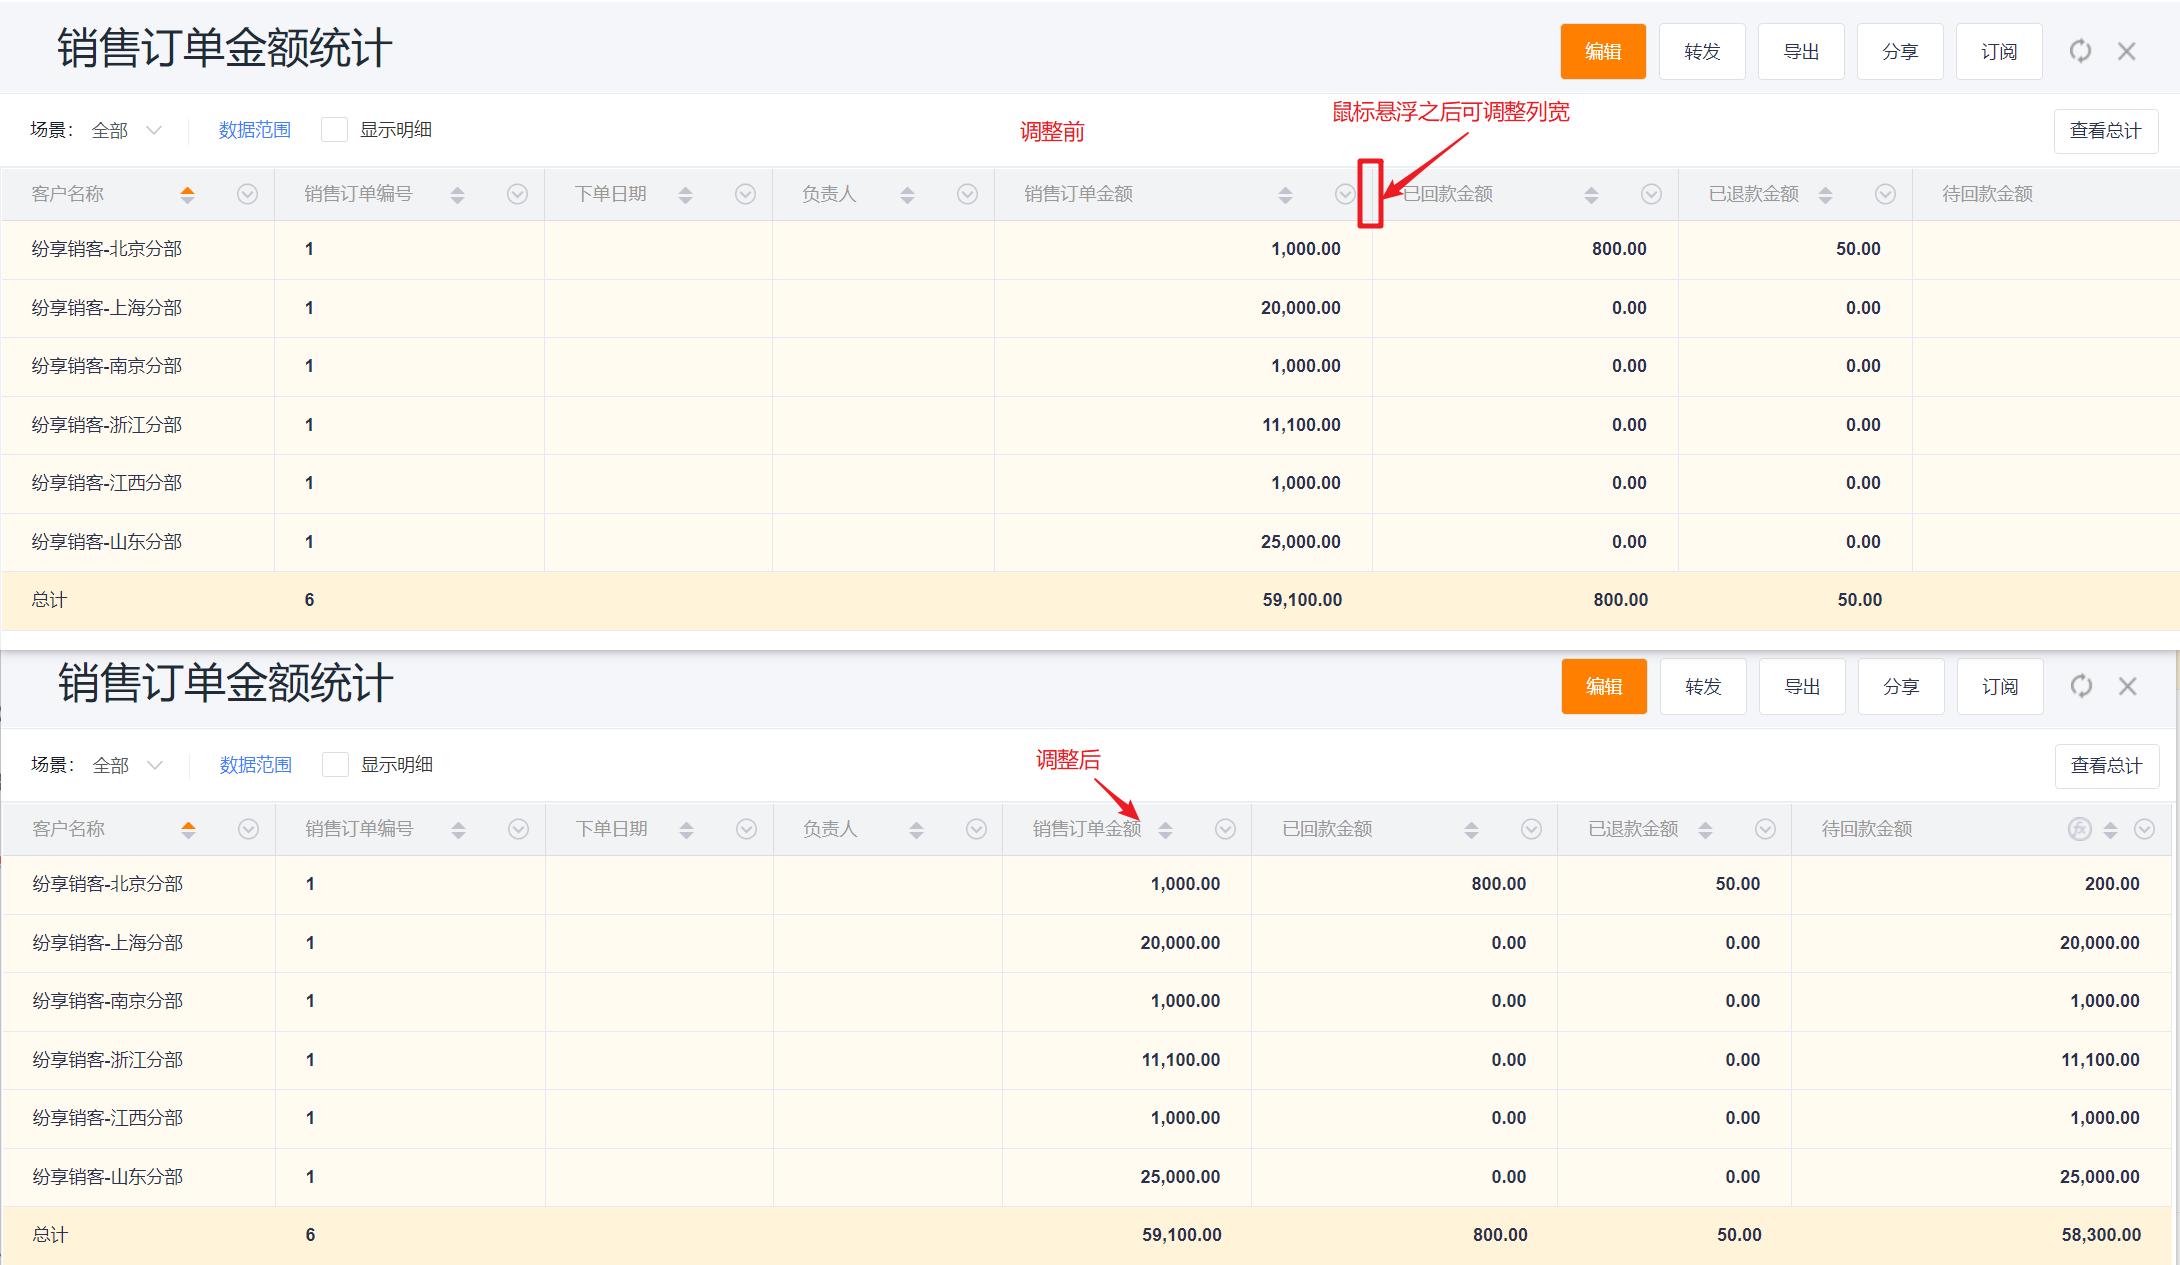
3.5 Adjust Column Width in View Mode
- Hover between two columns and drag to resize column width. This change applies only for the current viewing session.
Web display:
 </img>
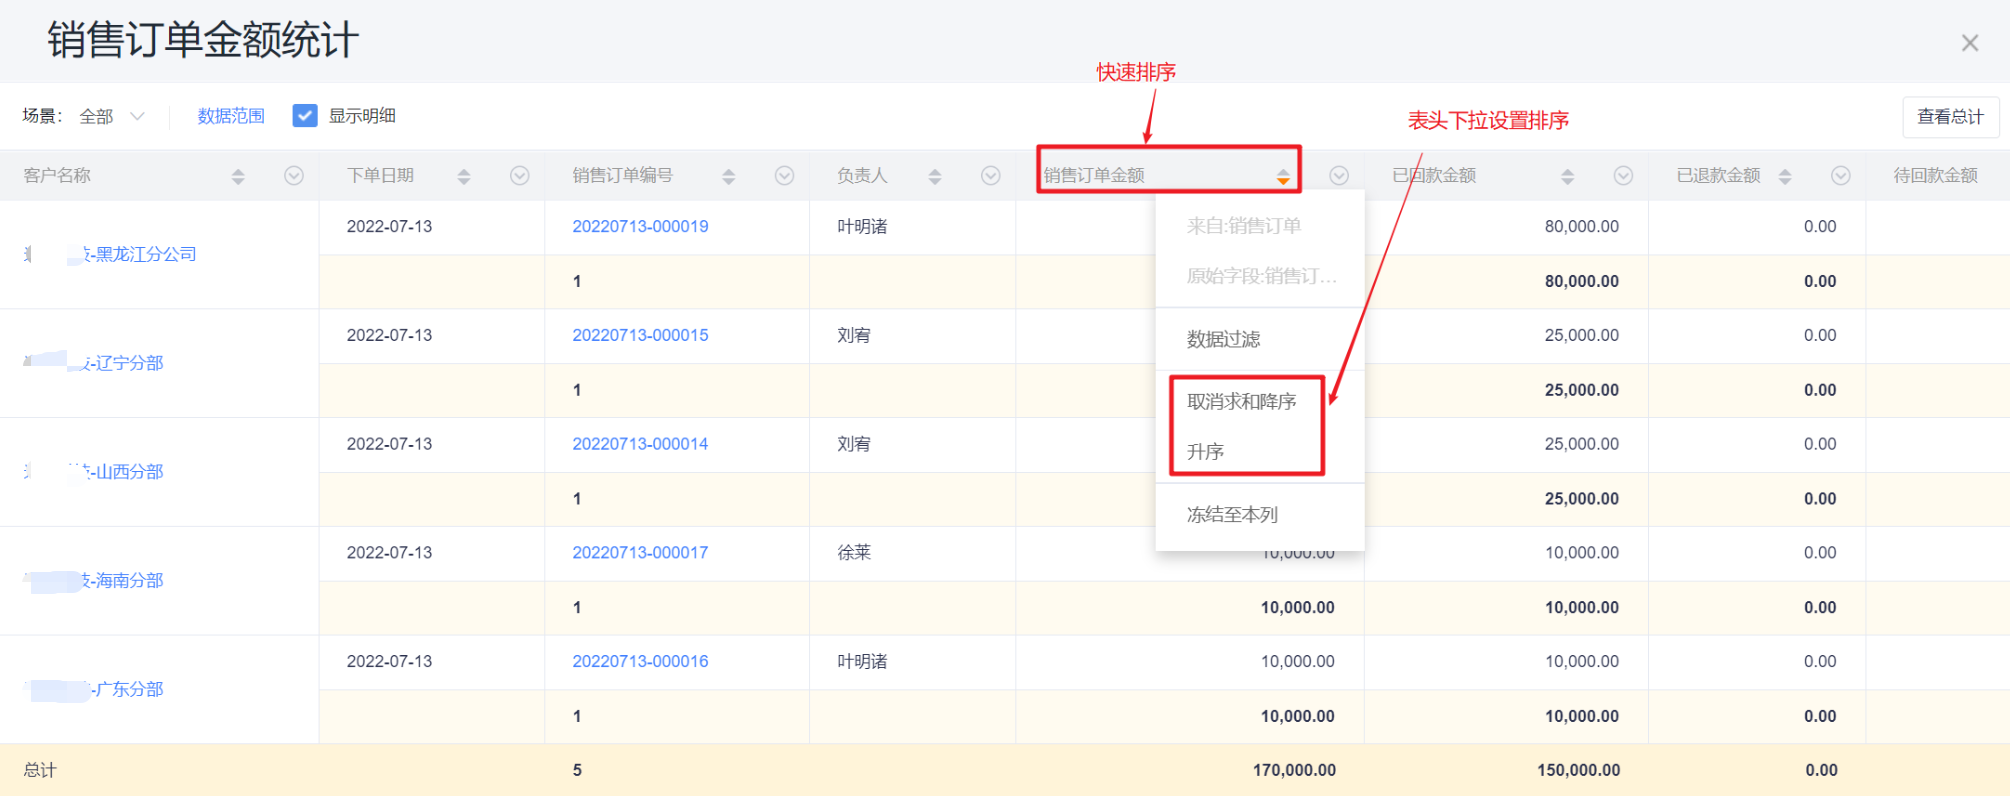
3.6 Sort Grouped Fields
- Use the column header menu to set ascending, descending, or clear sorting.
- Click the column header to toggle ascending/descending quickly.
- Note: Grouped fields cannot clear sorting and default to ascending.
Web display:
 </img>
Mobile display:
- Full display / Restore default: Equivalent to web column width adjustment; cannot customize width.
- Freeze to this column: Freeze up to the selected column.
- Ascending / Descending: Toggle sorting.
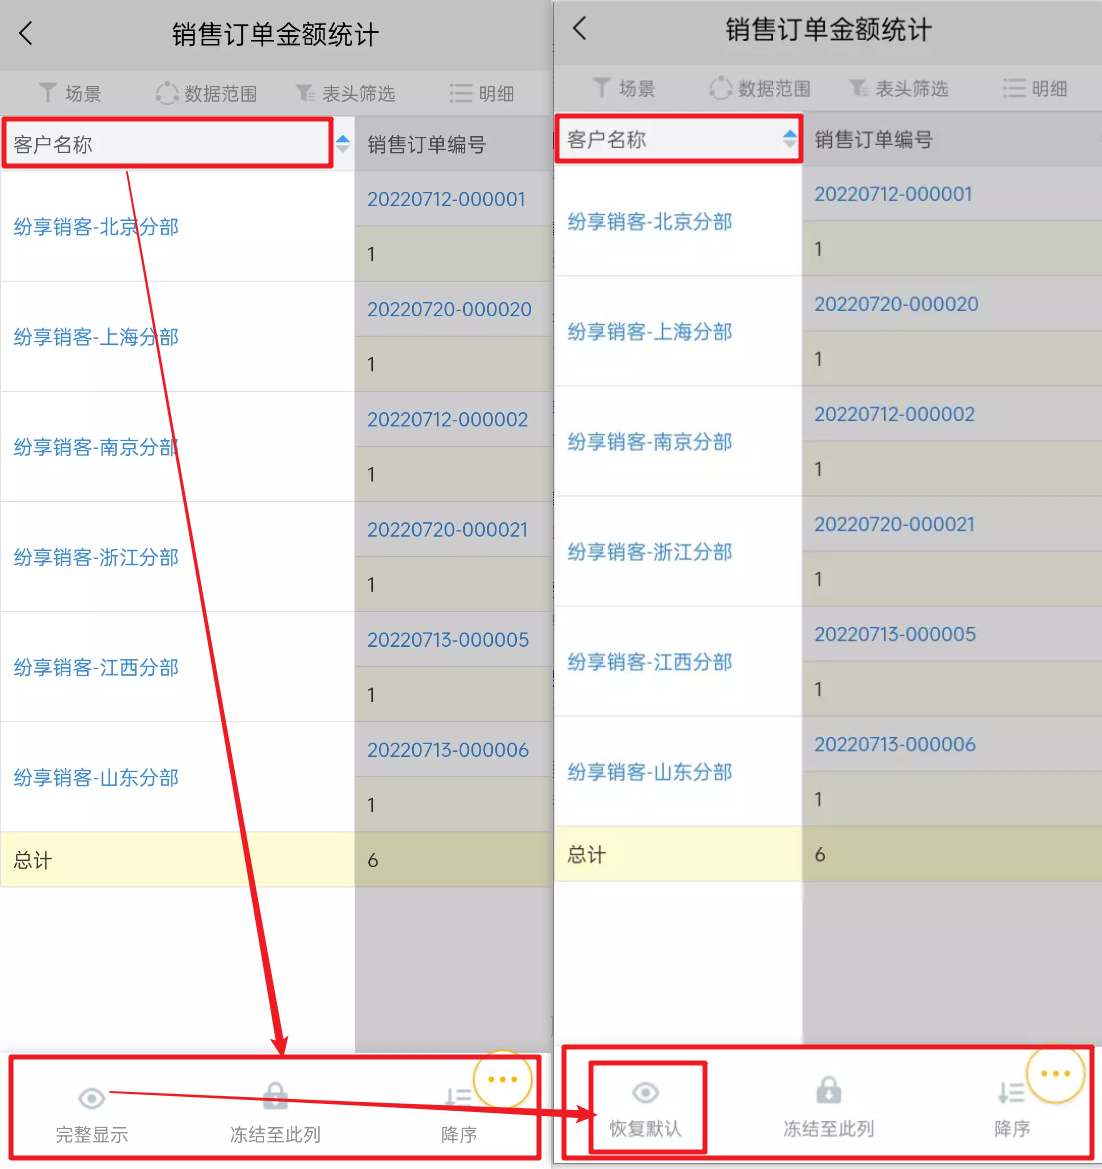 </img>
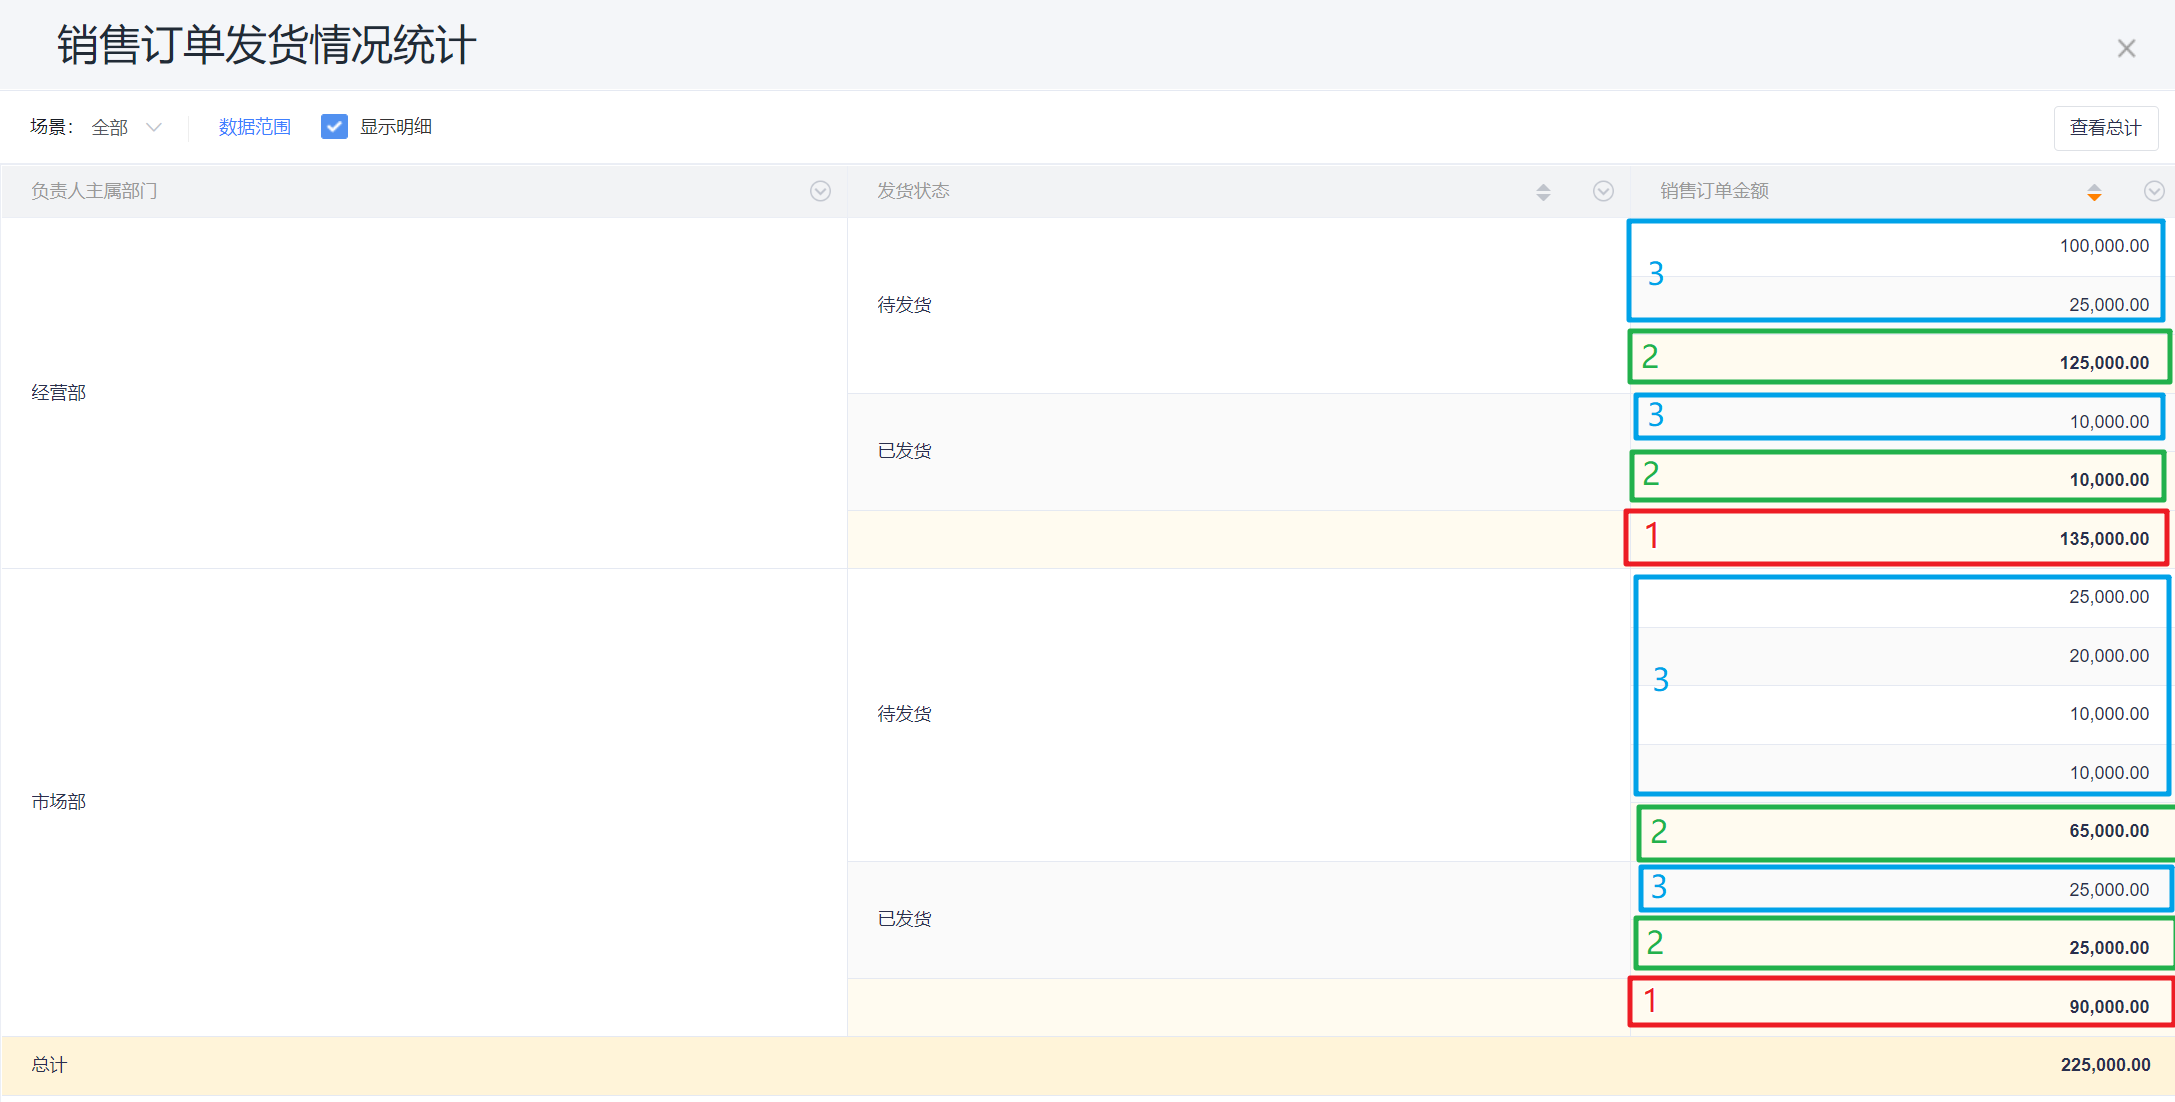
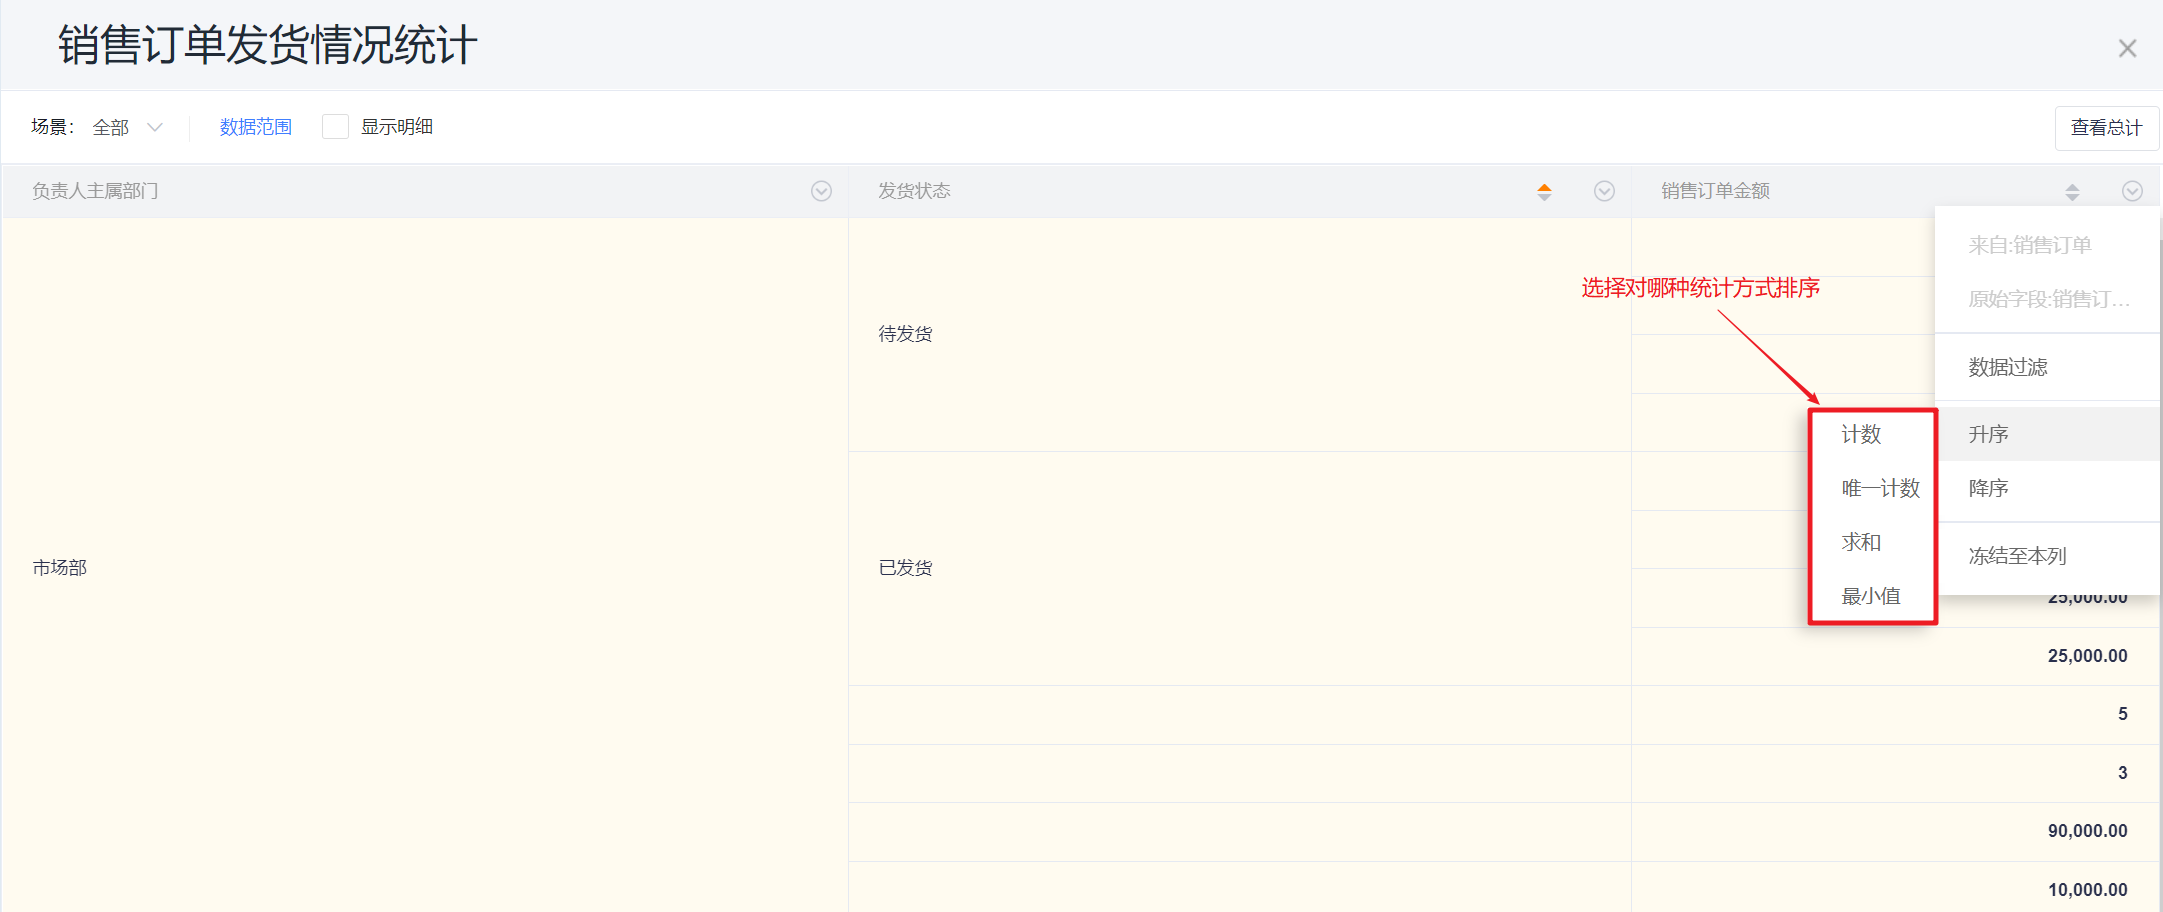
3.7 Sort Aggregated Columns
- You can sort by aggregated columns.
- Example: If the first group is Primary Role (Dept.), second group is Order Status, and the aggregated column is Sales Order Amount - Sum, you can sort by Sales Order Amount - Sum.
Web display:
- Example: If the first group is Primary Role (Dept.), second group is Order Status, and the aggregated column is Sales Order Amount - Sum, you can sort by Sales Order Amount - Sum.
 </img>
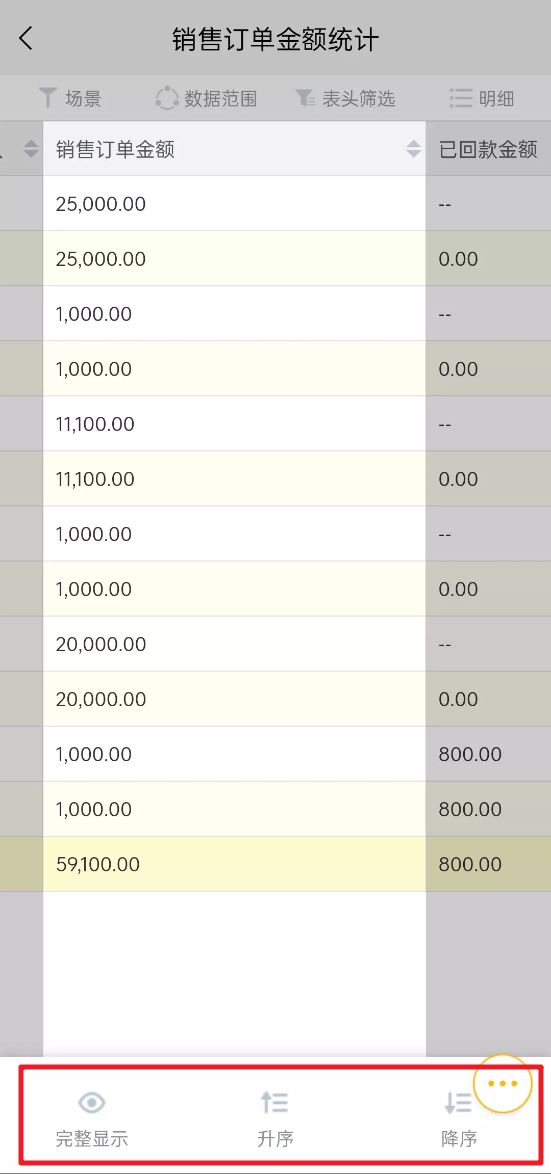
Mobile display:
- Compared with group fields, aggregated columns do not include the "Freeze to this column" option.
 </img>
- Sorting rules:
- First, sort subtotals for each department in the first group (the red-box values in the example);
- Then, within each department, sort subtotals for order status (green-box values);
- Finally, within each status, sort each detail order amount (blue-box values);
- Sorting by aggregated columns cannot be performed simultaneously with group sorting.
- If an aggregated column has multiple aggregation methods, select a single aggregation method before sorting; you can only sort by one aggregation at a time.
 </img>
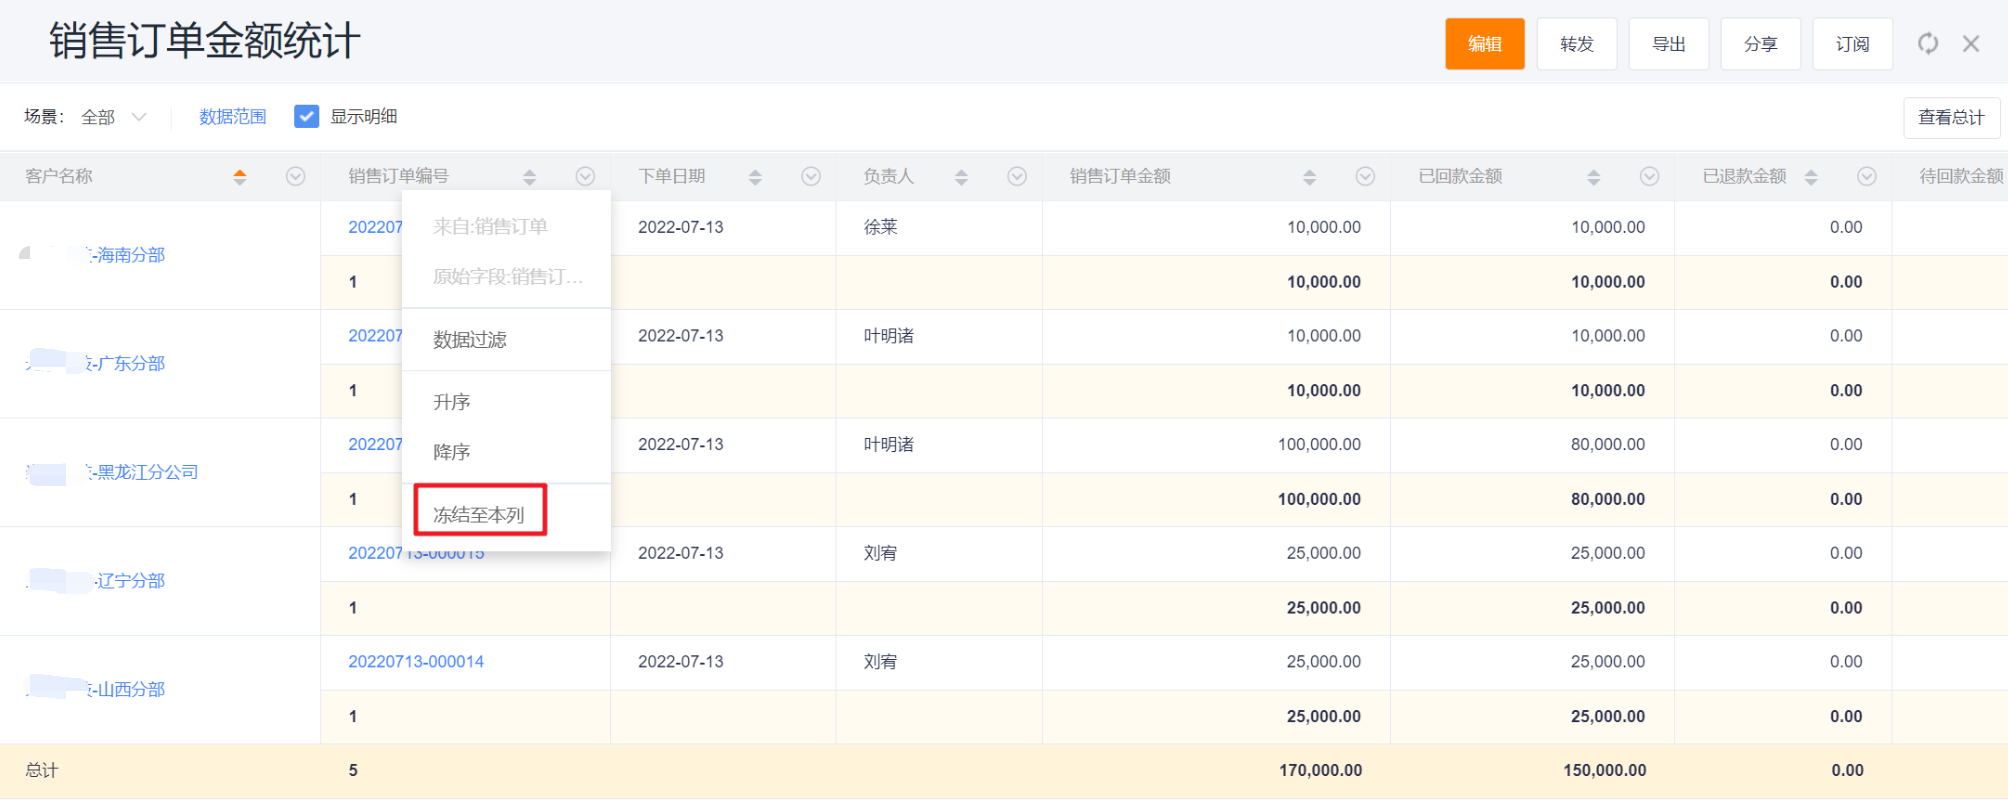
3.8 Column Freezing
- Use the column header menu → Freeze to this column to freeze that column and all columns to its left. Remaining columns on the right can be scrolled horizontally.
- Note: All grouped columns are frozen by default.
 </img>
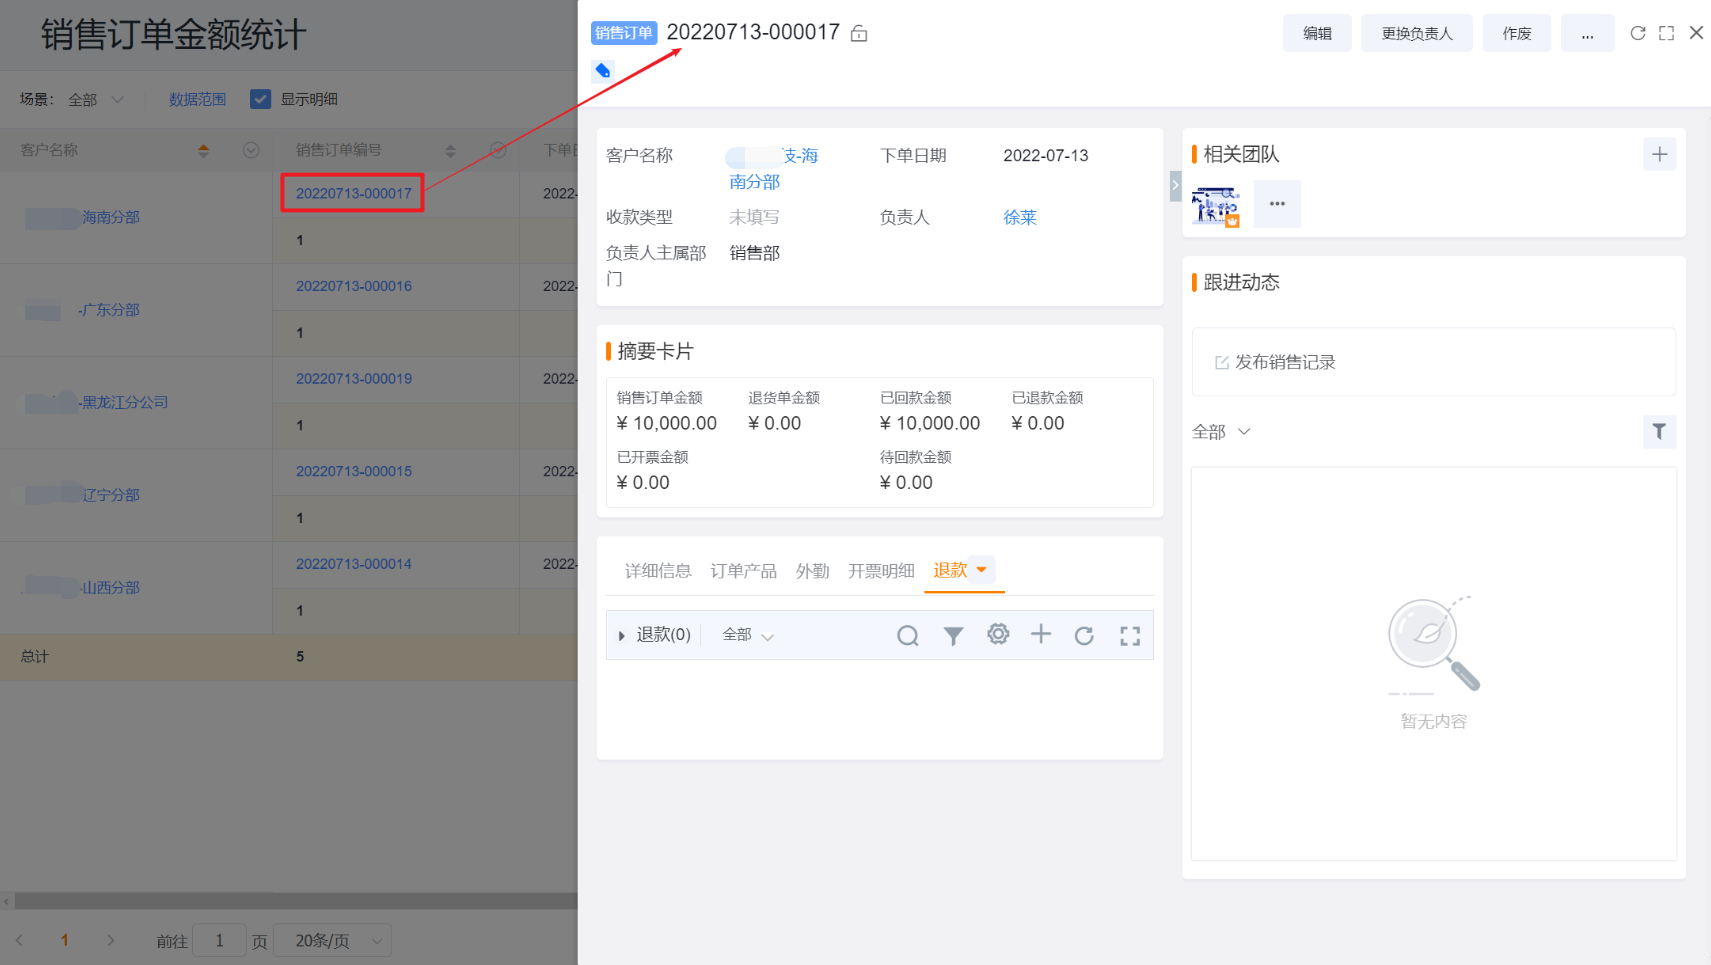
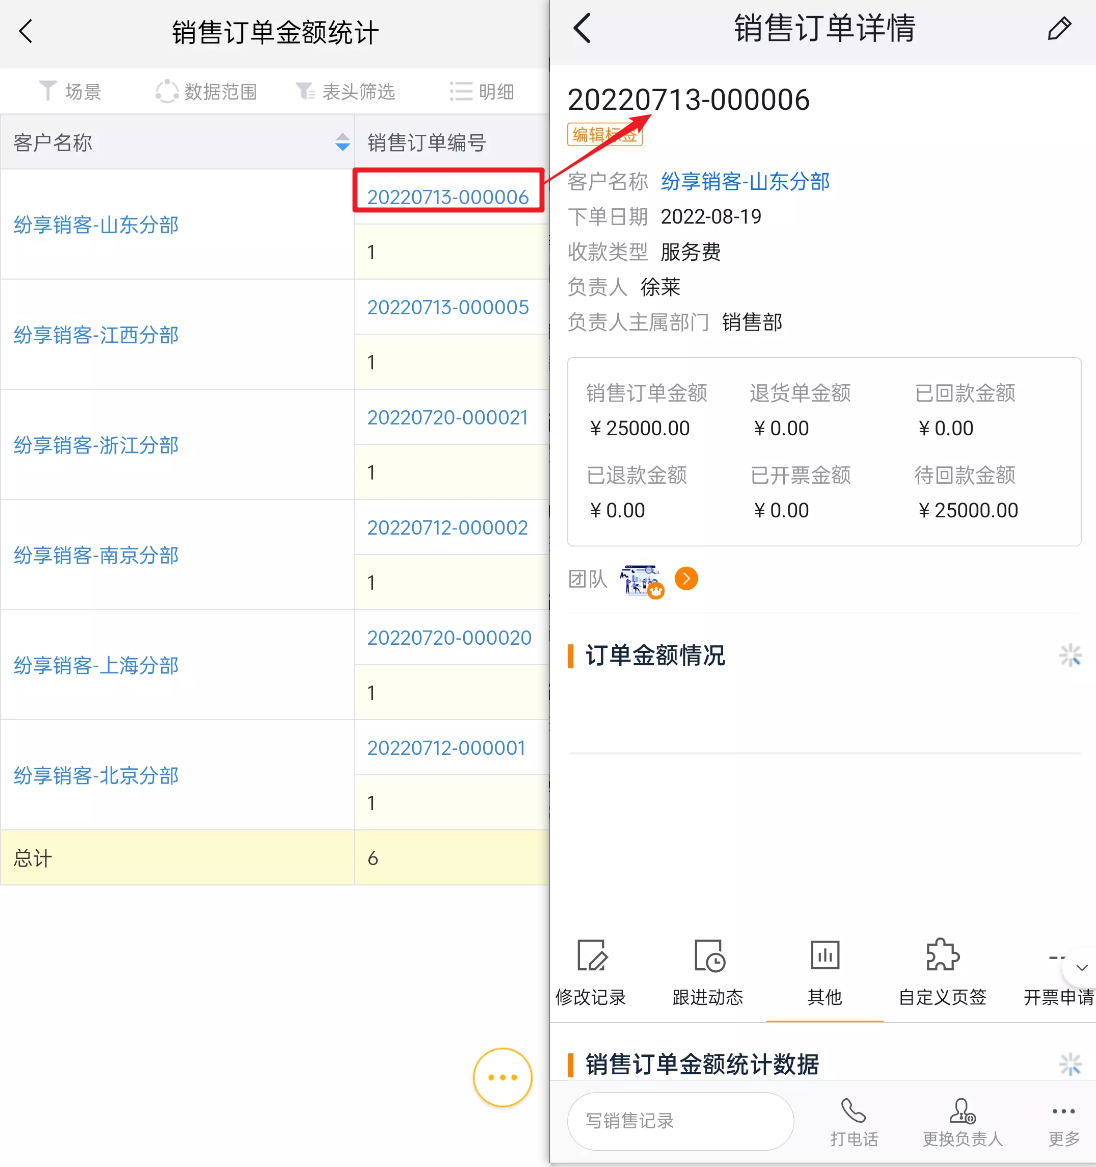
3.9 Link to CRM Record Detail
- Clicking a Primary Object's primary attribute in a report navigates to that record's CRM detail page — e.g., Account Name under Account, Sales Order Number under Sales Order.
Web display:
 </img>
Mobile display:
 </img>
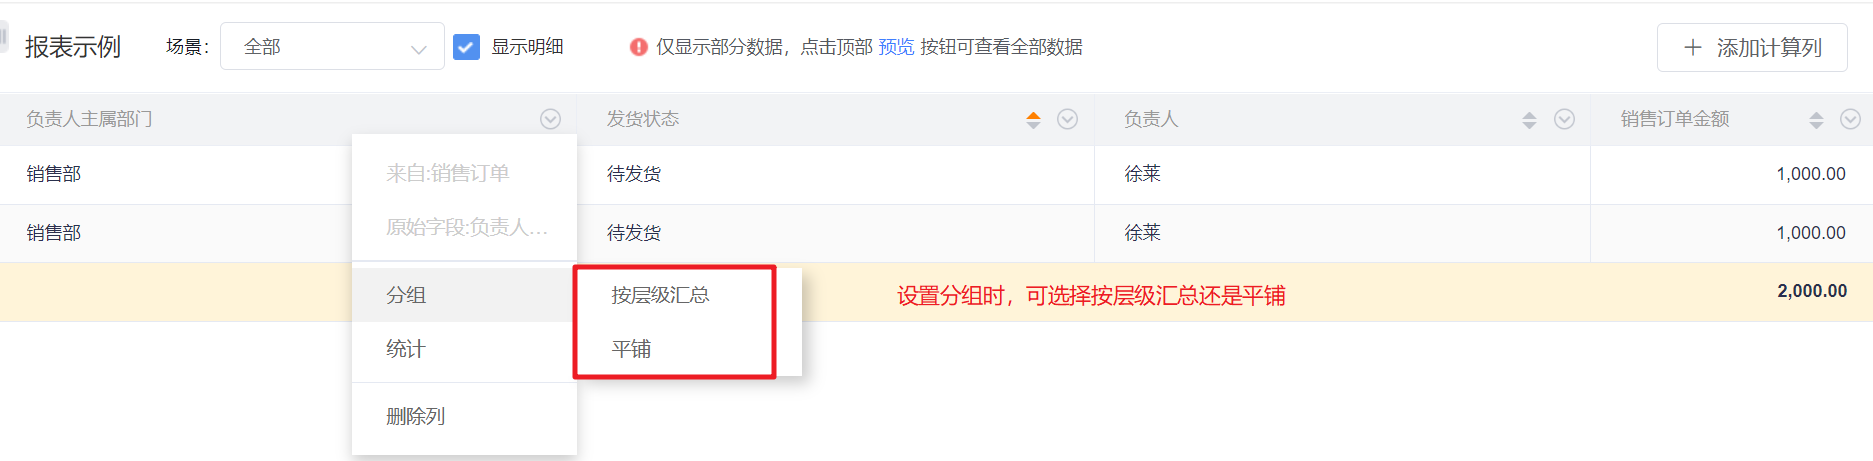
3.10 Dept. Type Field Drill-down
- When using employee department fields (Primary Dept., Affiliated Dept.) as group fields, you can display departments either as Tile or as hierarchical aggregation:
- Tile: All department levels display together;
- Hierarchical aggregation: Shows the highest-level departments within the viewer's permission. Departments that have children display in blue; click to drill down to the next level. The header shows the drill-down path.
- When creating a report, dragging the department field into the header (not as a group) displays the employee's Primary Dept. or Affiliated Dept. If used as a group field with hierarchical aggregation:
- Primary Dept. displays as "Company-wide" at top-level. The preview and detail pages allow clicking Company-wide to drill down by organization hierarchy until reaching individuals. Click the path in the report header to navigate back to any level in the drill path;
- Affiliated Dept. displays starting from the highest department level the current employee belongs to.
- If you filter by departments (Primary Dept., Affiliated Dept.) in Data Scope, you can choose either the entire company or specific departments. For example, set Owner Primary Dept. to Business Dept and Marketing Dept in Data Scope; the Owner Primary Dept. group in the report will list just those two departments, and drill-down in preview will start from those departments.
Note: Custom department fields currently only support Tile display; they behave the same as Primary Dept. / Affiliated Dept. in Tile mode.
 </img>
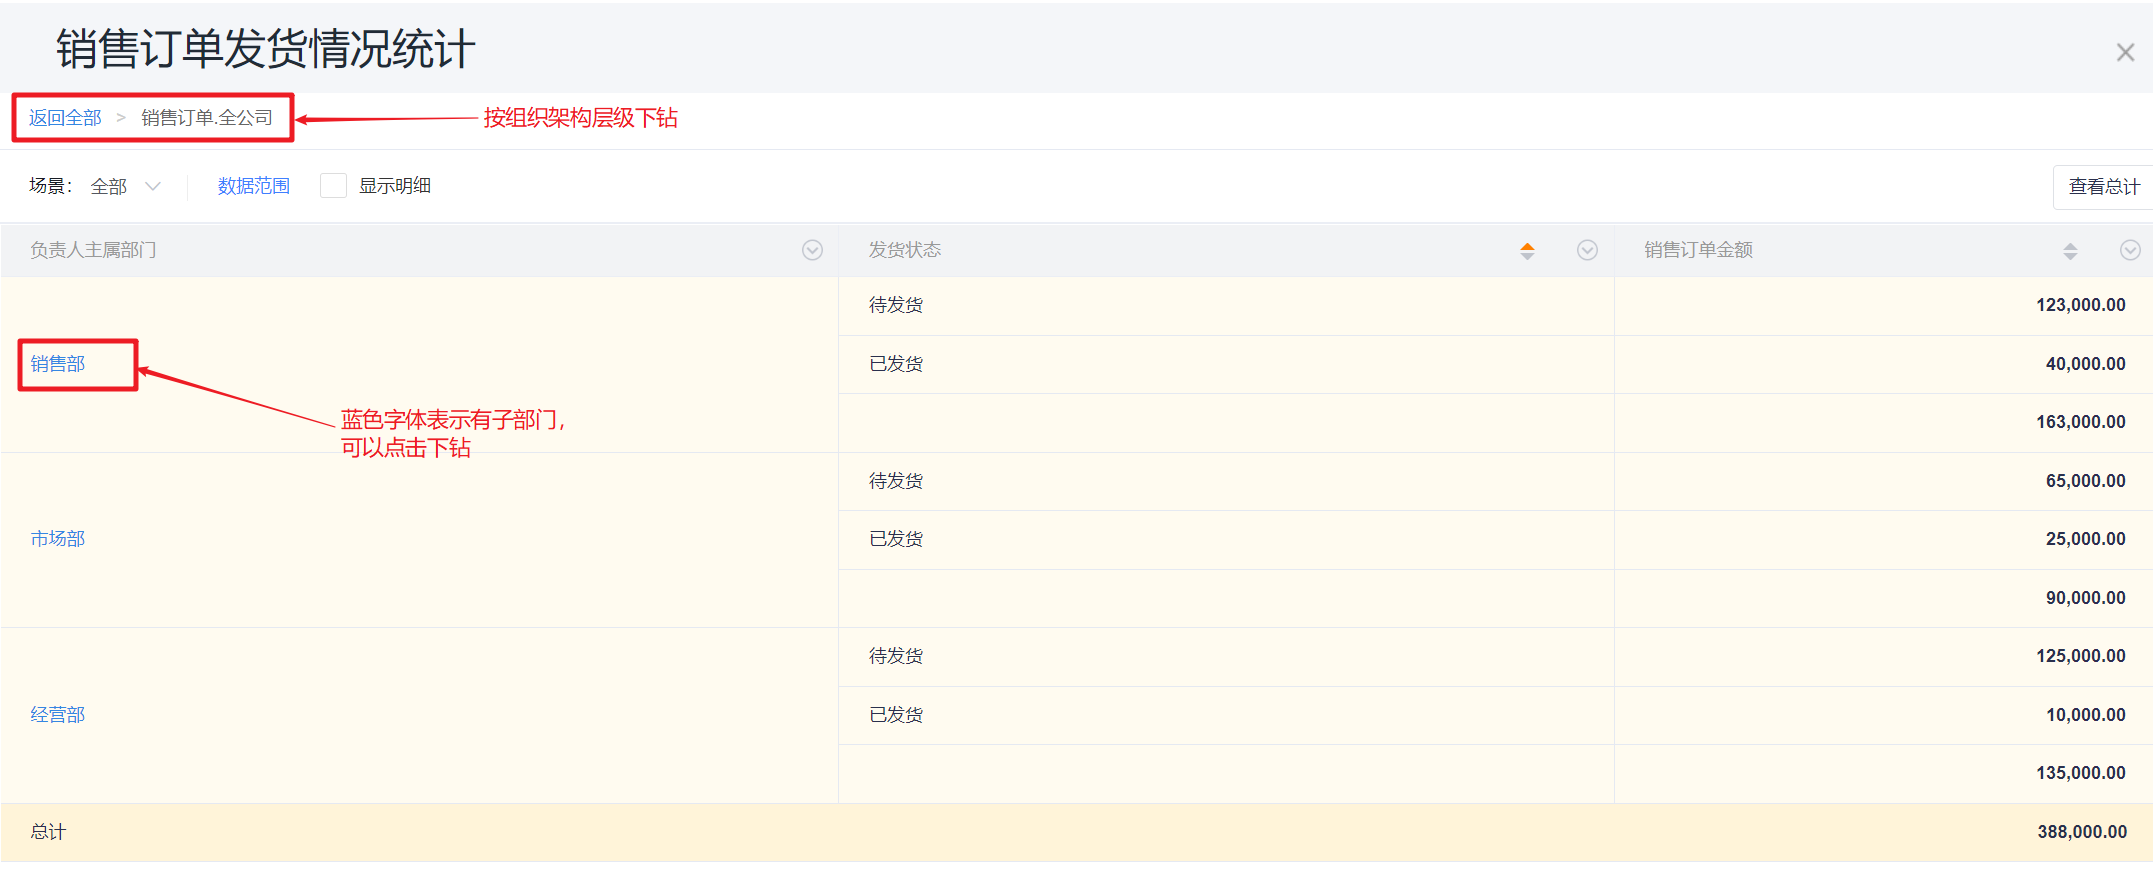 </img>
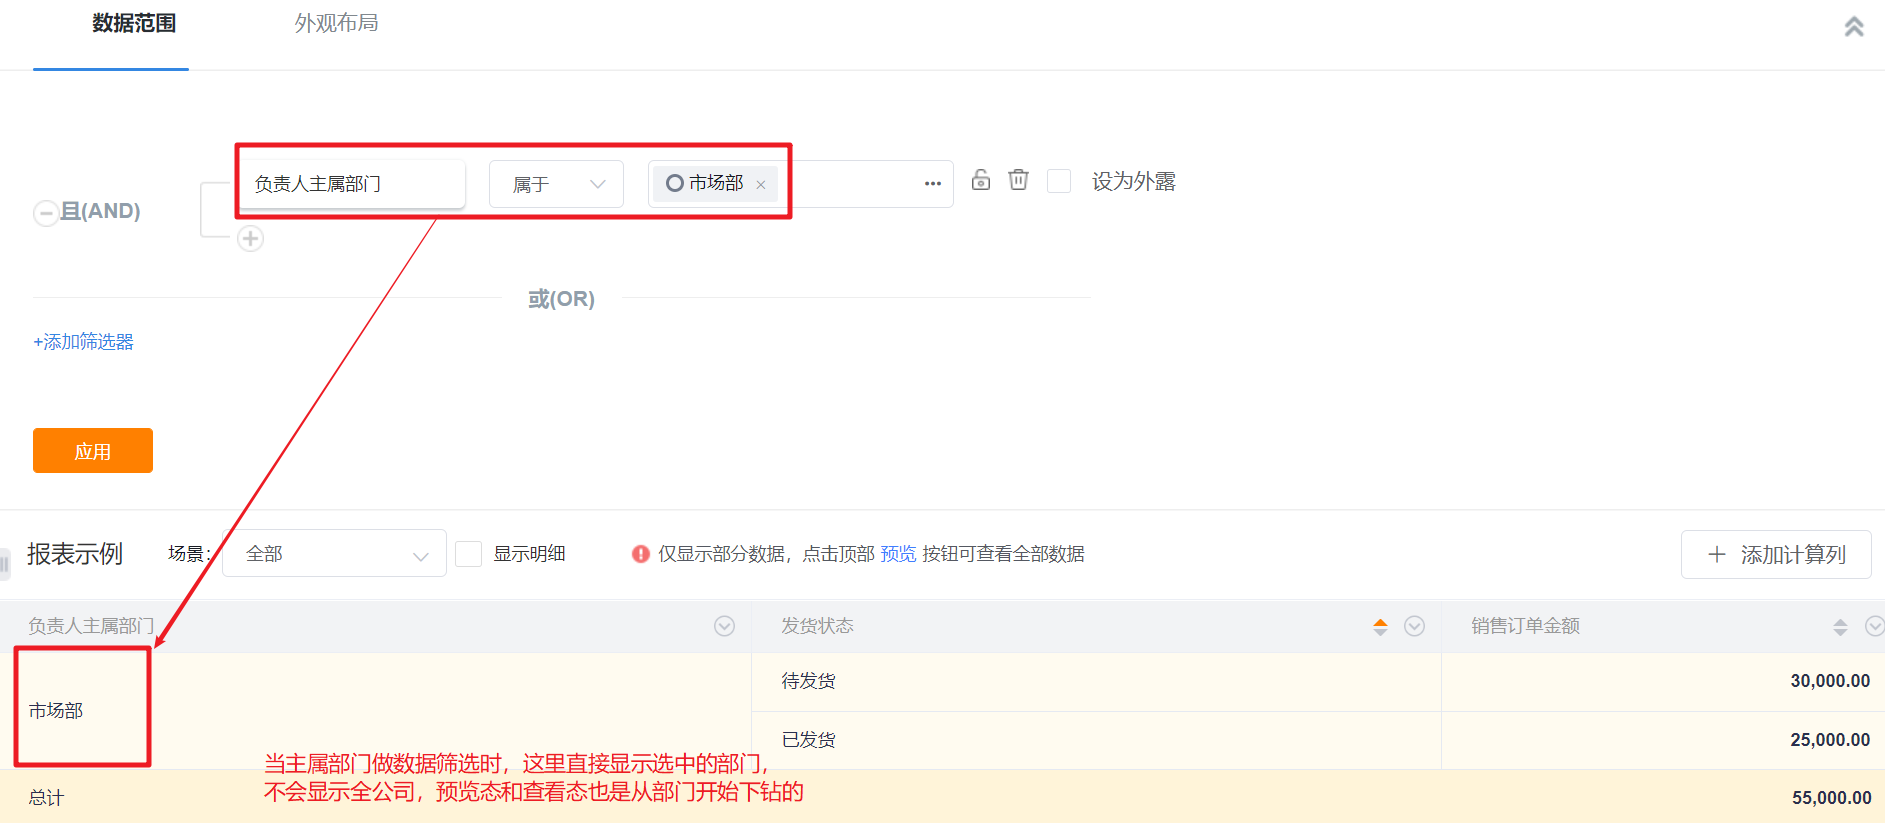 </img>
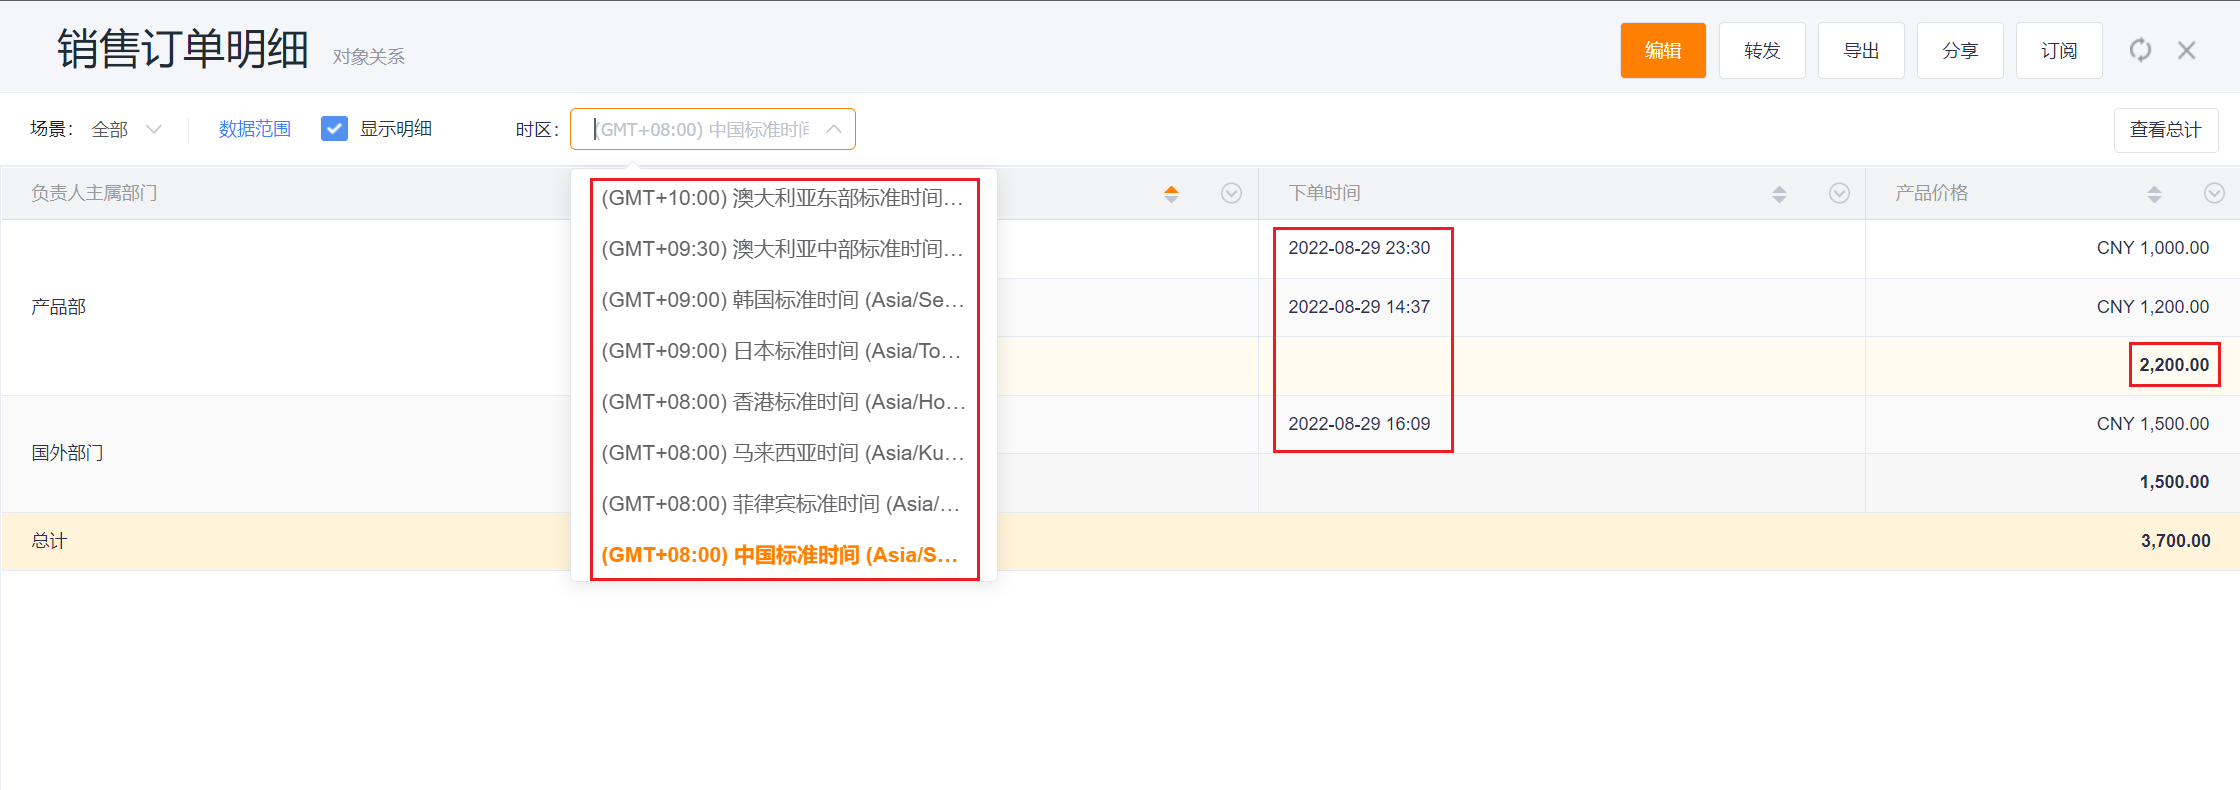
3.11 Switch Time Zone
- Organizations with Multi-Time Zone enabled can switch the viewing time zone. After switching, the report displays and aggregates data according to the selected time zone.
 </img>
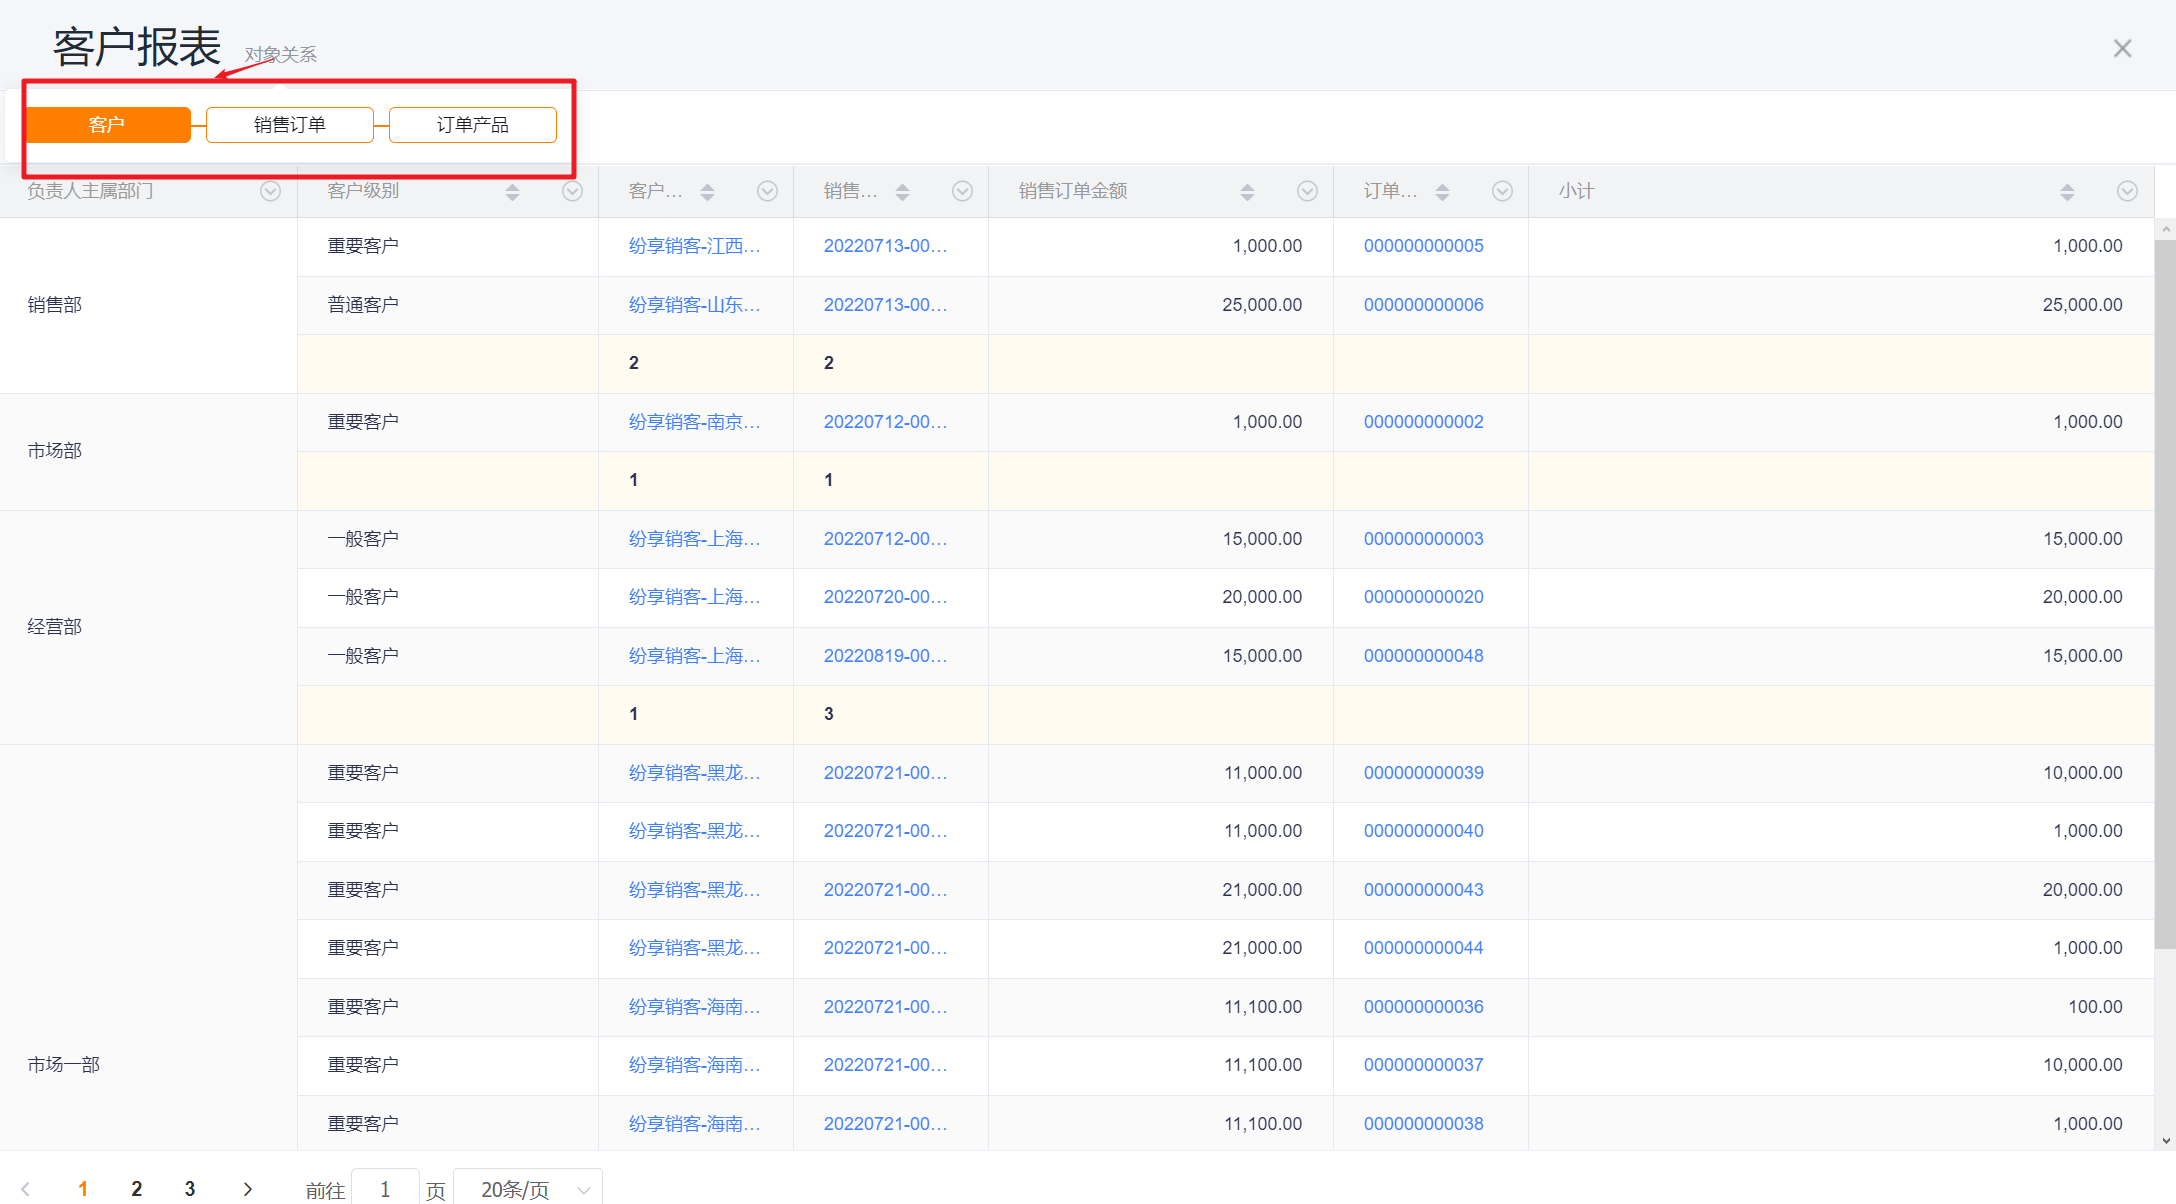
3.12 View Object Relationships
- In view and preview modes you can inspect object relationships. Hover over "Object Relationships" to see the objects used by the chart and their relationships.
 </img>
3.13 Others
- Forward: When forwarding a report, recipients see data limited to their own permissions.
- Post (Share): Sharing a report publishes it as an Excel file. Recipients who can view the report will see the same exported file.
- Export: Exporting from the report view preserves the current scene, Data Scope, and header filters so the exported data matches what you see.
- Exporting from the report list uses the default scene and Data Scope.
- Subscription: Each subscriber receives report data that is restricted to their permission scope; subscriptions do not expand a user's visibility.
- Note: Filter scenes, Data Scope, and header filters adjusted during viewing are temporary and are not saved. To persist changes, open the report in the designer and save modifications.