
1. Report
1.1 The total number of customer BI data tables does not match the actual data
The report is grouped by the product name on the order product, and the order amount of the order is counted. The order amount is deduplicated and summed according to the main attribute of the order. Because an order has multiple order products, it may have multiple product names, so The order deduplication sum will be less than the subtotal sum.
1.2 There is no total in the report, and the total is grayed out. What is the reason?
No grouping is set, nor is the statistical method of the field set, so subtotals and totals are not optional. Subtotal and total are used in conjunction with group statistics.
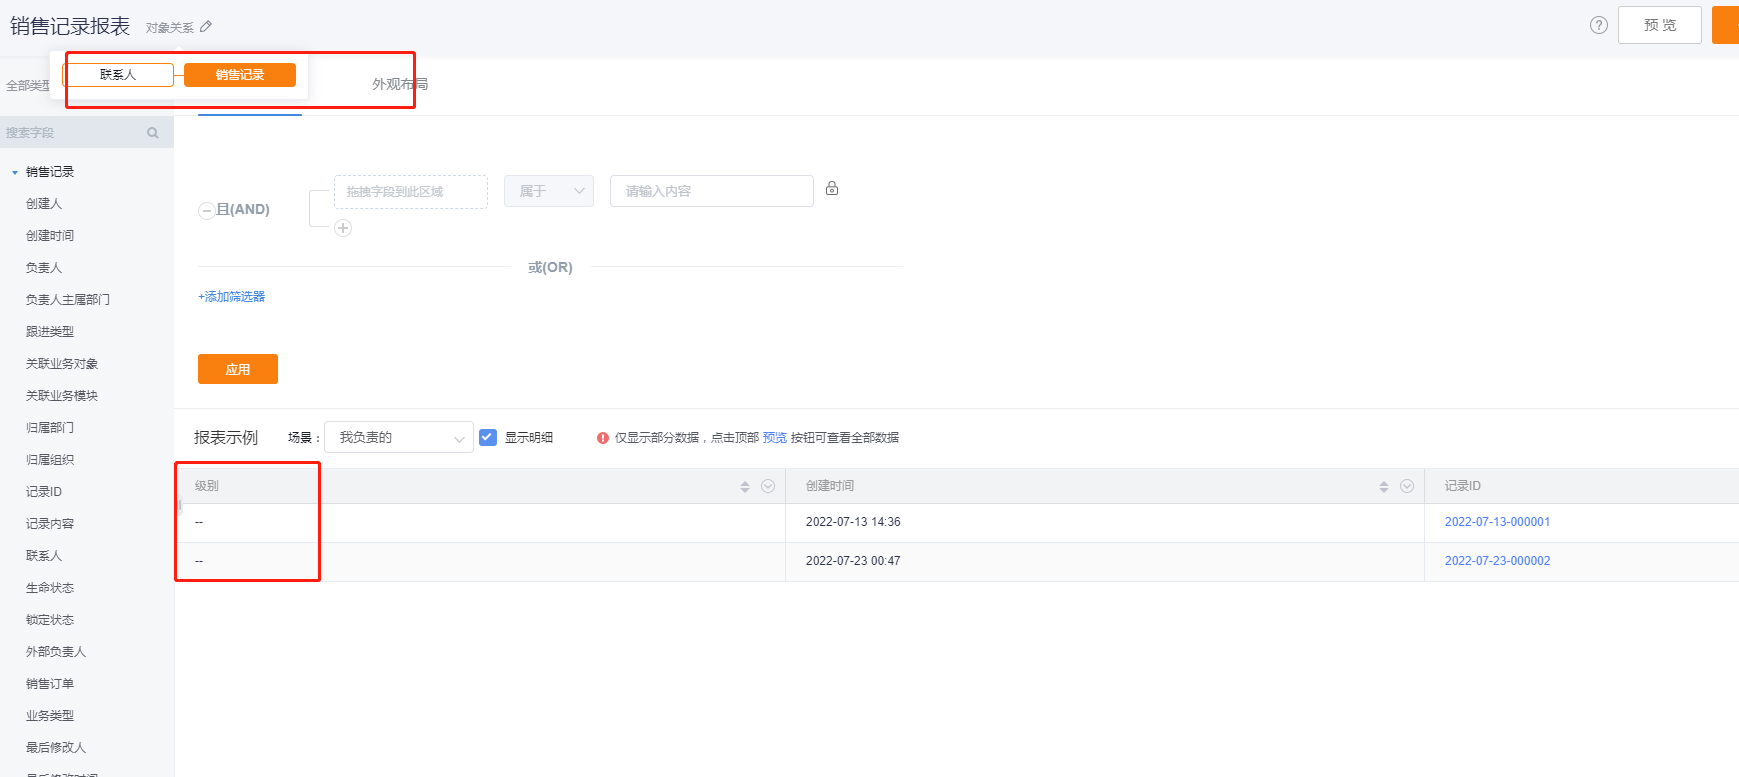
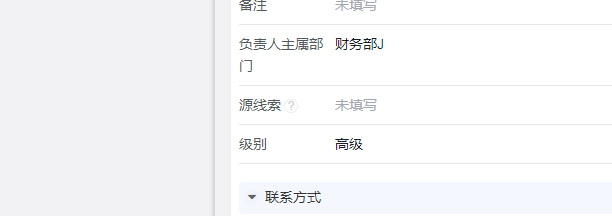
1.3 The sales record-contact person set by the report object, the corresponding personnel cannot bring out the corresponding level when the report is set, the sales record is the main module, and there are multiple associated objects.
This sales record is not associated with a contact (the relationship in the report is established by tracking person 1), so the data cannot be associated with the contact, and the level of the contact cannot be obtained. The field of the data that establishes the relationship between the sales record and the contact person is the tracker, which is a multi-choice field for finding associations. This bi does not support it for the time being. Please use tracking person 1 or dynamic search association to establish the relationship between data.
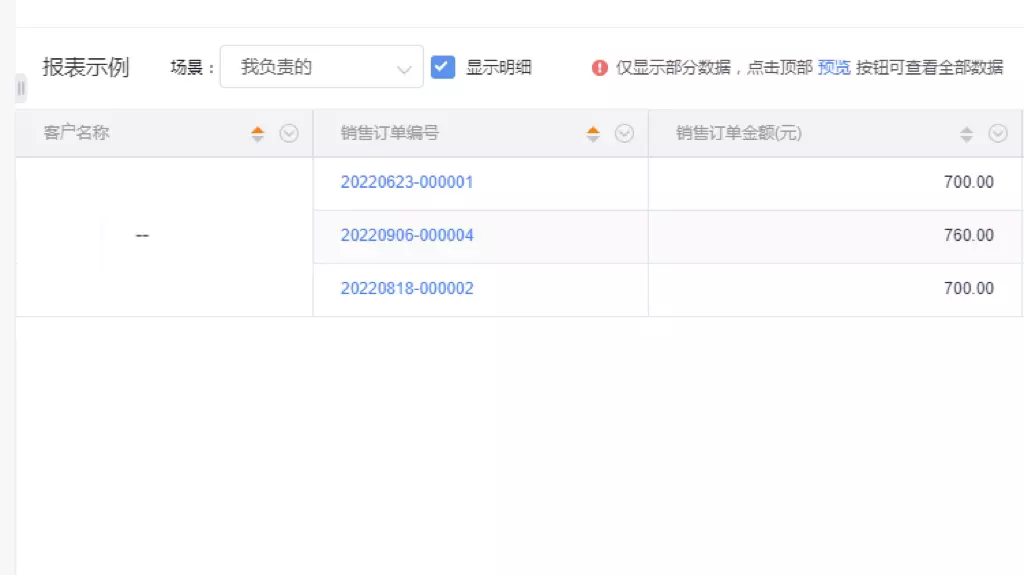
1.4 The report does not display the customer name, there is no problem with the authority, and there is no problem with the data range
This is the sales record object to find the associated order, but the associated order field is empty, so it shows -- .
According to the record ID, there are associated orders and customers. That is because the data on the record ID echoes the what list field type, which is inconsistent with your search association type.
1.5 The business opportunity contact cannot select the position field when making a report
Currently not supported, troubleshooting ideas: 1. Check whether the person has permission to this field 2. If yes, see if it is preset logic-raise demand 3. Temporary solution: create a new field
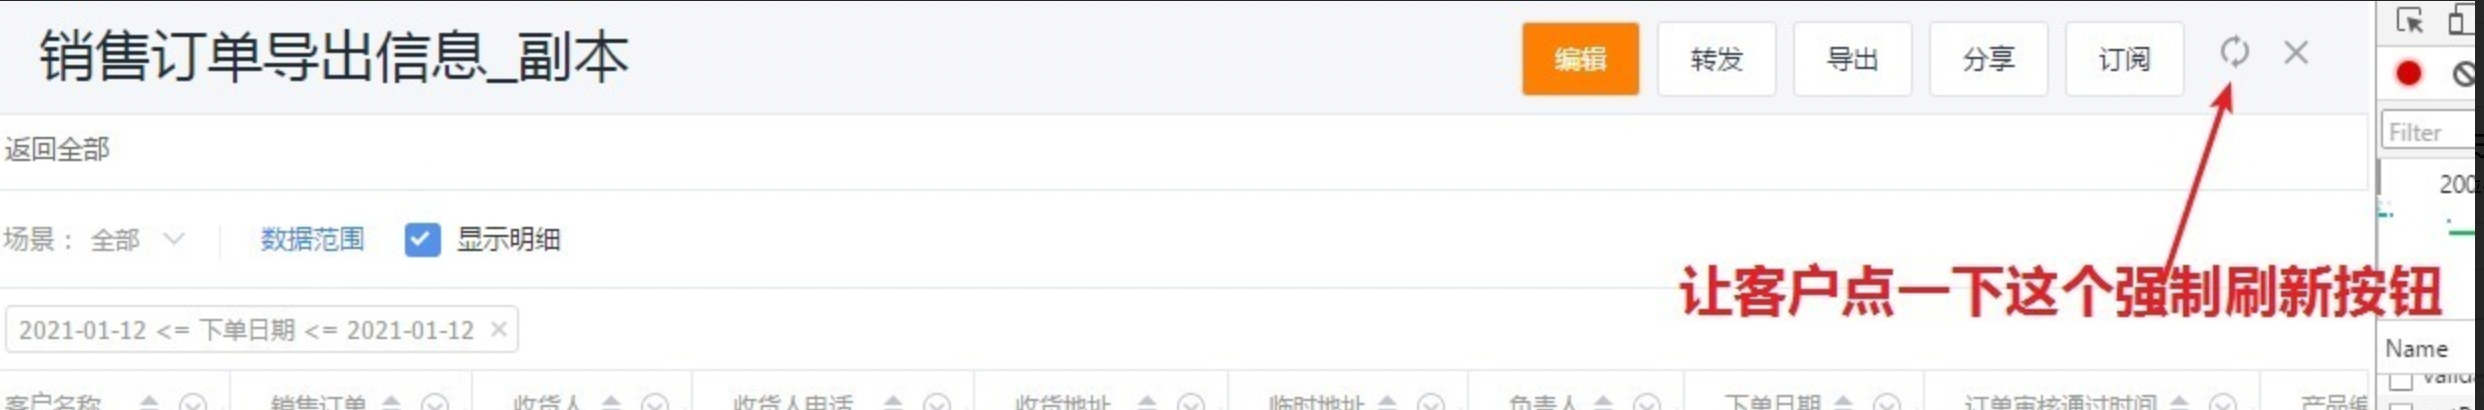
1.6 I drew a report with "sales plan" as the main body, and now I have a problem: if I go to check the report immediately after the data is modified in the document, the data displayed in the report is incorrect, and the data before the modification is displayed, and I have to wait It will take a while (about ten minutes) to synchronize.
The report will have a 10-minute query cache, and there will be a button to force the cache to be refreshed in the upper right corner of the chart running state.
1.7 The report cannot be filtered according to the set department, only the data of front-line sales can be seen. All the data of all Hefei sectors have been shared with this employee in the report, and the timely report cannot be filtered by department at will
The main object of the report is the customer, the data authority of the report is the data authority of the main business object, and the department authority of the person in charge is the customer object. What is shared is the sales record and field work, and the customer is not shared, so the customer object has no department authority, and the department can be shared based on the customer object.
1.8 There are no settings such as address book isolation. Why can only 3 departments be seen when screening in the cockpit, but all departments can be selected by other colleagues in the same cockpit?
The globally screened departments and people in the data cockpit are based on data permissions, and are displayed for departments and people with data permissions. If they cannot be screened, it is because people in other departments do not have data permissions.
1.9 The province under the customer object has a value, but in the report statistics, set the province as the data range, and the filtered data is empty
Lead-customer is a lookup relationship established through the main thread on the customer. Only when the main thread of the customer object has a value can the relationship between data be established. Confirm whether the field of the main thread of the customer has a value
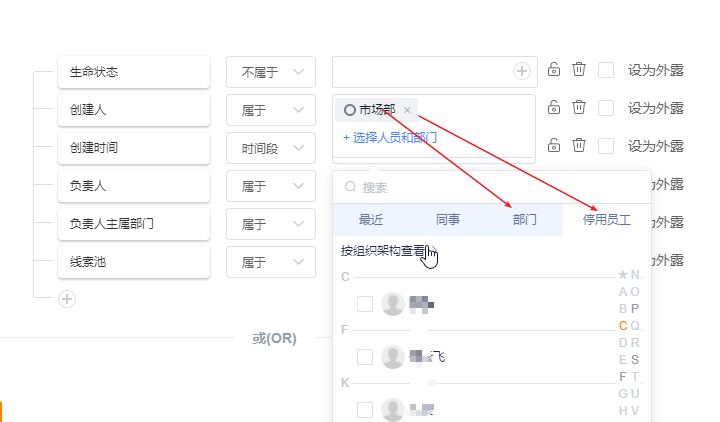
1.10 Why is there no data of deactivated employees in the chart using creator filter?
In the data range, the person in charge, the department in charge of the person in charge, the department under the person in charge, the screening of employee names, whether the data of resigned employees is included in the configuration,
Departments or personnel screening departments other than these four fields do not contain the data of resigned employees, and the data can be filtered by combining selected departments + deactivated employees
2. Statistics
2.1 The statistical field under advanced field work is not accurate. If you visit a customer three times in a week, but count it once
Check the statistical indicators of customers. The statistical indicators of customers under the advanced field object are counted according to "check-in time", and the only count (according to the planned date and completion date) is counted as 1 when the time is repeated. Solve: add a text field, the default value is planned date. Use this field to create statistical indicators
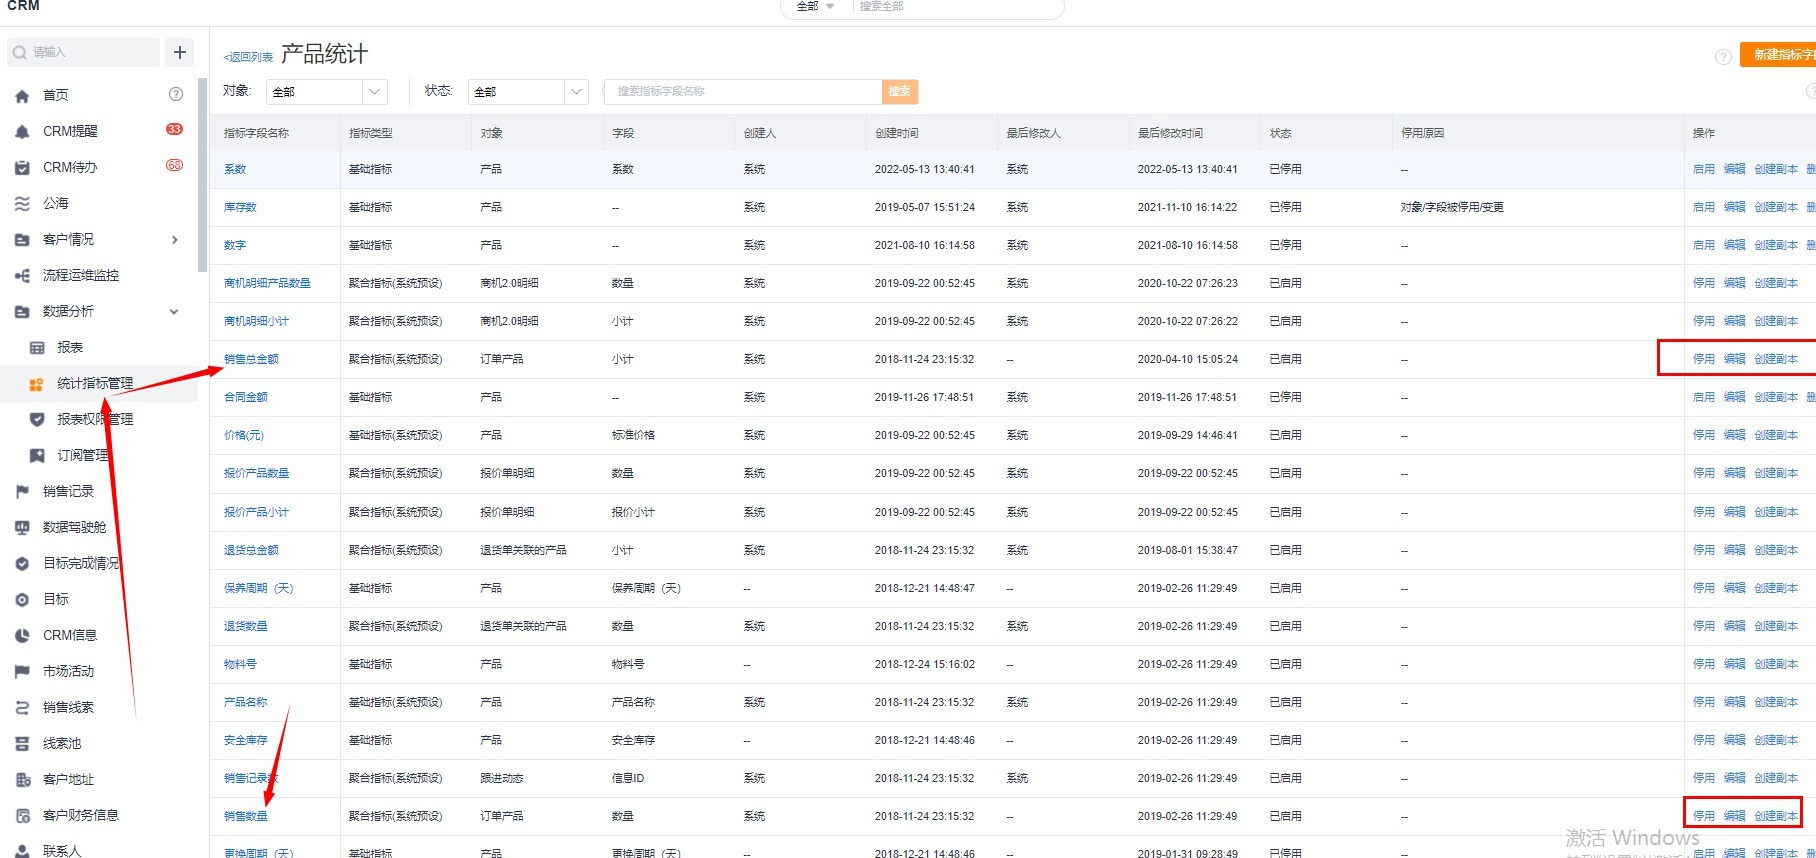
2.2 Create a new statistical chart-preset theme-sales lead analysis-product analysis, prompt the total sales amount, and the sales quantity is disabled
Statistical Indicators Management - Indicators Enabled
2.3 For the shipped amount under the sales order, sum the "order tax-included amount" according to the shipping date. The statistical index value always shows 0
The data range is wrong, there is no value in the filtered data range
2.4 The dimension of Statistical Tula is the department, but what ordinary characters see is the personnel dimension
Solution: 1. Shared data is exclusive and shared based on the conditions of the person in charge 2. Add the identity of the report administrator
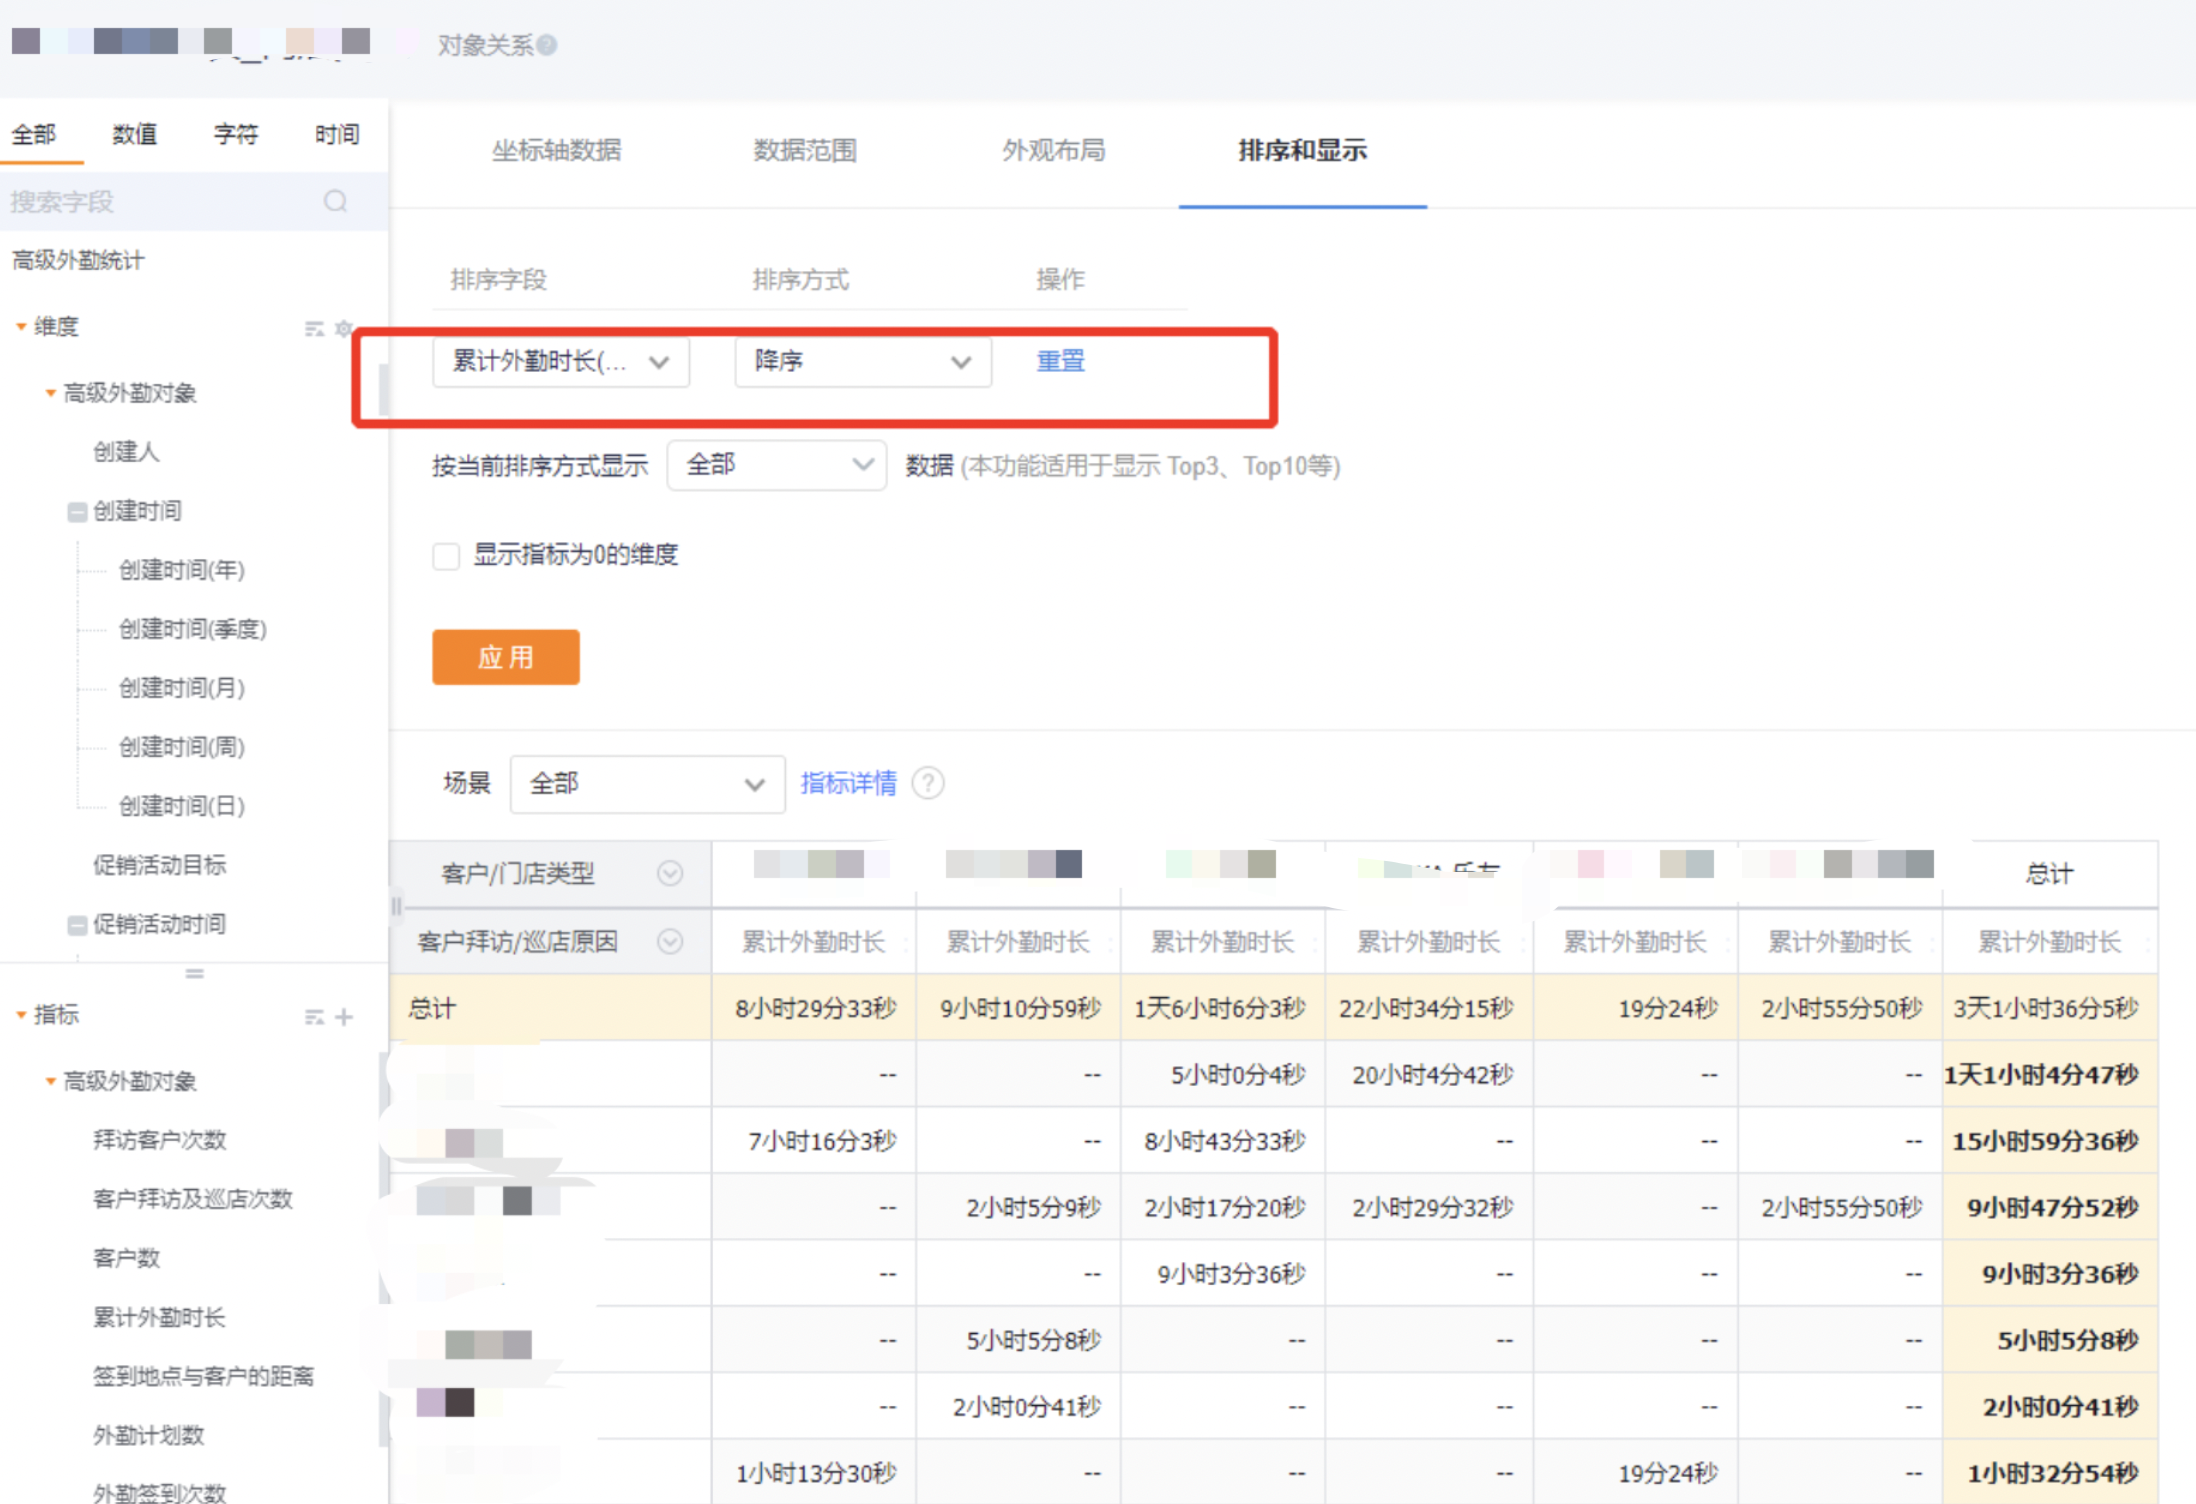
2.5 How to view data in ascending or descending order of field hours
Sorting and display configuration: selectable sorting fields and sorting methods
2.6 Can custom objects not be used as statistical charts?
Before creating a custom object statistical chart, you need to create a theme based on the object, and then create an indicator under the theme.
2.7 How to create indicators?
Find Statistical Index Management in CRM, click the button in the upper right corner to create a new index, enter the new page and configure the index according to your needs.
2.8 How to count who did not complete the task?
With the theme of personnel, create statistical charts and select relevant task indicators. After the creation is completed, statistics can be performed based on the statistical chart.
2.9 I want to see the coverage of the national market, how to count?
Statistical graphs support map modes (heat and bubbles), and you can create statistical graphs with regions as dimensions
2.10 Why are some people unable to see the data if there are statistical graphs?
The statistical data in the statistics chart is the data that the current user has permission to see. If data is missing, check if the missing data is visible to the user. It is recommended to let the user search for the missing data under the object. If it cannot be found on the list page, then the user does not have the data permission for the data. It is normal that it cannot be seen in the chart.