1. Splicing of Different Data Range
1.1 Case 1: Month, quarter and year data splicing
- Core Requirements: view monthly, quarterly and annual data together;
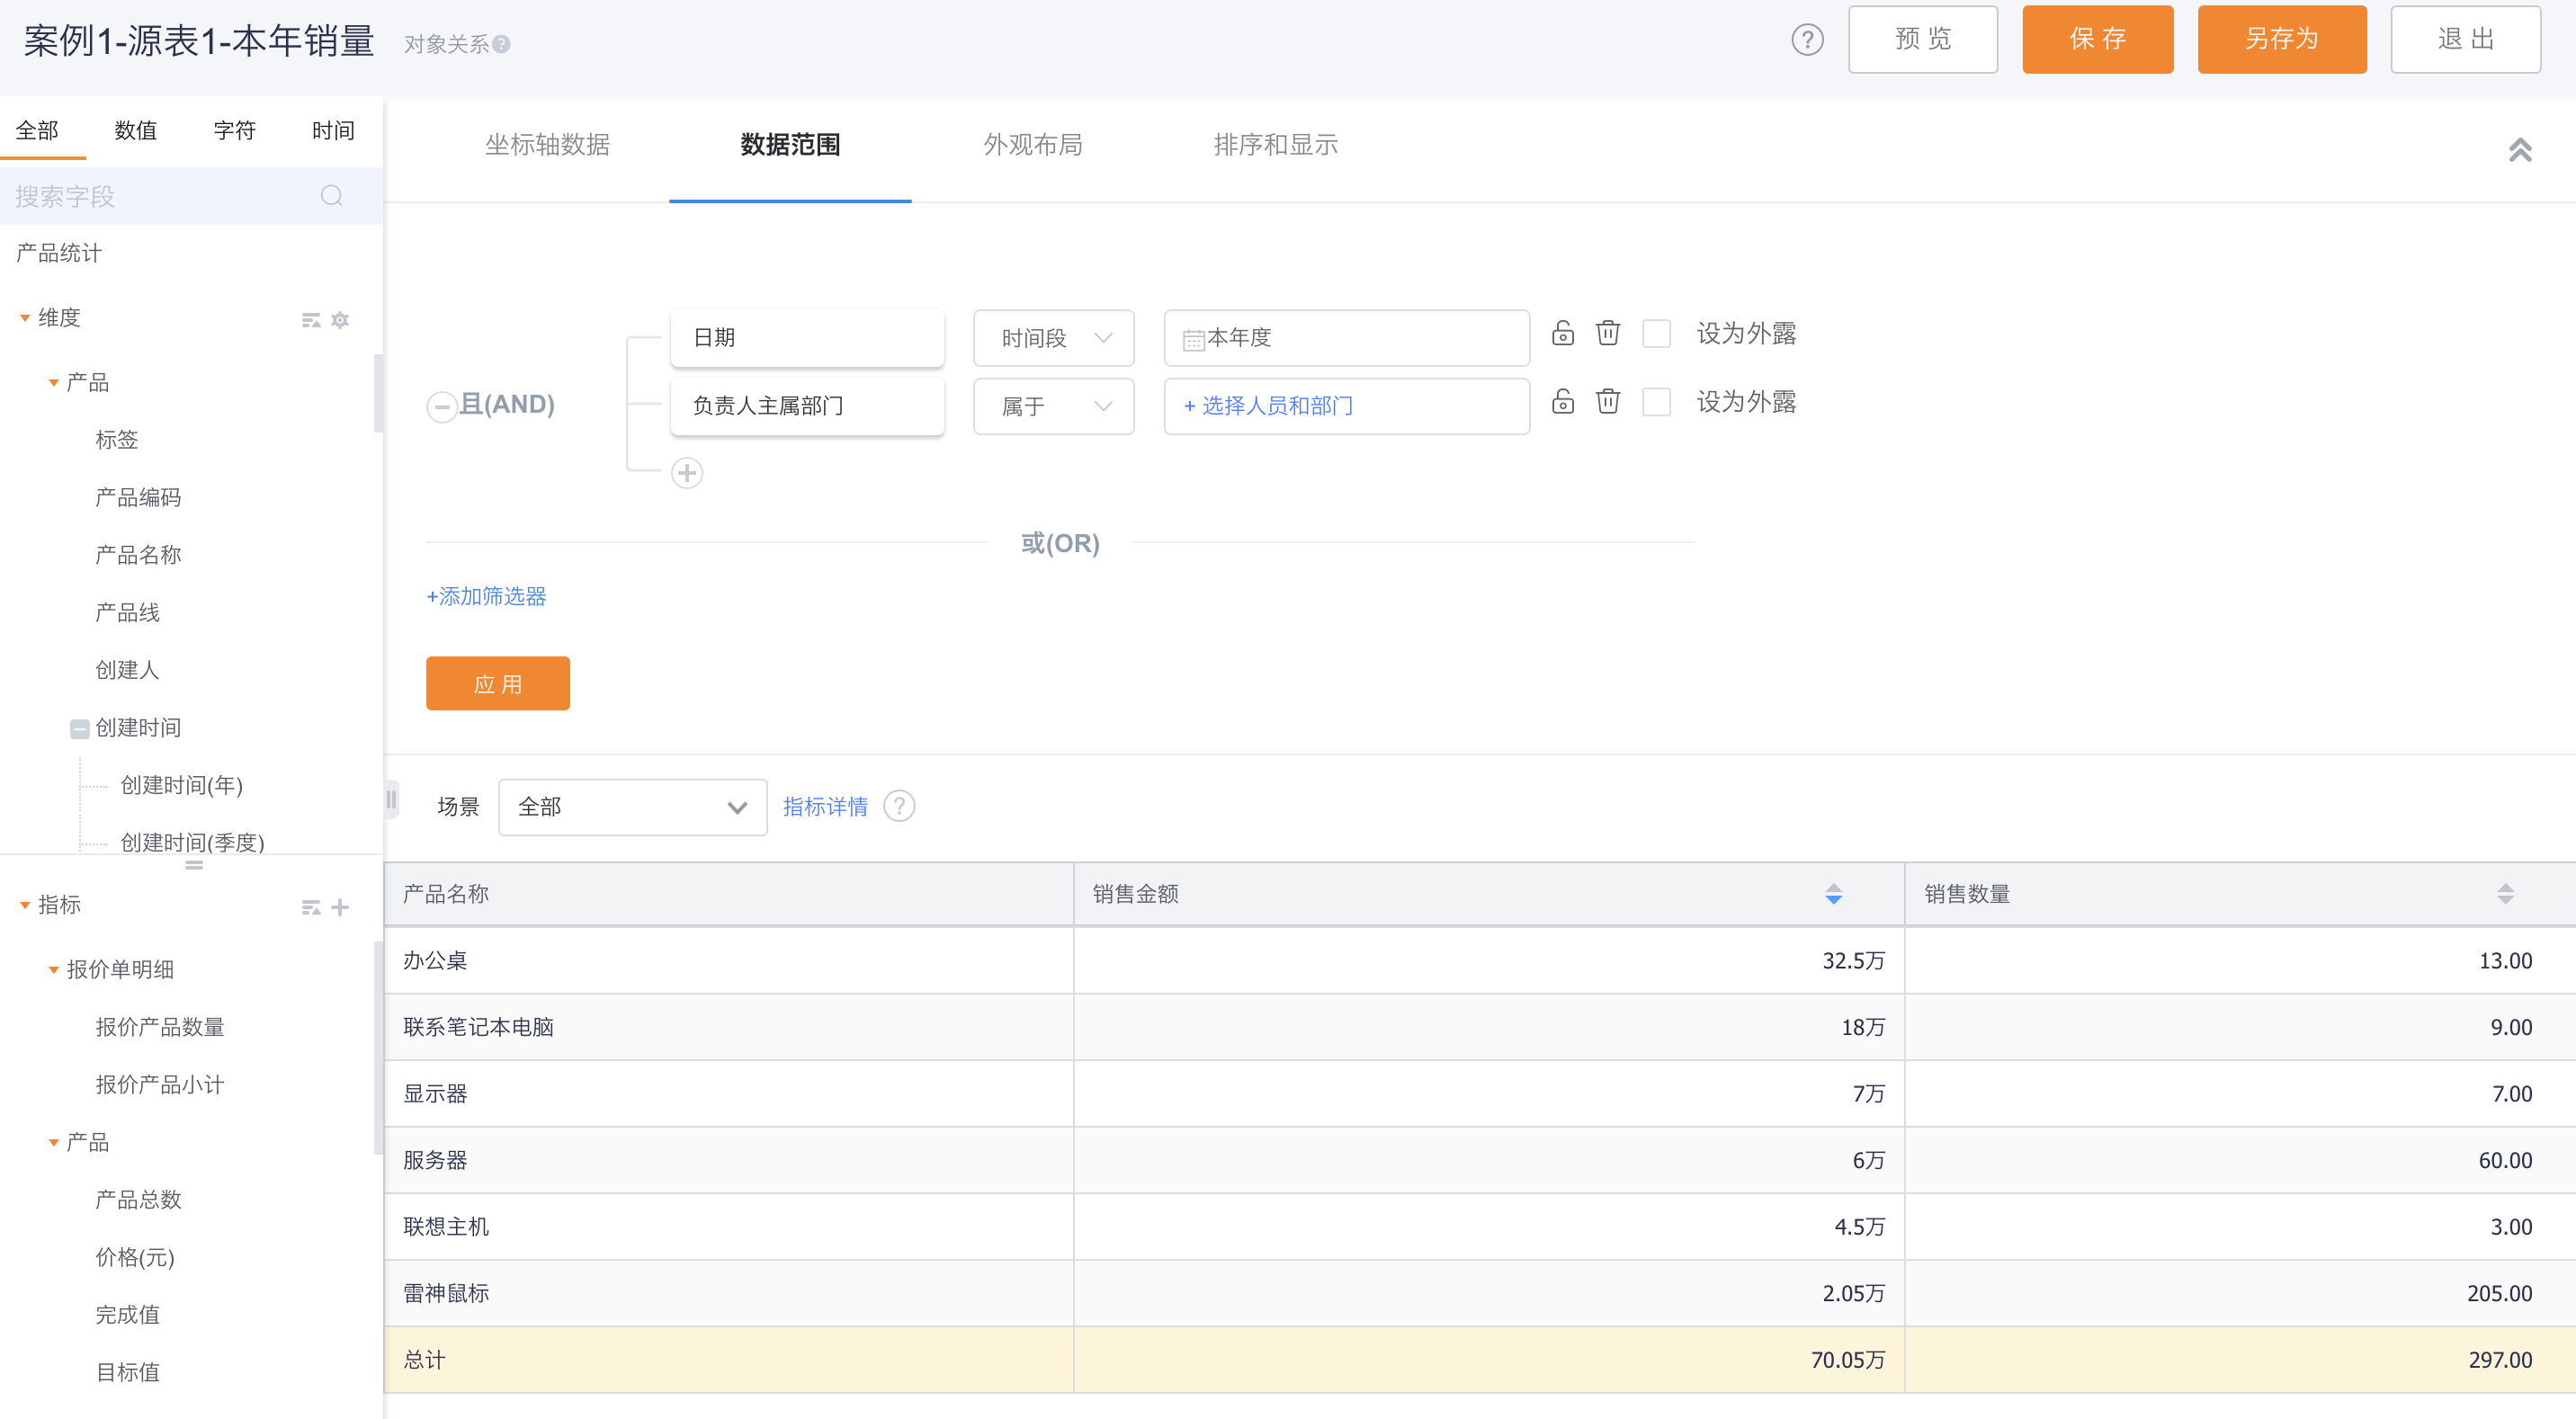
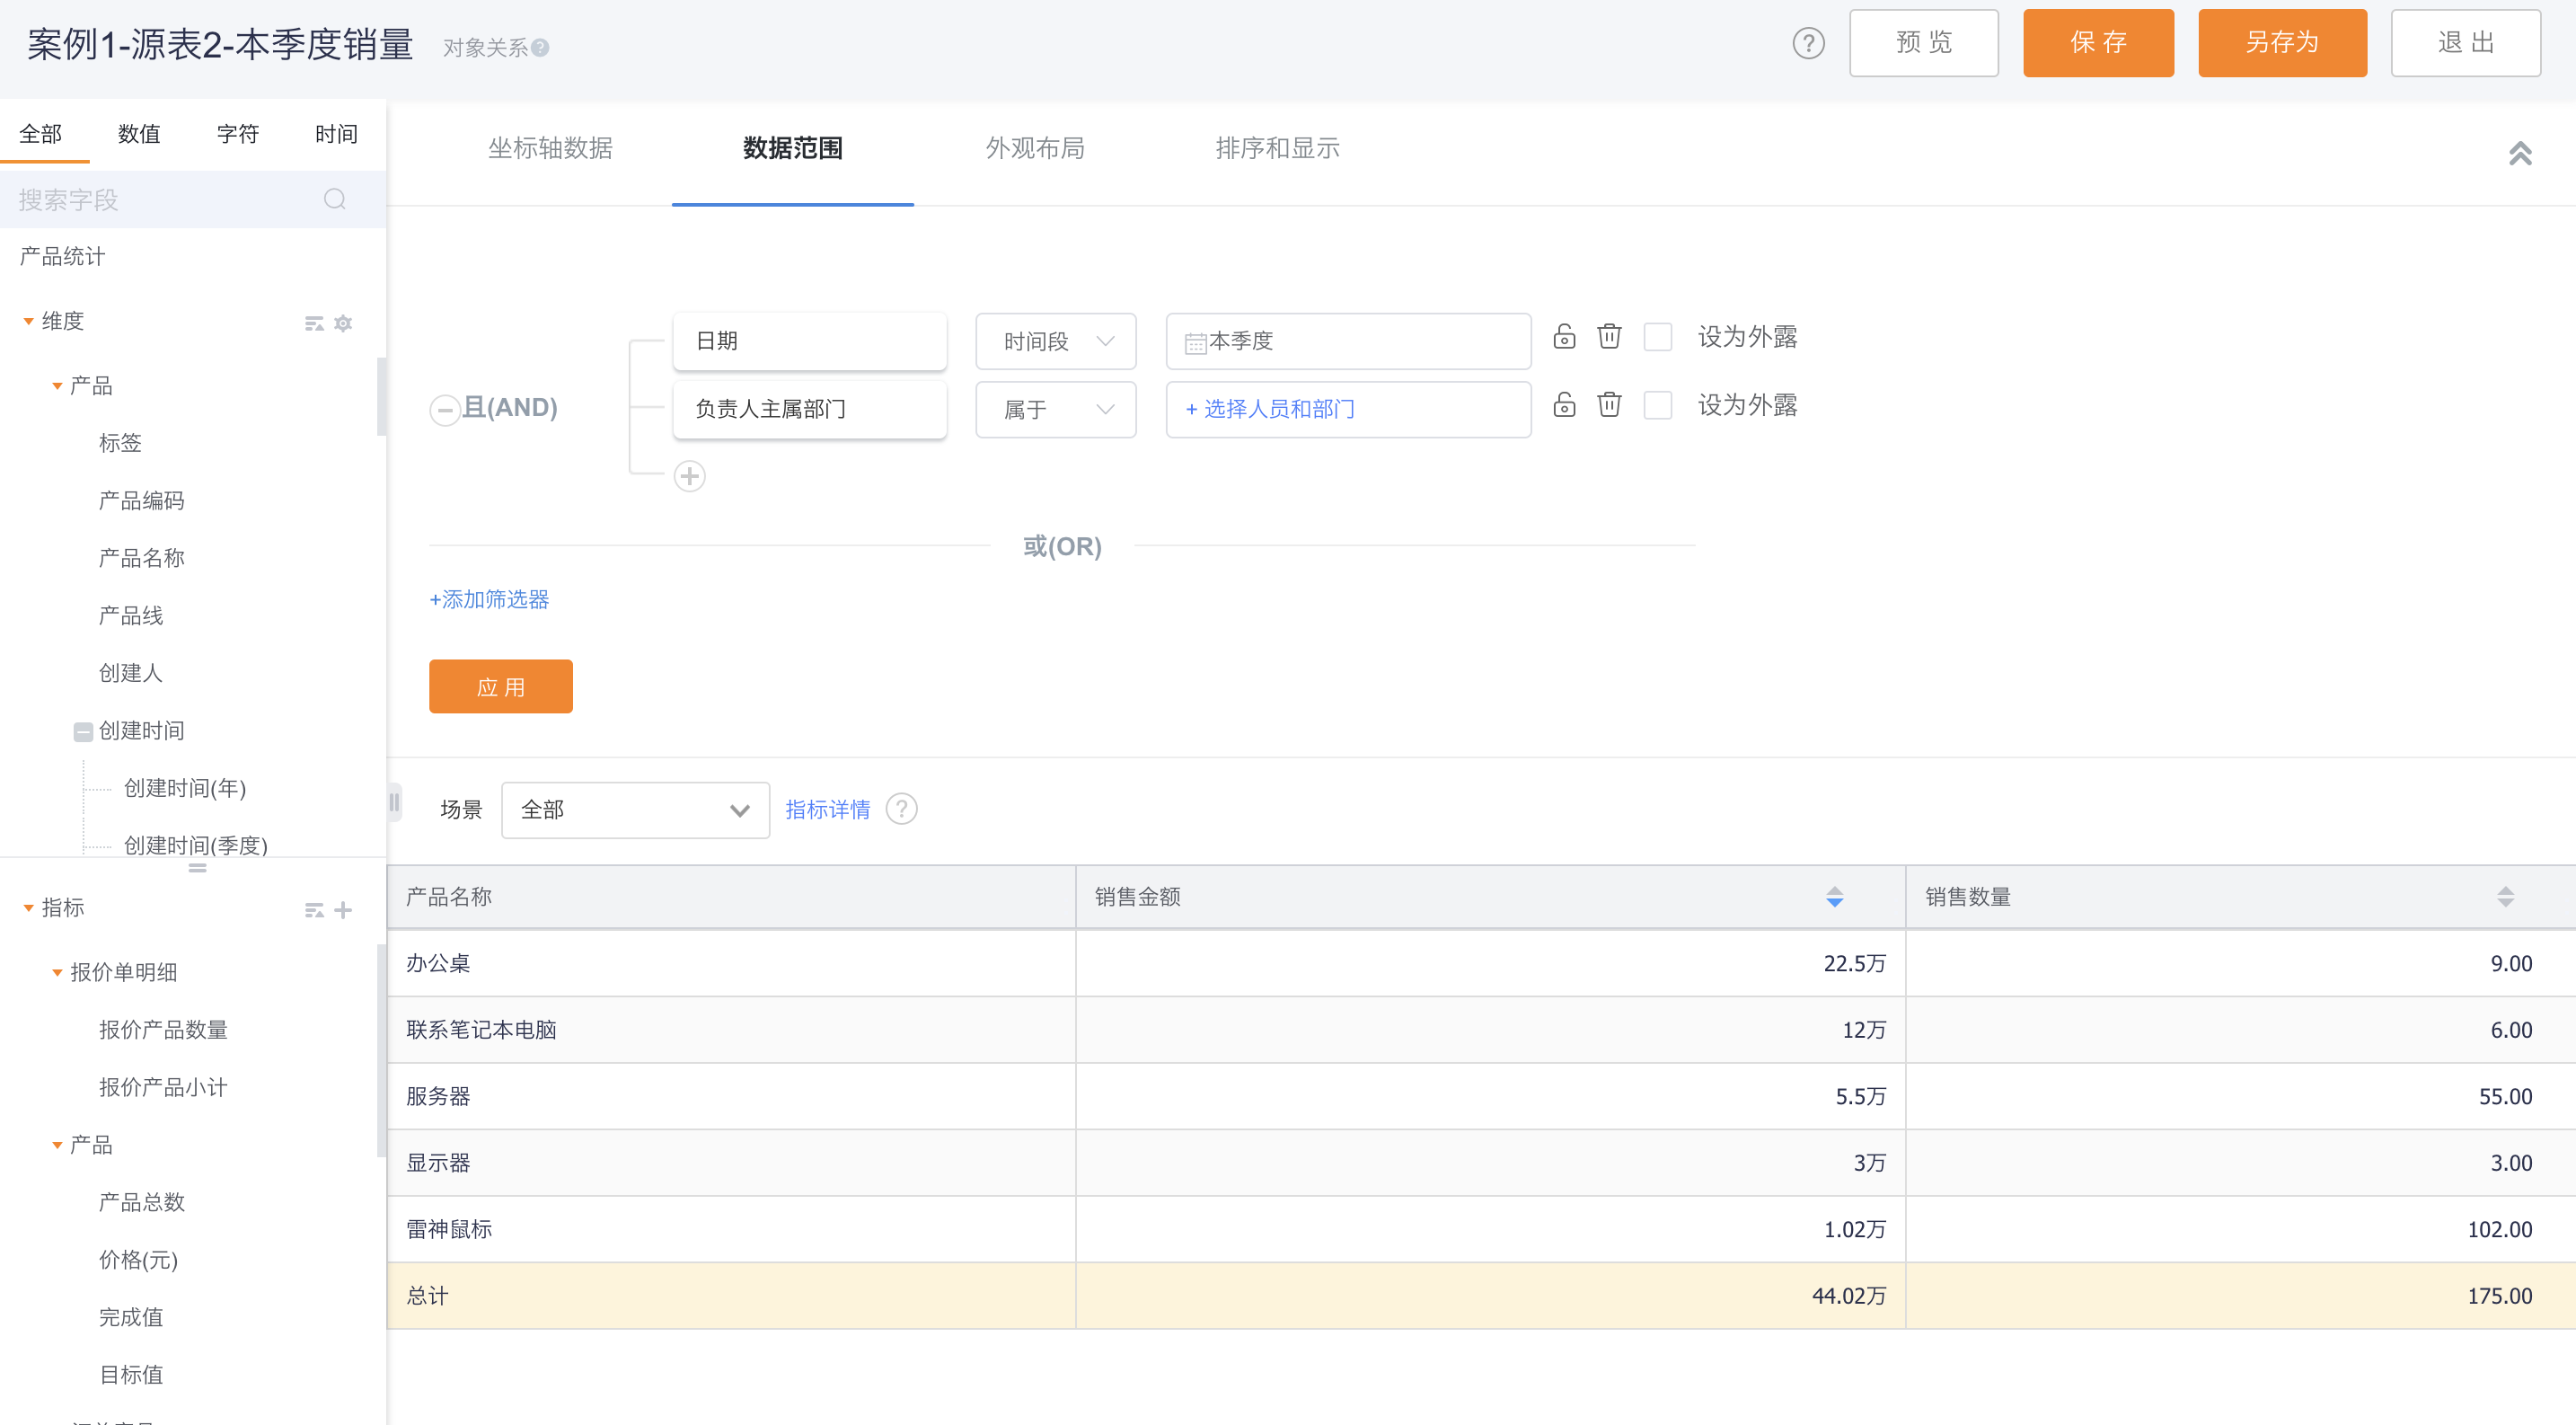
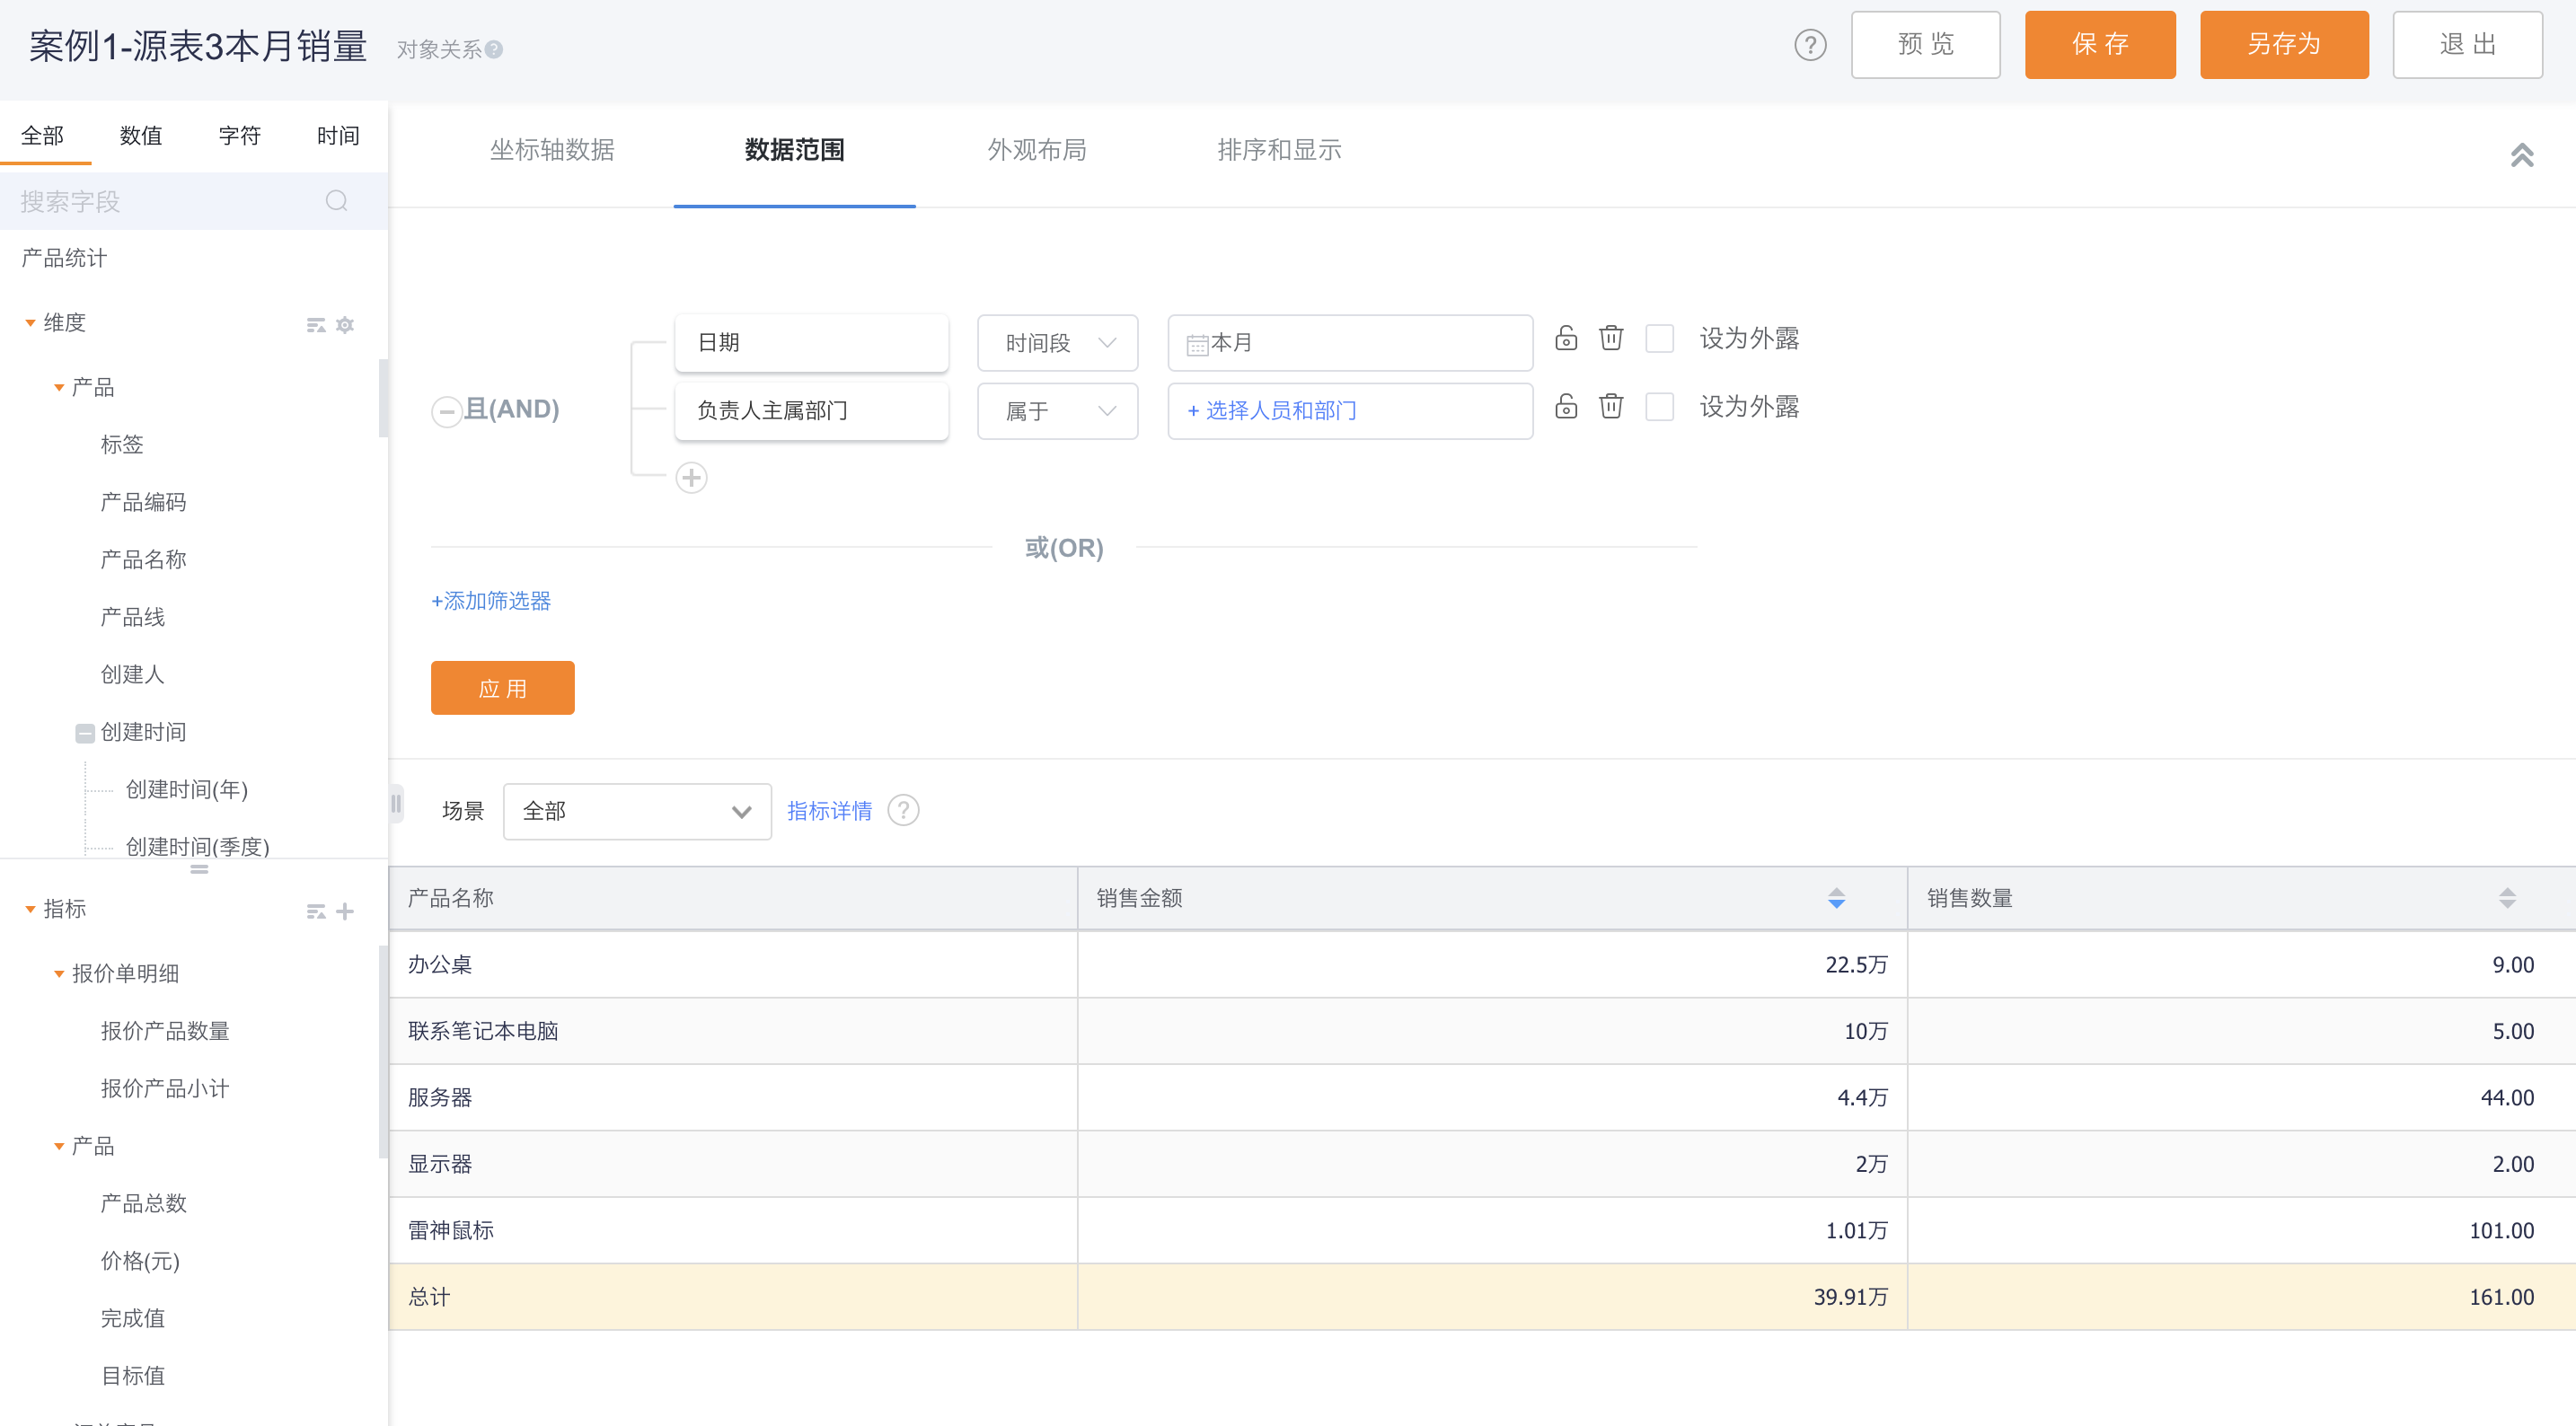
- Source Report Configuration: three similar statistical tables, the dimension is product name, the indicators are sales amount, sales quantity, the data range has the person in charge of the department, and the dates in the data range are respectively selected from this month, this quarter, this year;
1.1.1 Configuration Process
1.1.1.1 Select Source Report & Association Type
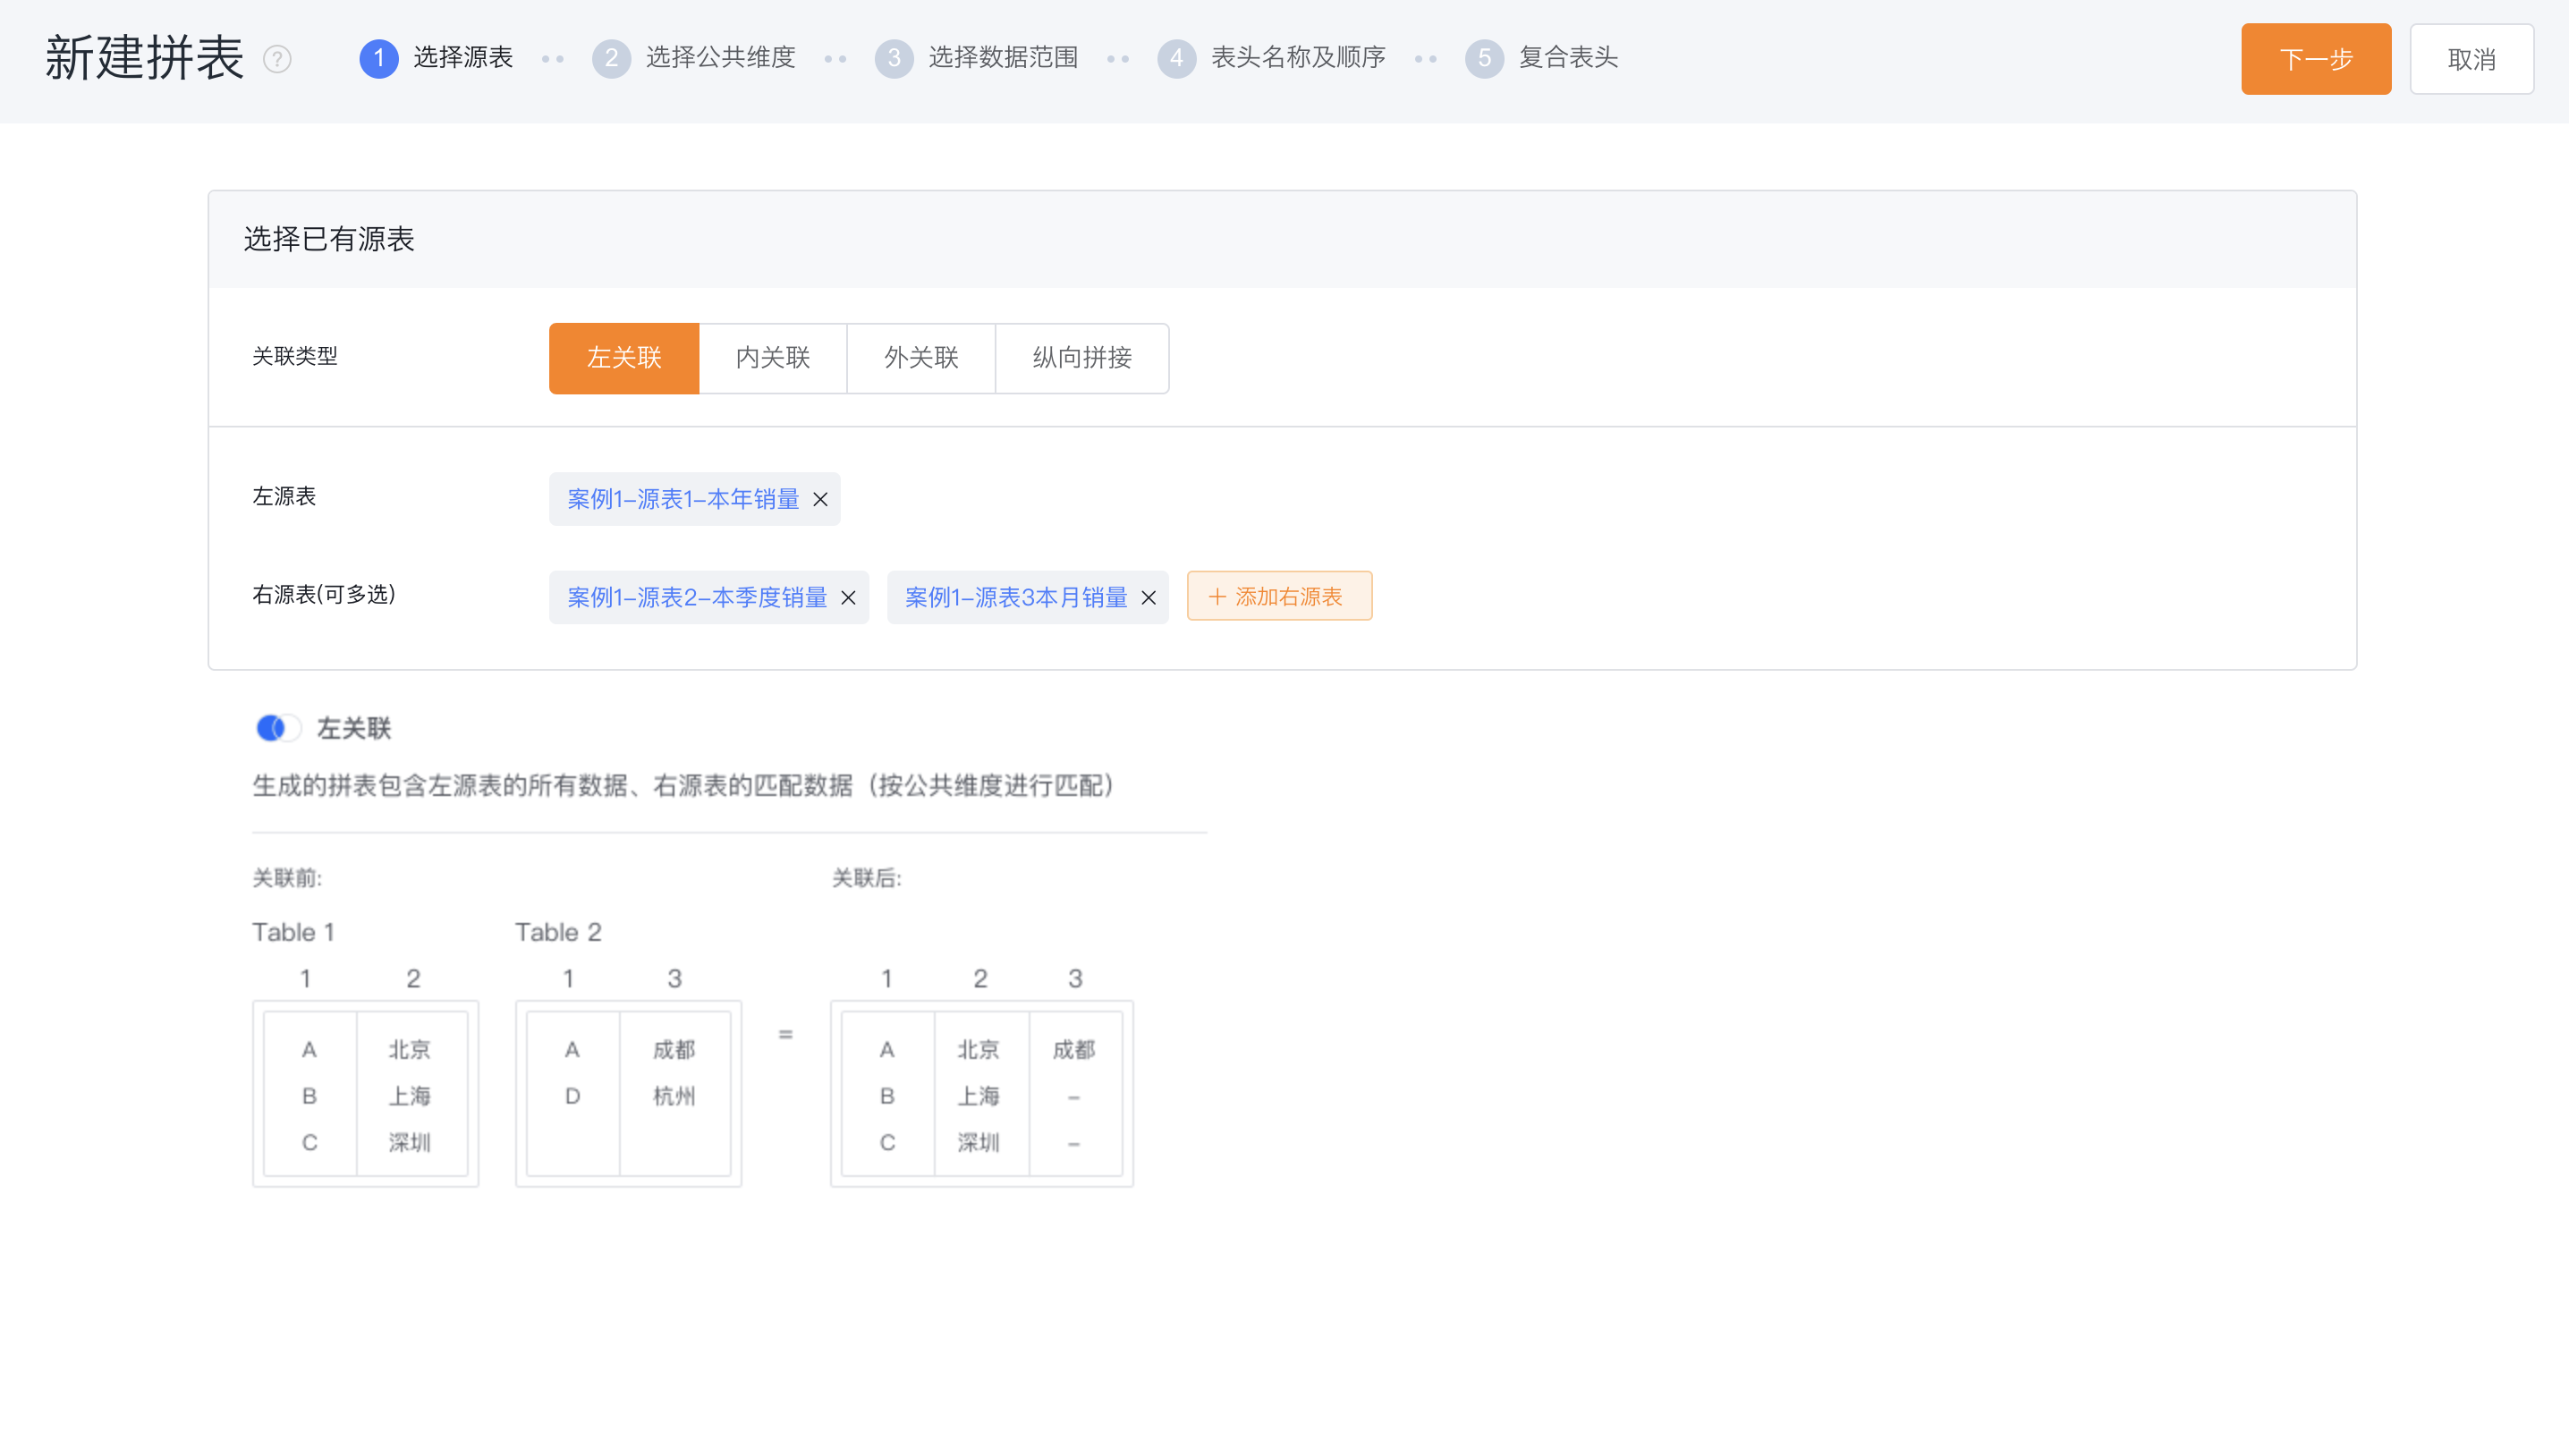
- Source Report: the basic report configured based on BI reports and statistical charts, as the source of joined report;
- Association Type: the splicing method of each source table when splicing tables
- 1 Left Association: left join, subject to the left source table;
- 2 Inner Association: inner join, take intersection;
- 3 Outer Association: outer join, take union;
- 4 Vertical Splicing: Merge of all data rows;
- Case Description: "Case 1-source report 1-this year's sales" table has the most data, the dimension value (product name) is the most complete, and the data of this quarter and this month will be included in it. In this case, it is recommended to use "left association". The table with the most complete dimension values is used as the left source table, and the rest are used as the right source table.
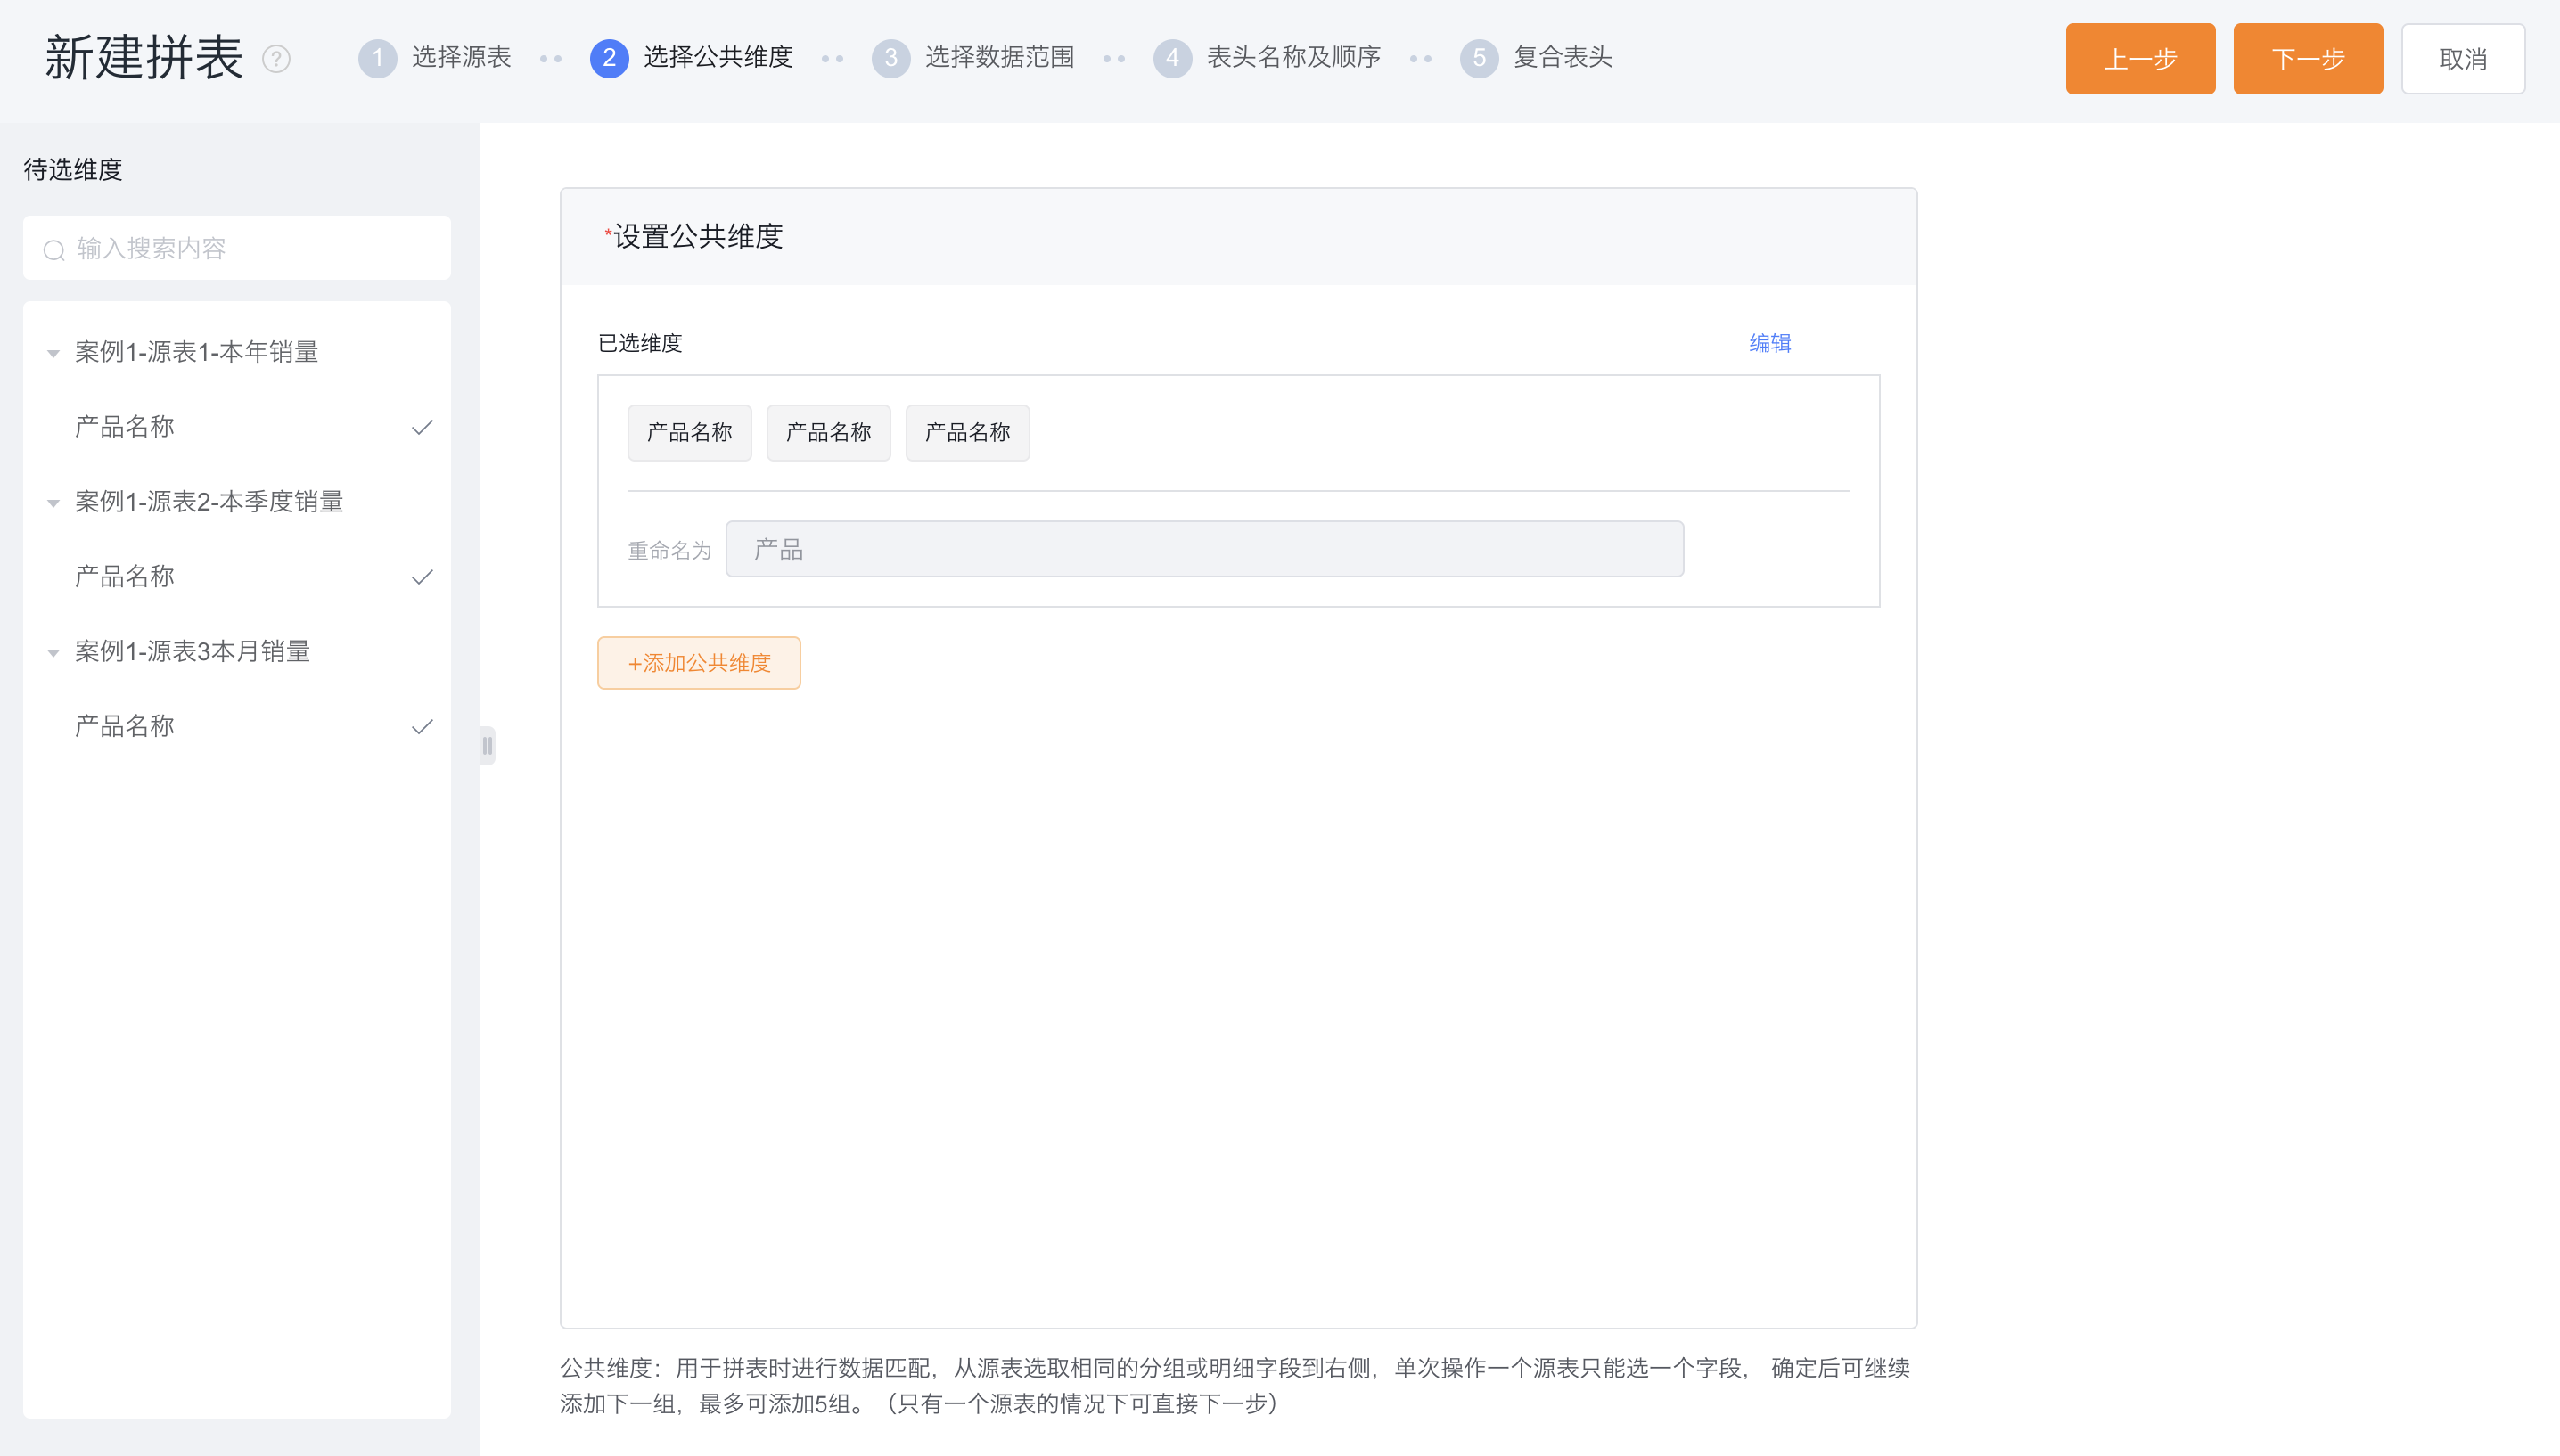
1.1.1.2 Select Public Dimension
- Public Dimension: As the basis for splicing multiple source tables, generally the grouping/dimension fields with the same meaning in each source table click on the fields with the same meaning in each source table and add them to the right to form a set of common dimensions, which will be used as the splicing table Grouping/dimension fields, displayed by renamed field names.
- Case Description: The dimension of the three tables is "product name", if you want to display it as "product": click "product name" in the source table 1, 2, 3, add it to the public dimension on the right, and rename it to : "Product", click OK.
1.1.1.3 Select Data Range
- Add Merged Data Range: the common data range of each source report is similar to the public dimension, click on the left to add to the right as a group. Clicking "Merge" means that it will eventually be merged into one filter condition to be used in the data range of the stitching table, and displayed according to the renamed field name. The default values for the filter can also be modified here.
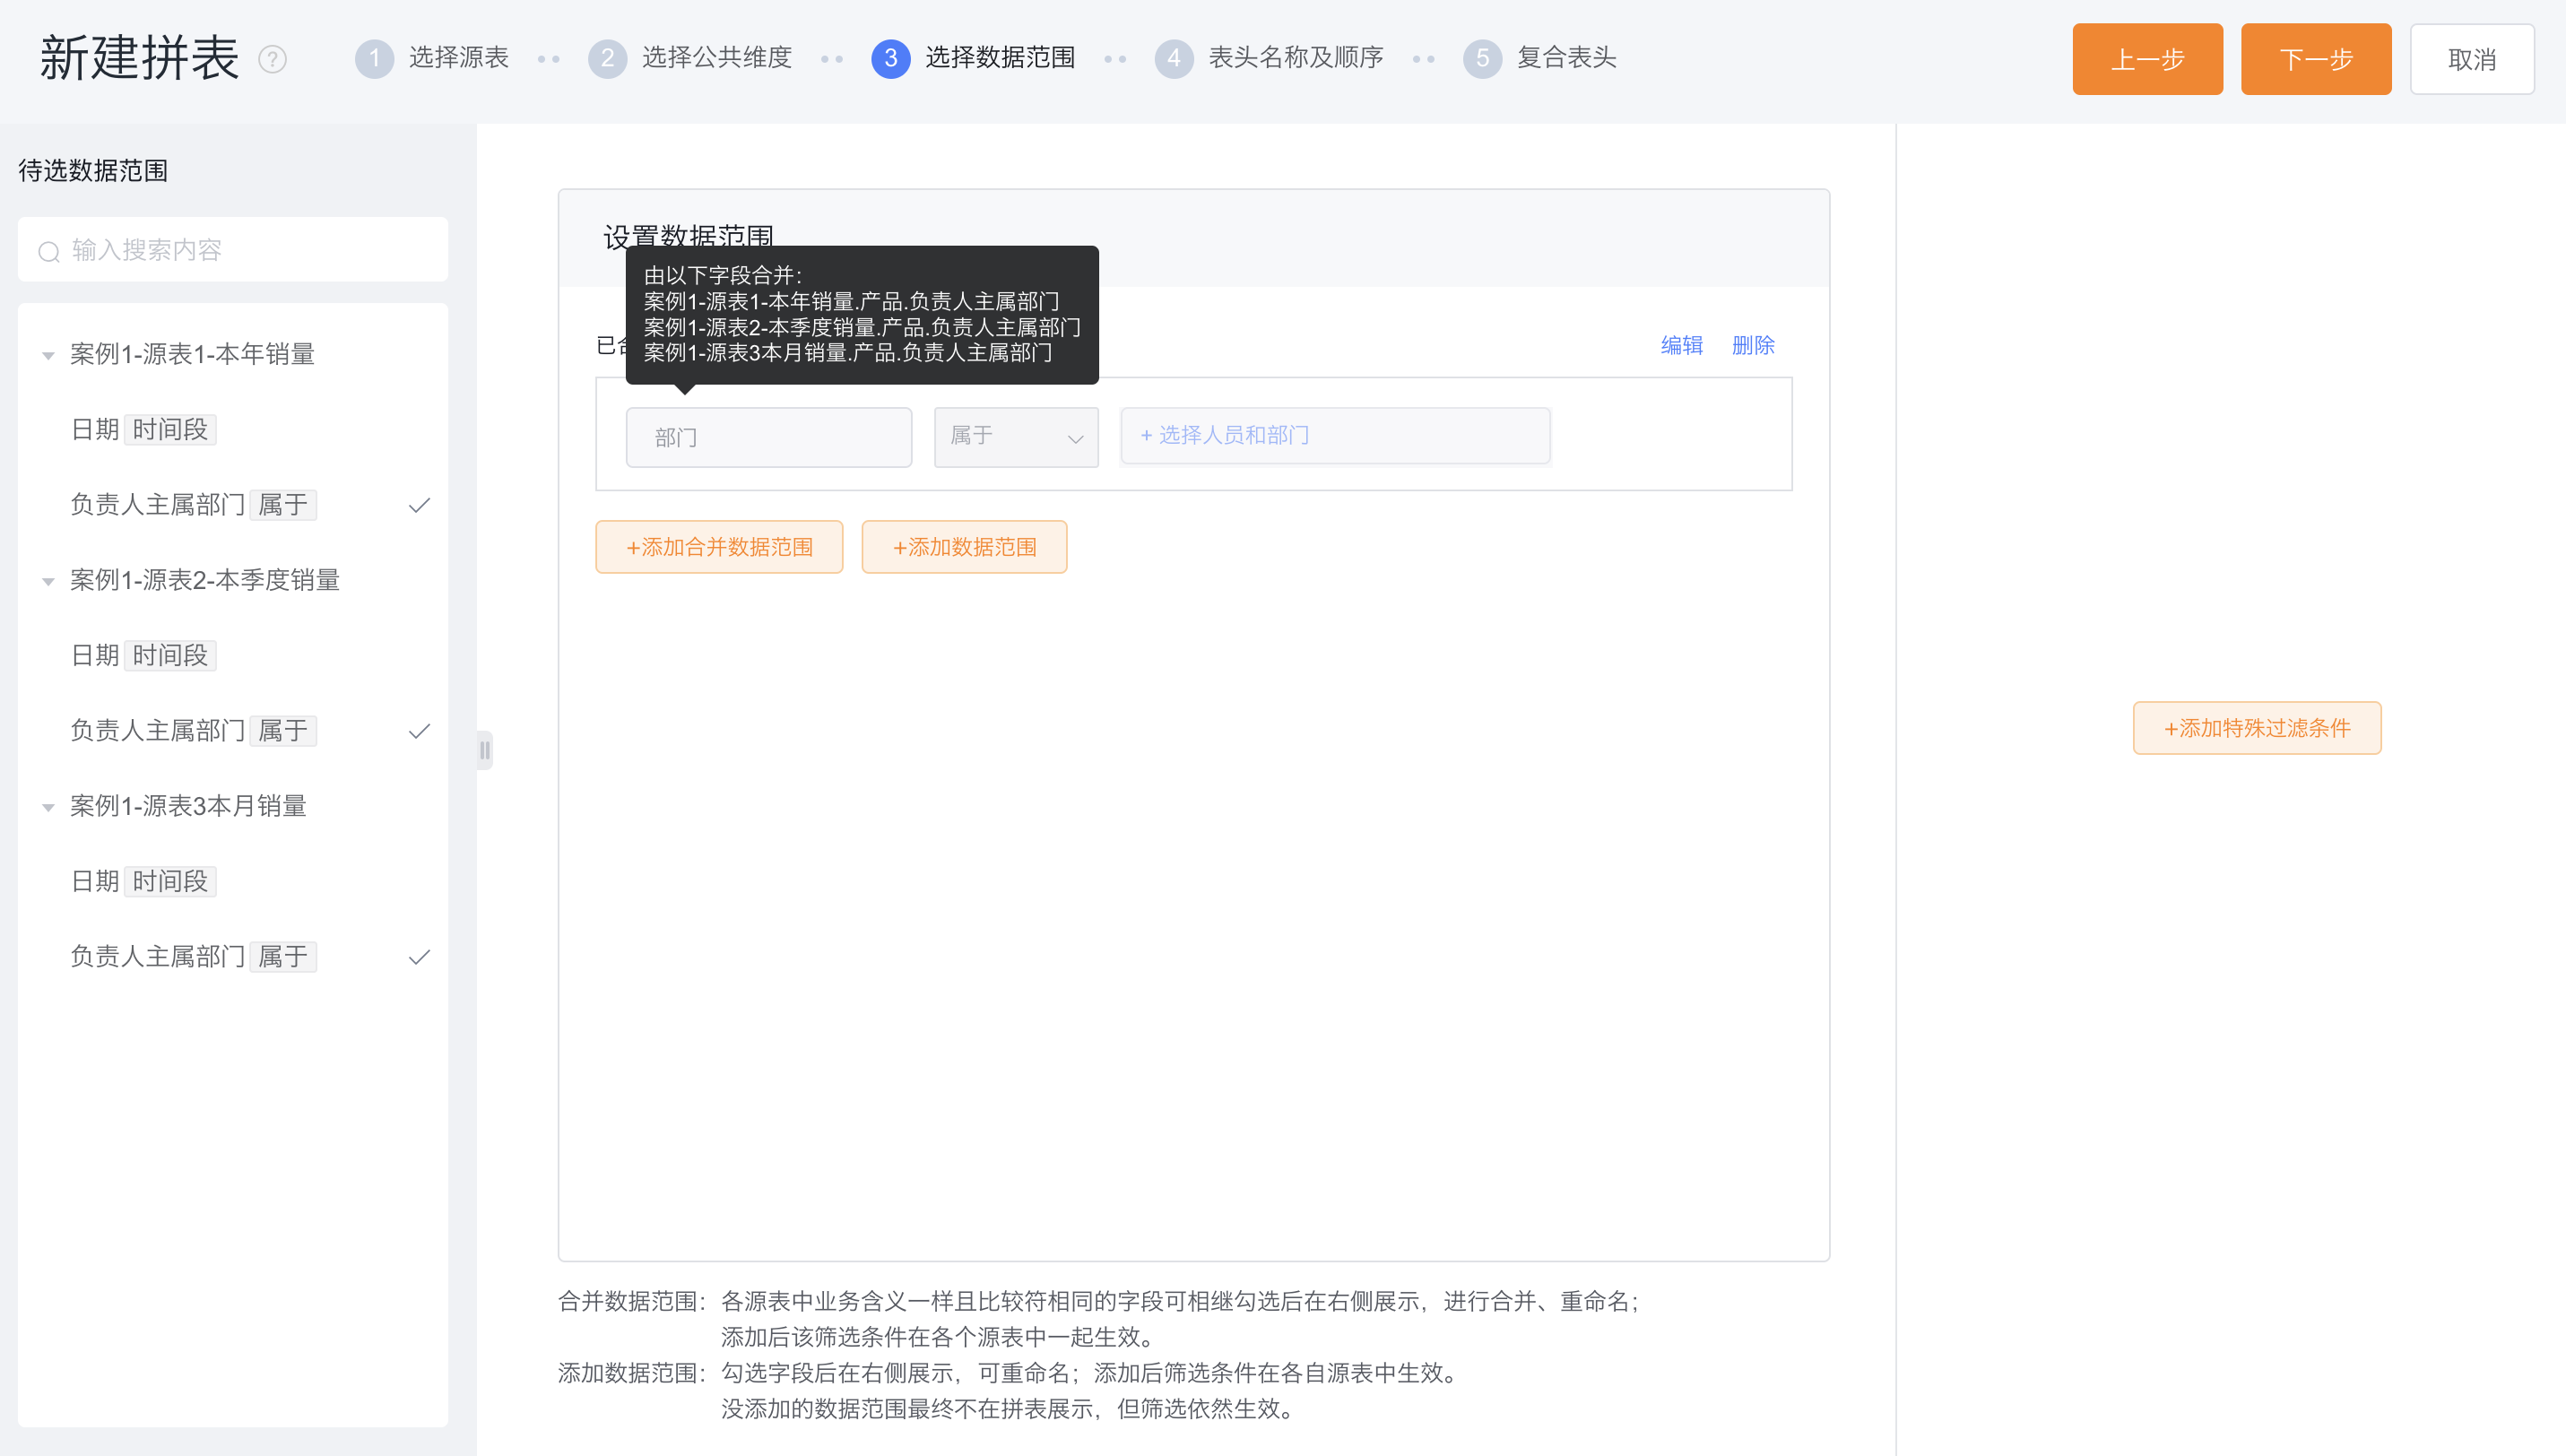
- Add Data Range: In addition to the public data range, other filter conditions, which need to be exposed in the data range after the table is assembled. Filter conditions that have not been added will not be displayed in the data range of the combined table, and will work according to the default configuration of the source table.
- Case Description: When the main department of the person in charge is used as the public data range after the table is merged and renamed as "department" to filter, it will work on the 3 source tables at the same time. None of the date filters are displayed, and the data is filtered by this year, this quarter, and this month according to the configuration of the source table.
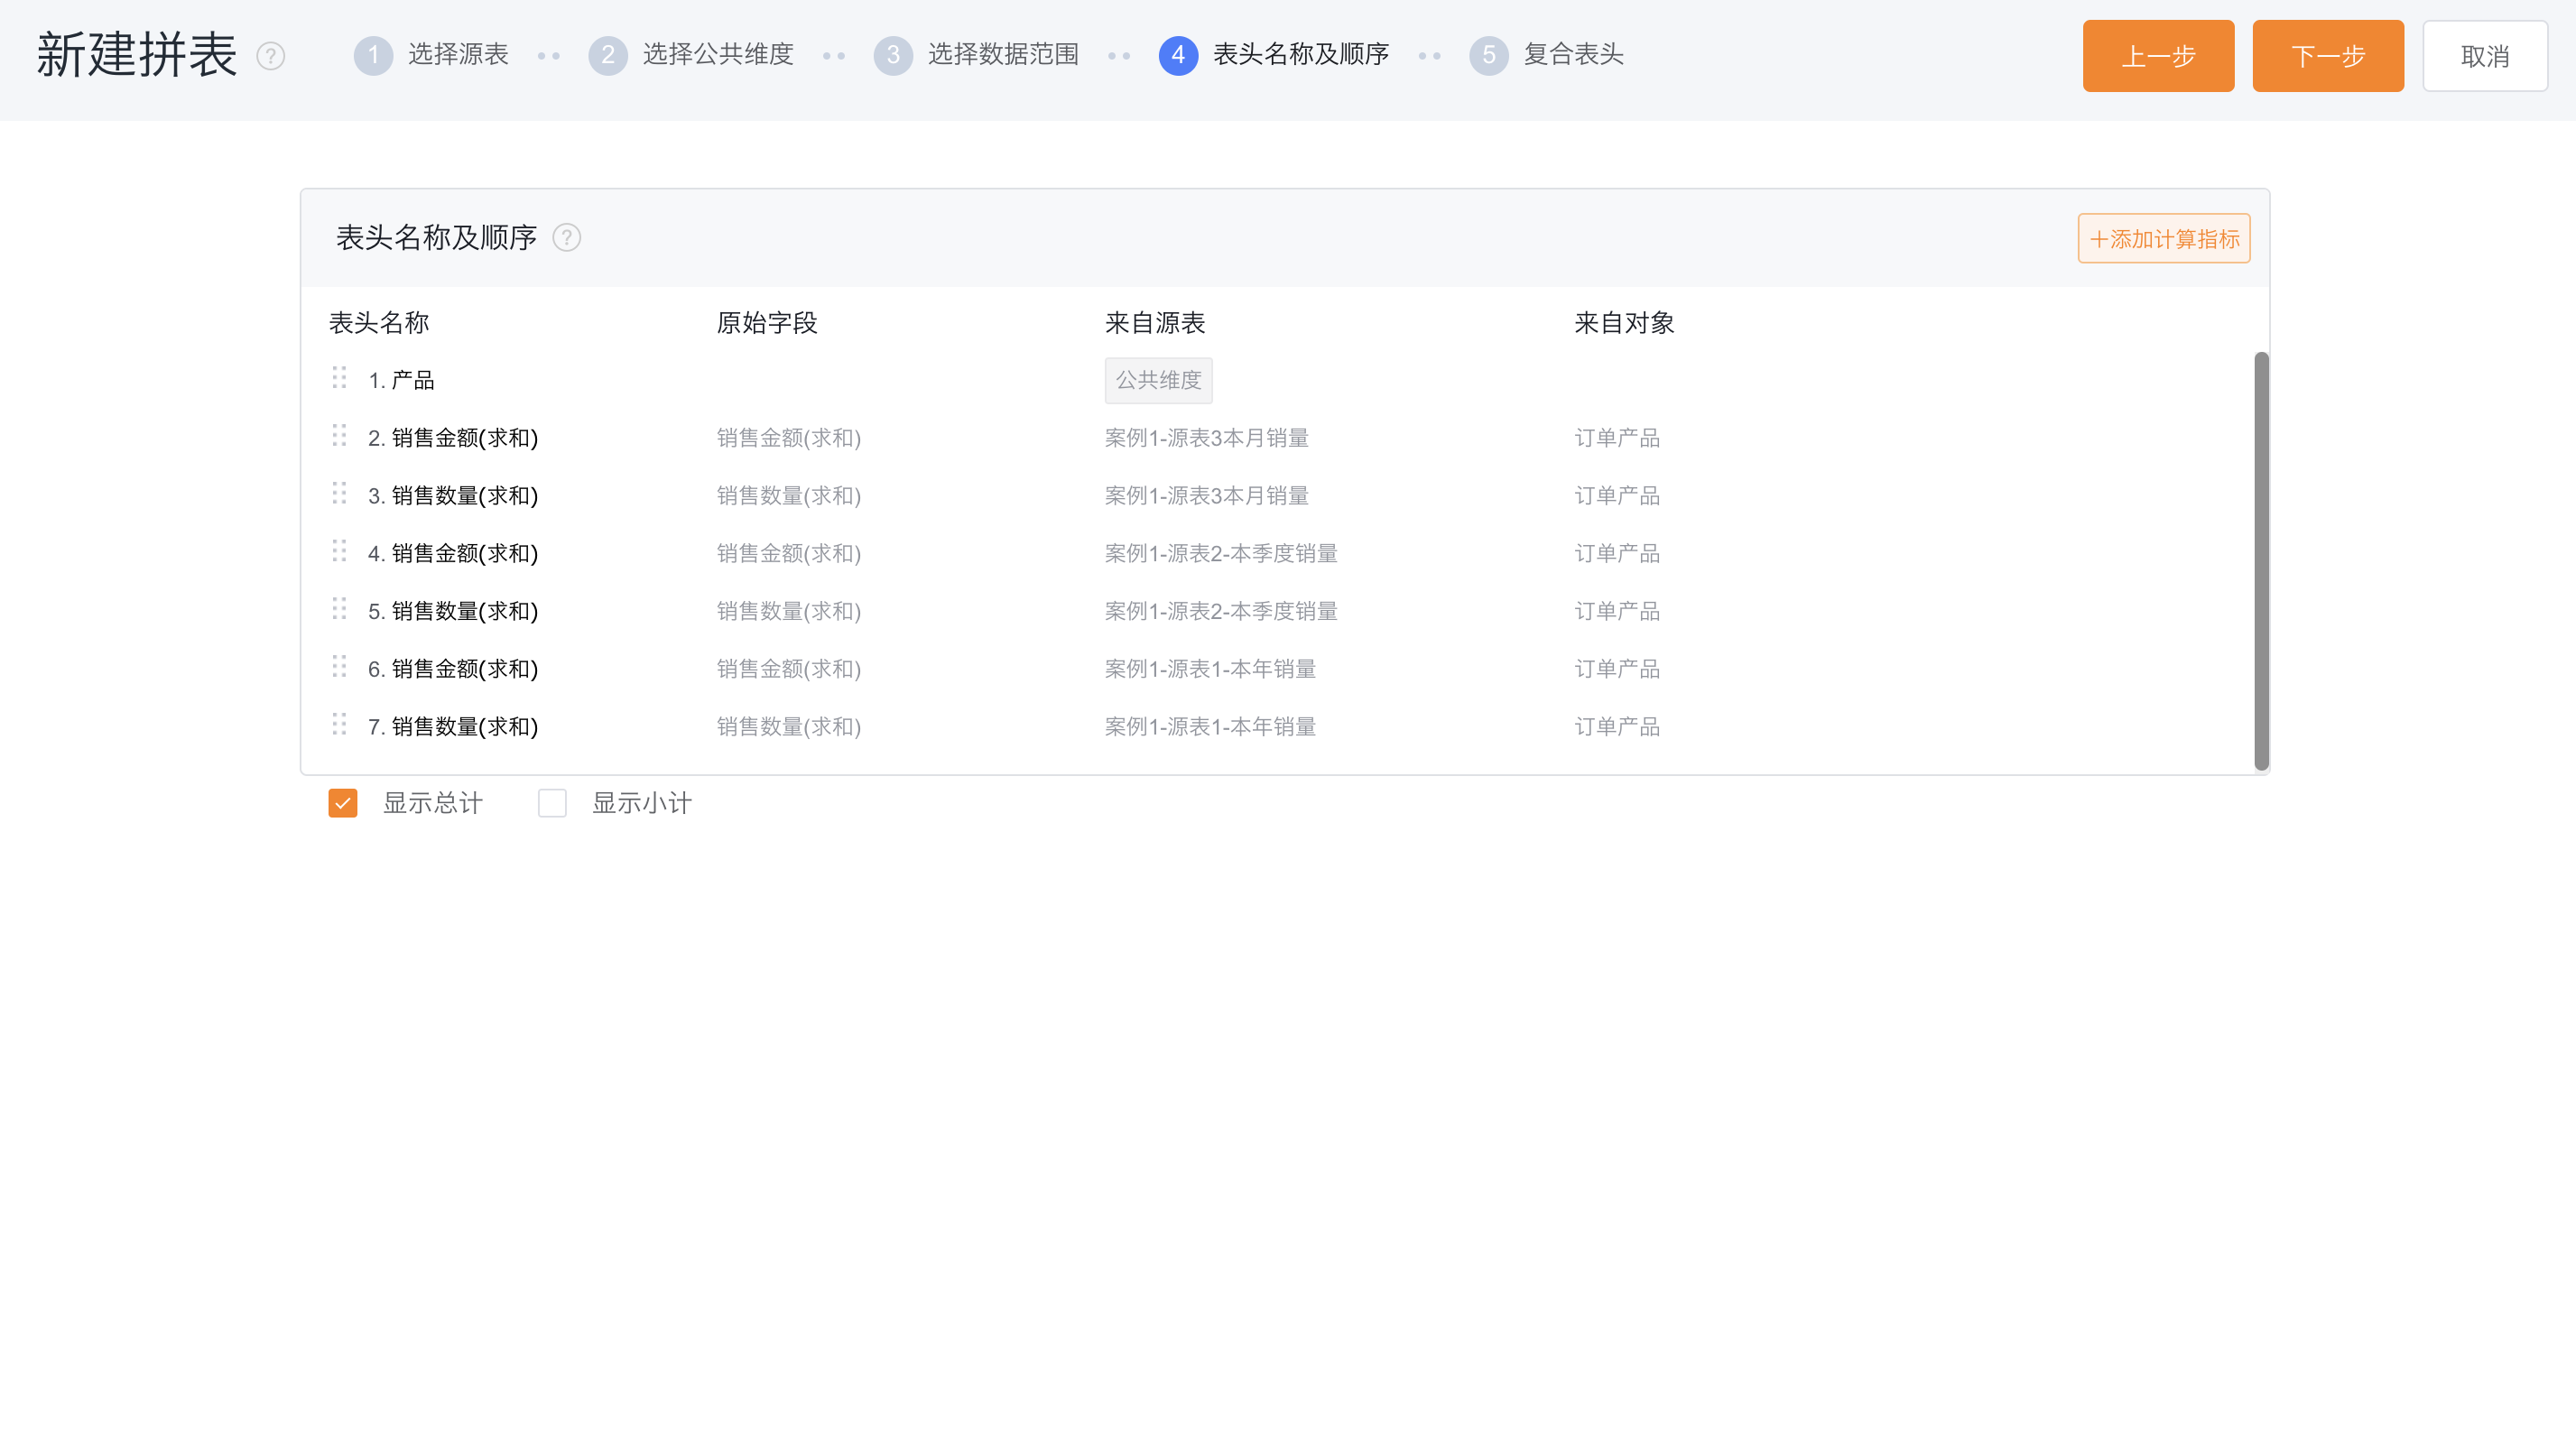
1.1.1.4 Header Name & Order
- Header Name: The field name of the public dimension is displayed according to the setting in the second step, which cannot be modified here, and other field names can be modified as required.
- Adjust Order: Drag and drop to adjust the order of the columns, where the common dimension must be at the front and cannot be adjusted.
- Add & Hide Columns: You can add calculated indicators as new columns; you can hide columns that don't need to be displayed in the spelling table.
- Case Description: Adjust the order of the columns to display in the order of monthly, quarterly, and yearly. Check Show Total, and there will be a total row at the end of the list.
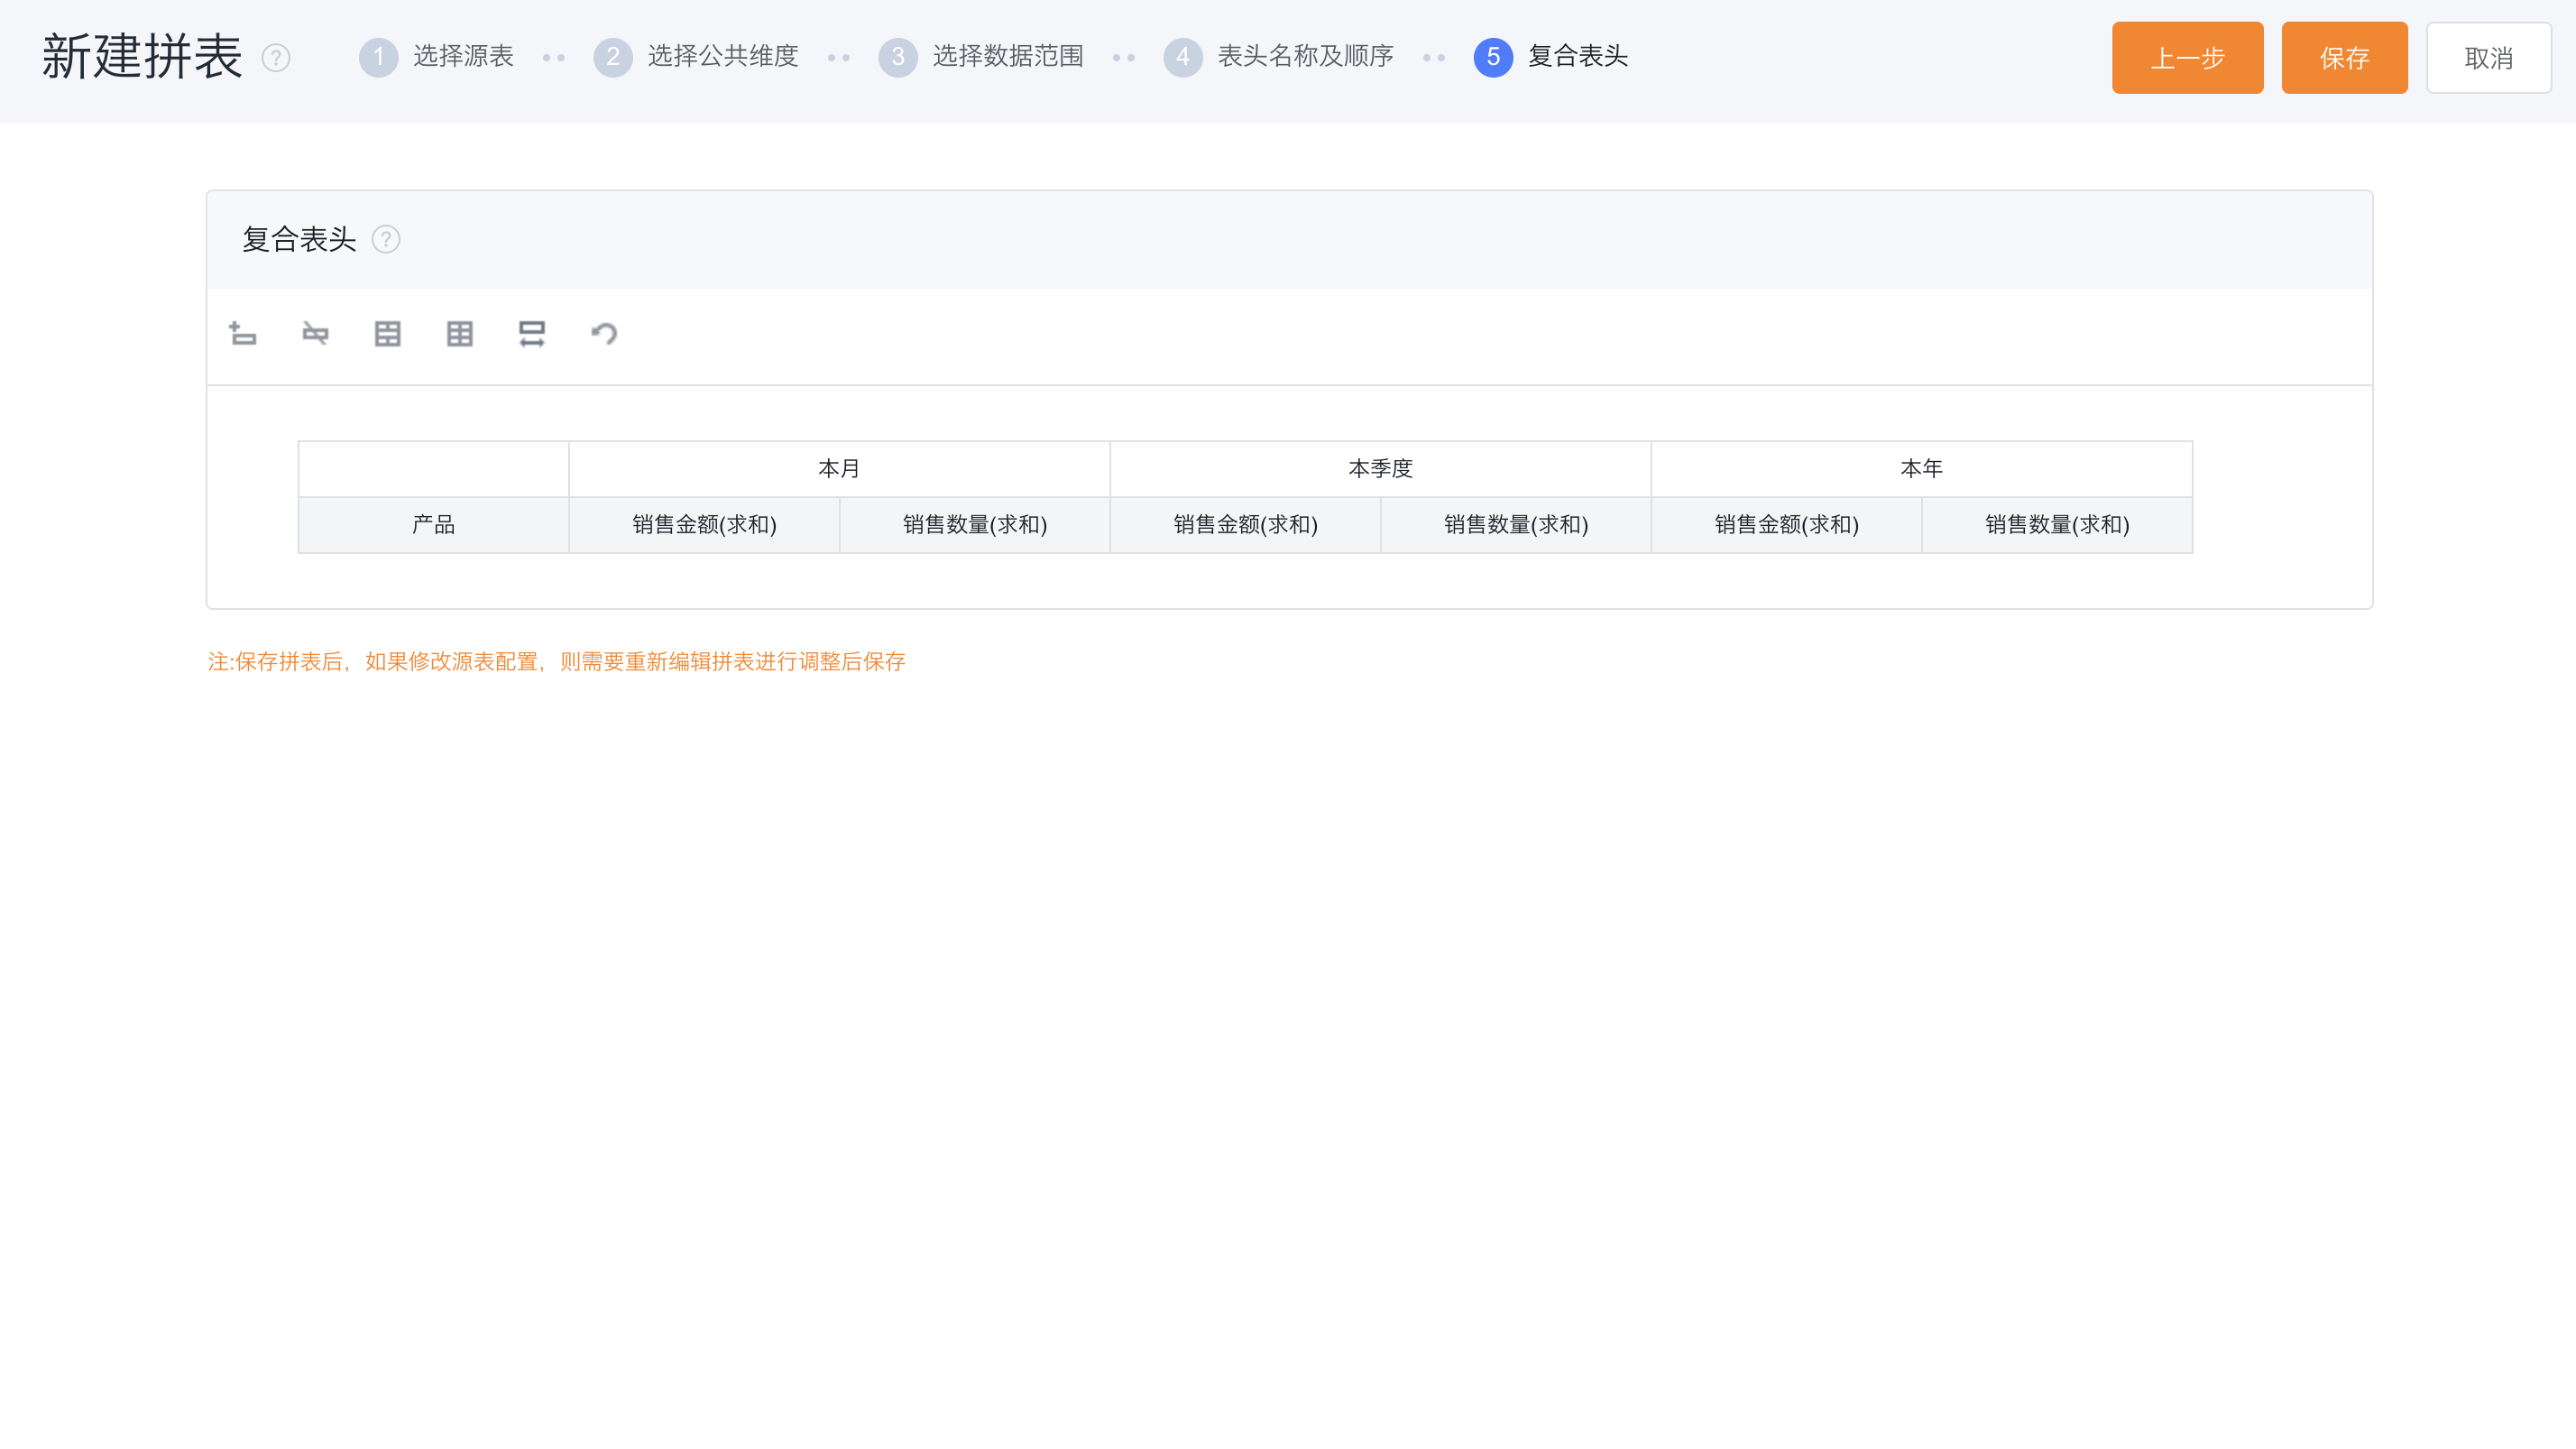
1.1.1.5 Composite Header
-
Composite Header: Display the title and order of the headers adjusted in the previous step, and add multiple layers of composite headers to the top.
-
Actions:
Add Row: add a new row above; Delete Row: delete the selected row; Merge Cells: Merge multiple cells in the mouse circle; Split Cell: split the merged cell back to the original cell; Compact Mode: compact mode can be set; Back: Go back to the previous step; Modify Column Width: Click the original header to modify the column width; Modify Display Name: Click the added grid to modify the display name; -
Case Description: Add a line above, merge the cells separately, and divide the table header into this month, this quarter, and this year's merged table headers according to the time granularity.
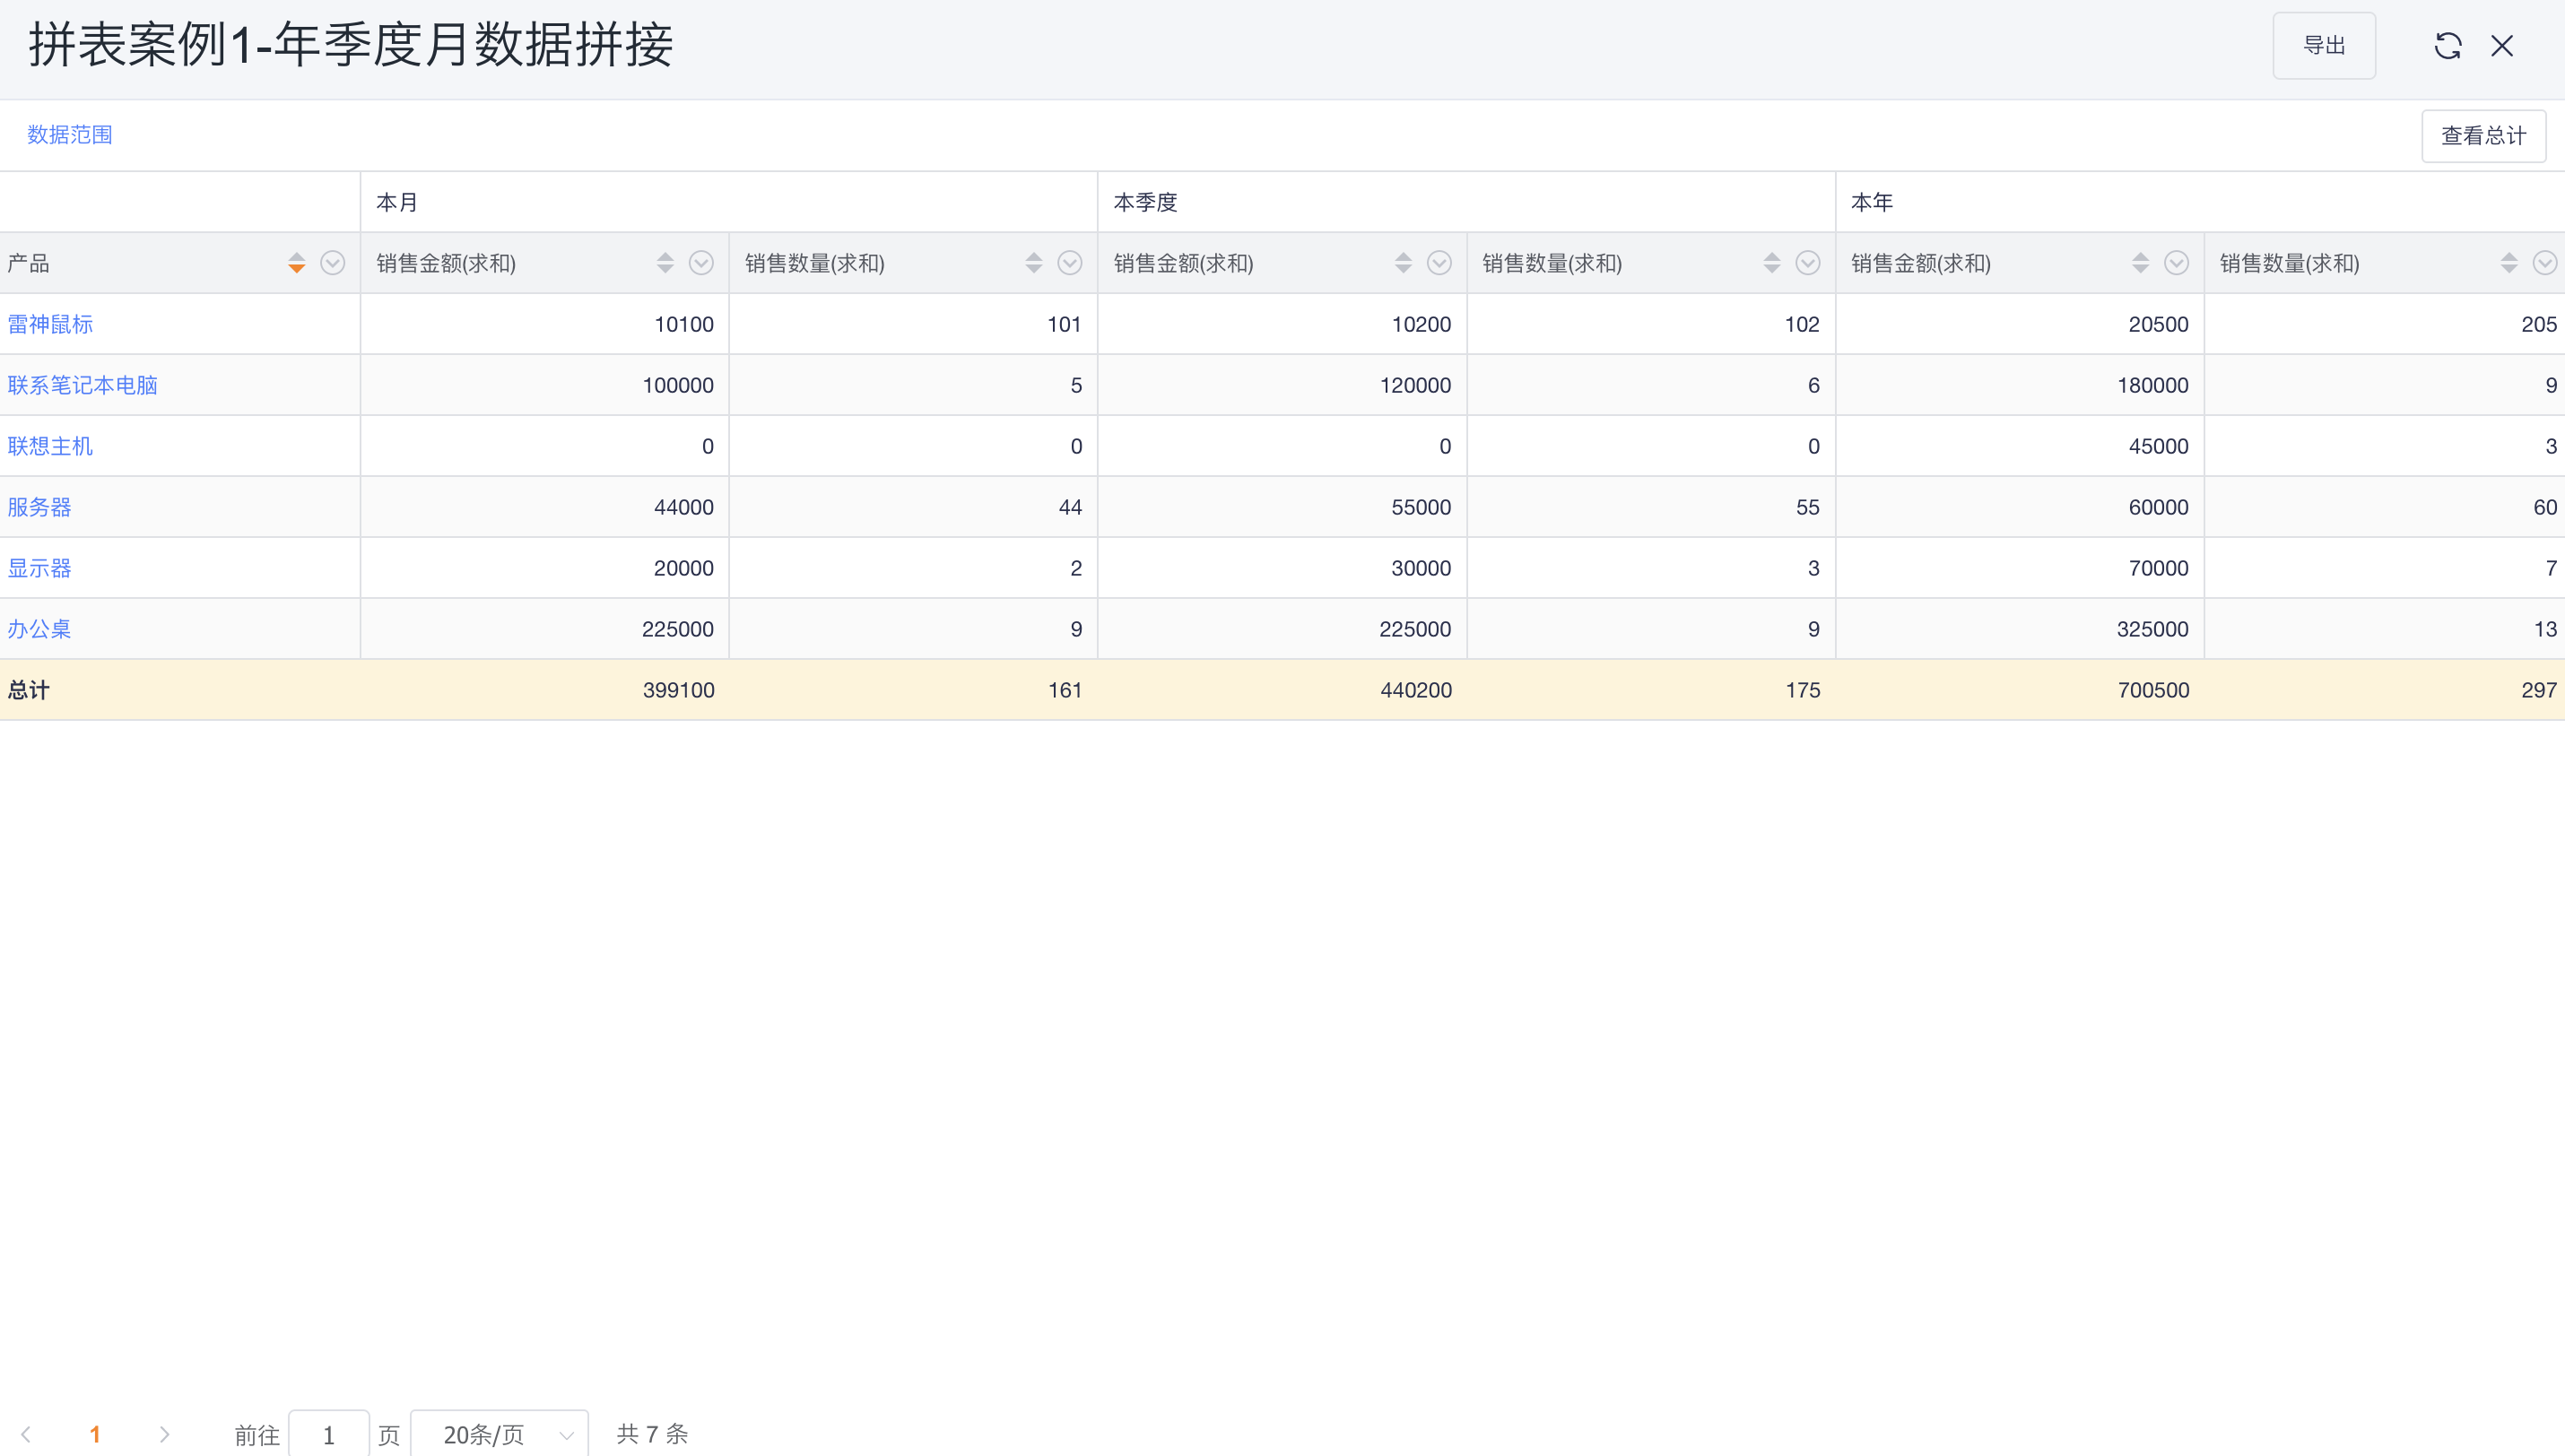
1.1.2 Joined Report Results
1.2 Case 2: Splicing of Different Rule Settings
- Core Requirements: look at the completion of different target rules together, and comprehensively calculate KPI: account visit weight 20%, account order weight 30%, account payment weight 50%.
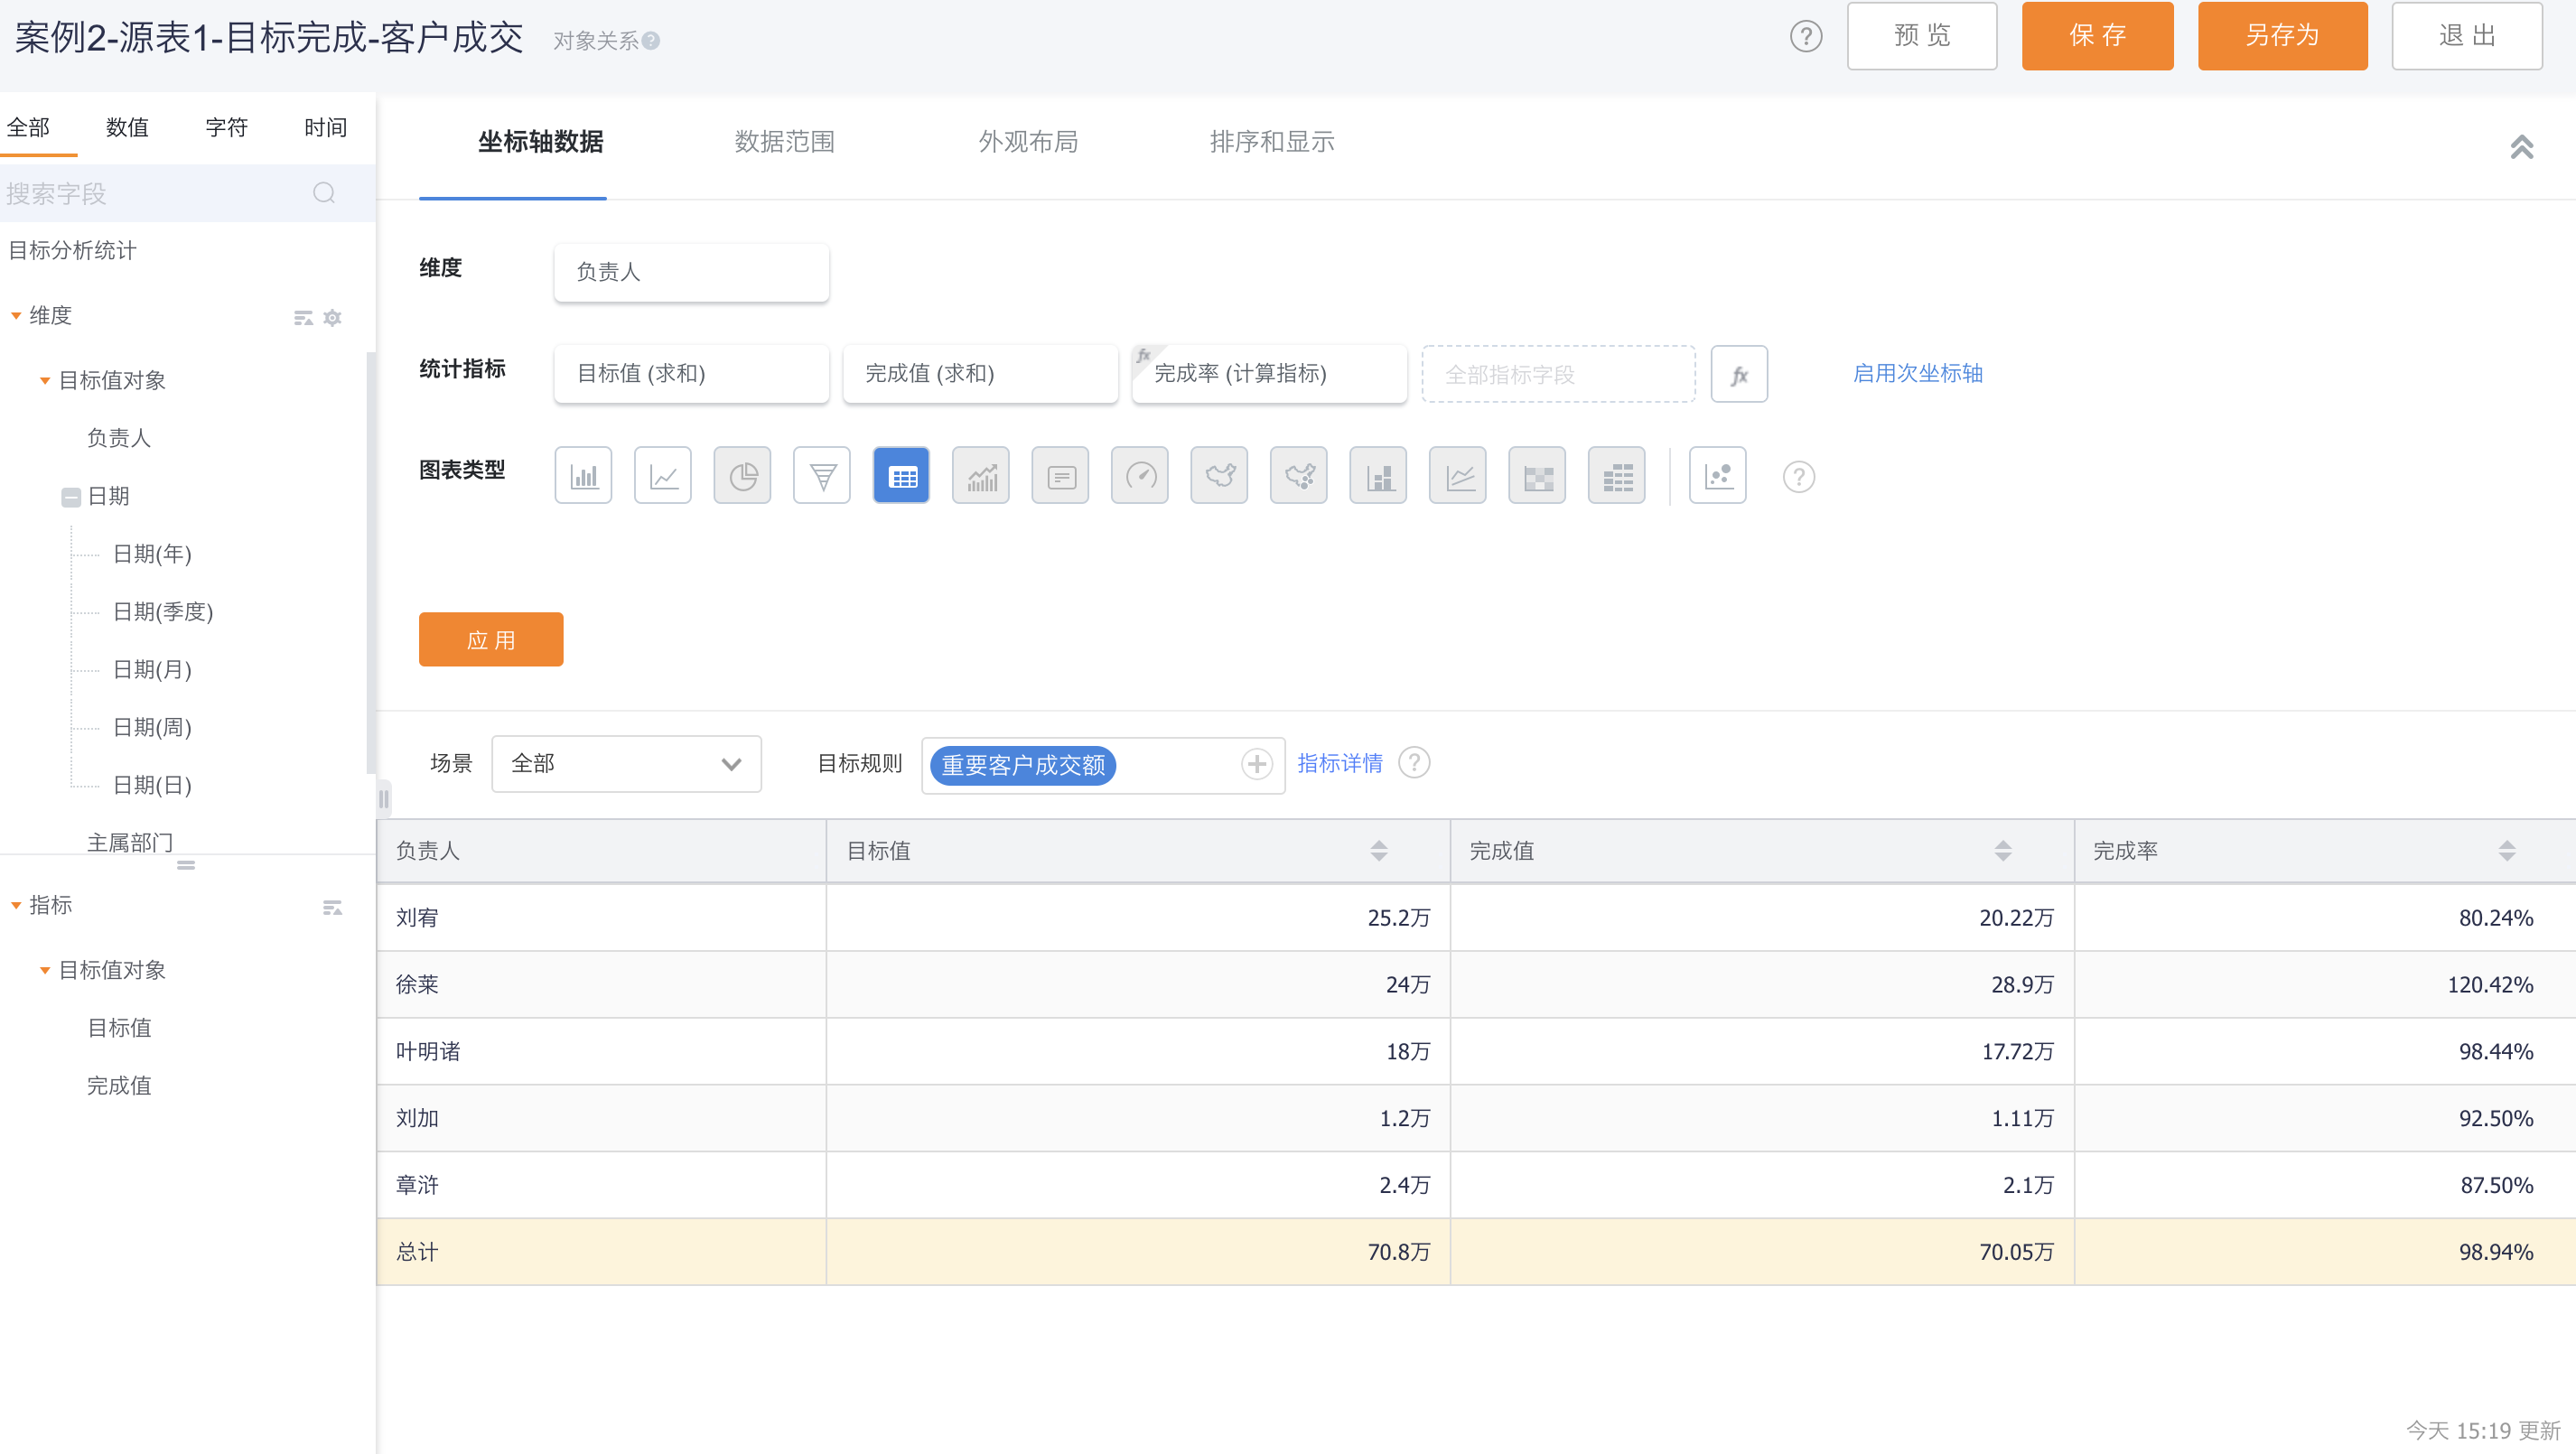
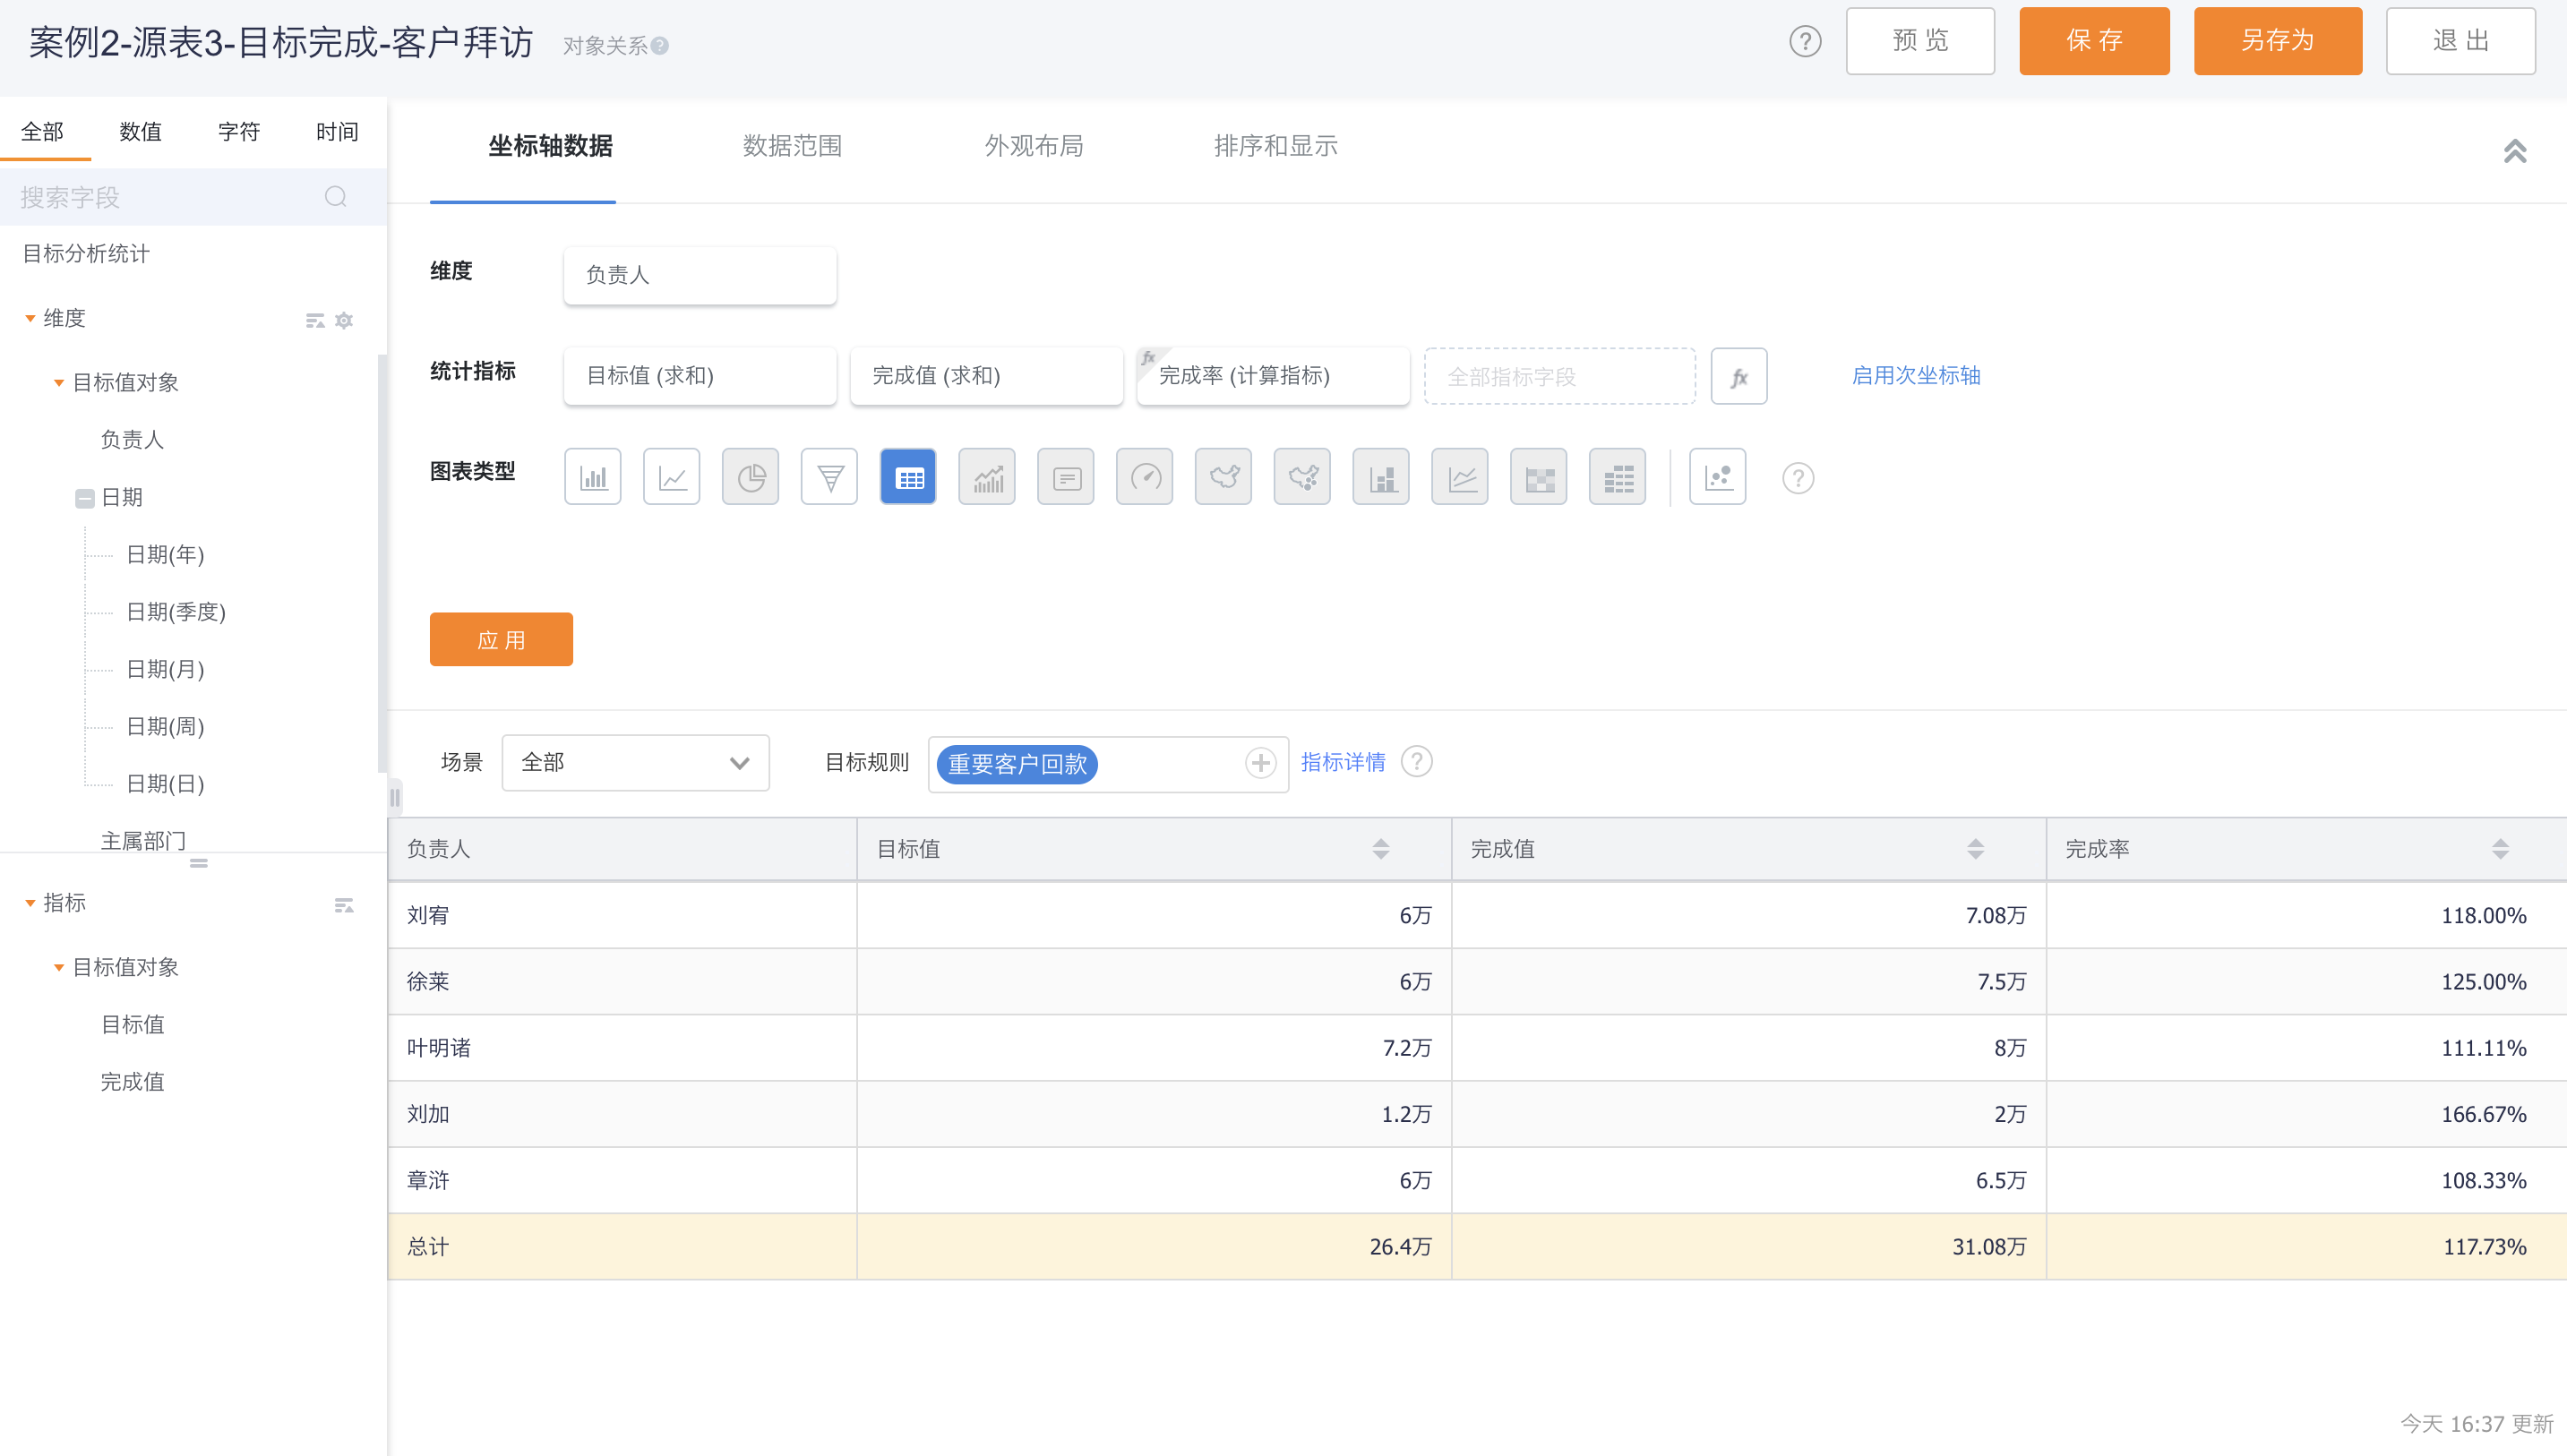
- Source Report Configuration: three target charts with different rule settings

1.2.1 Configuration Process
1.2.1.1 Select Source Report & Association Type
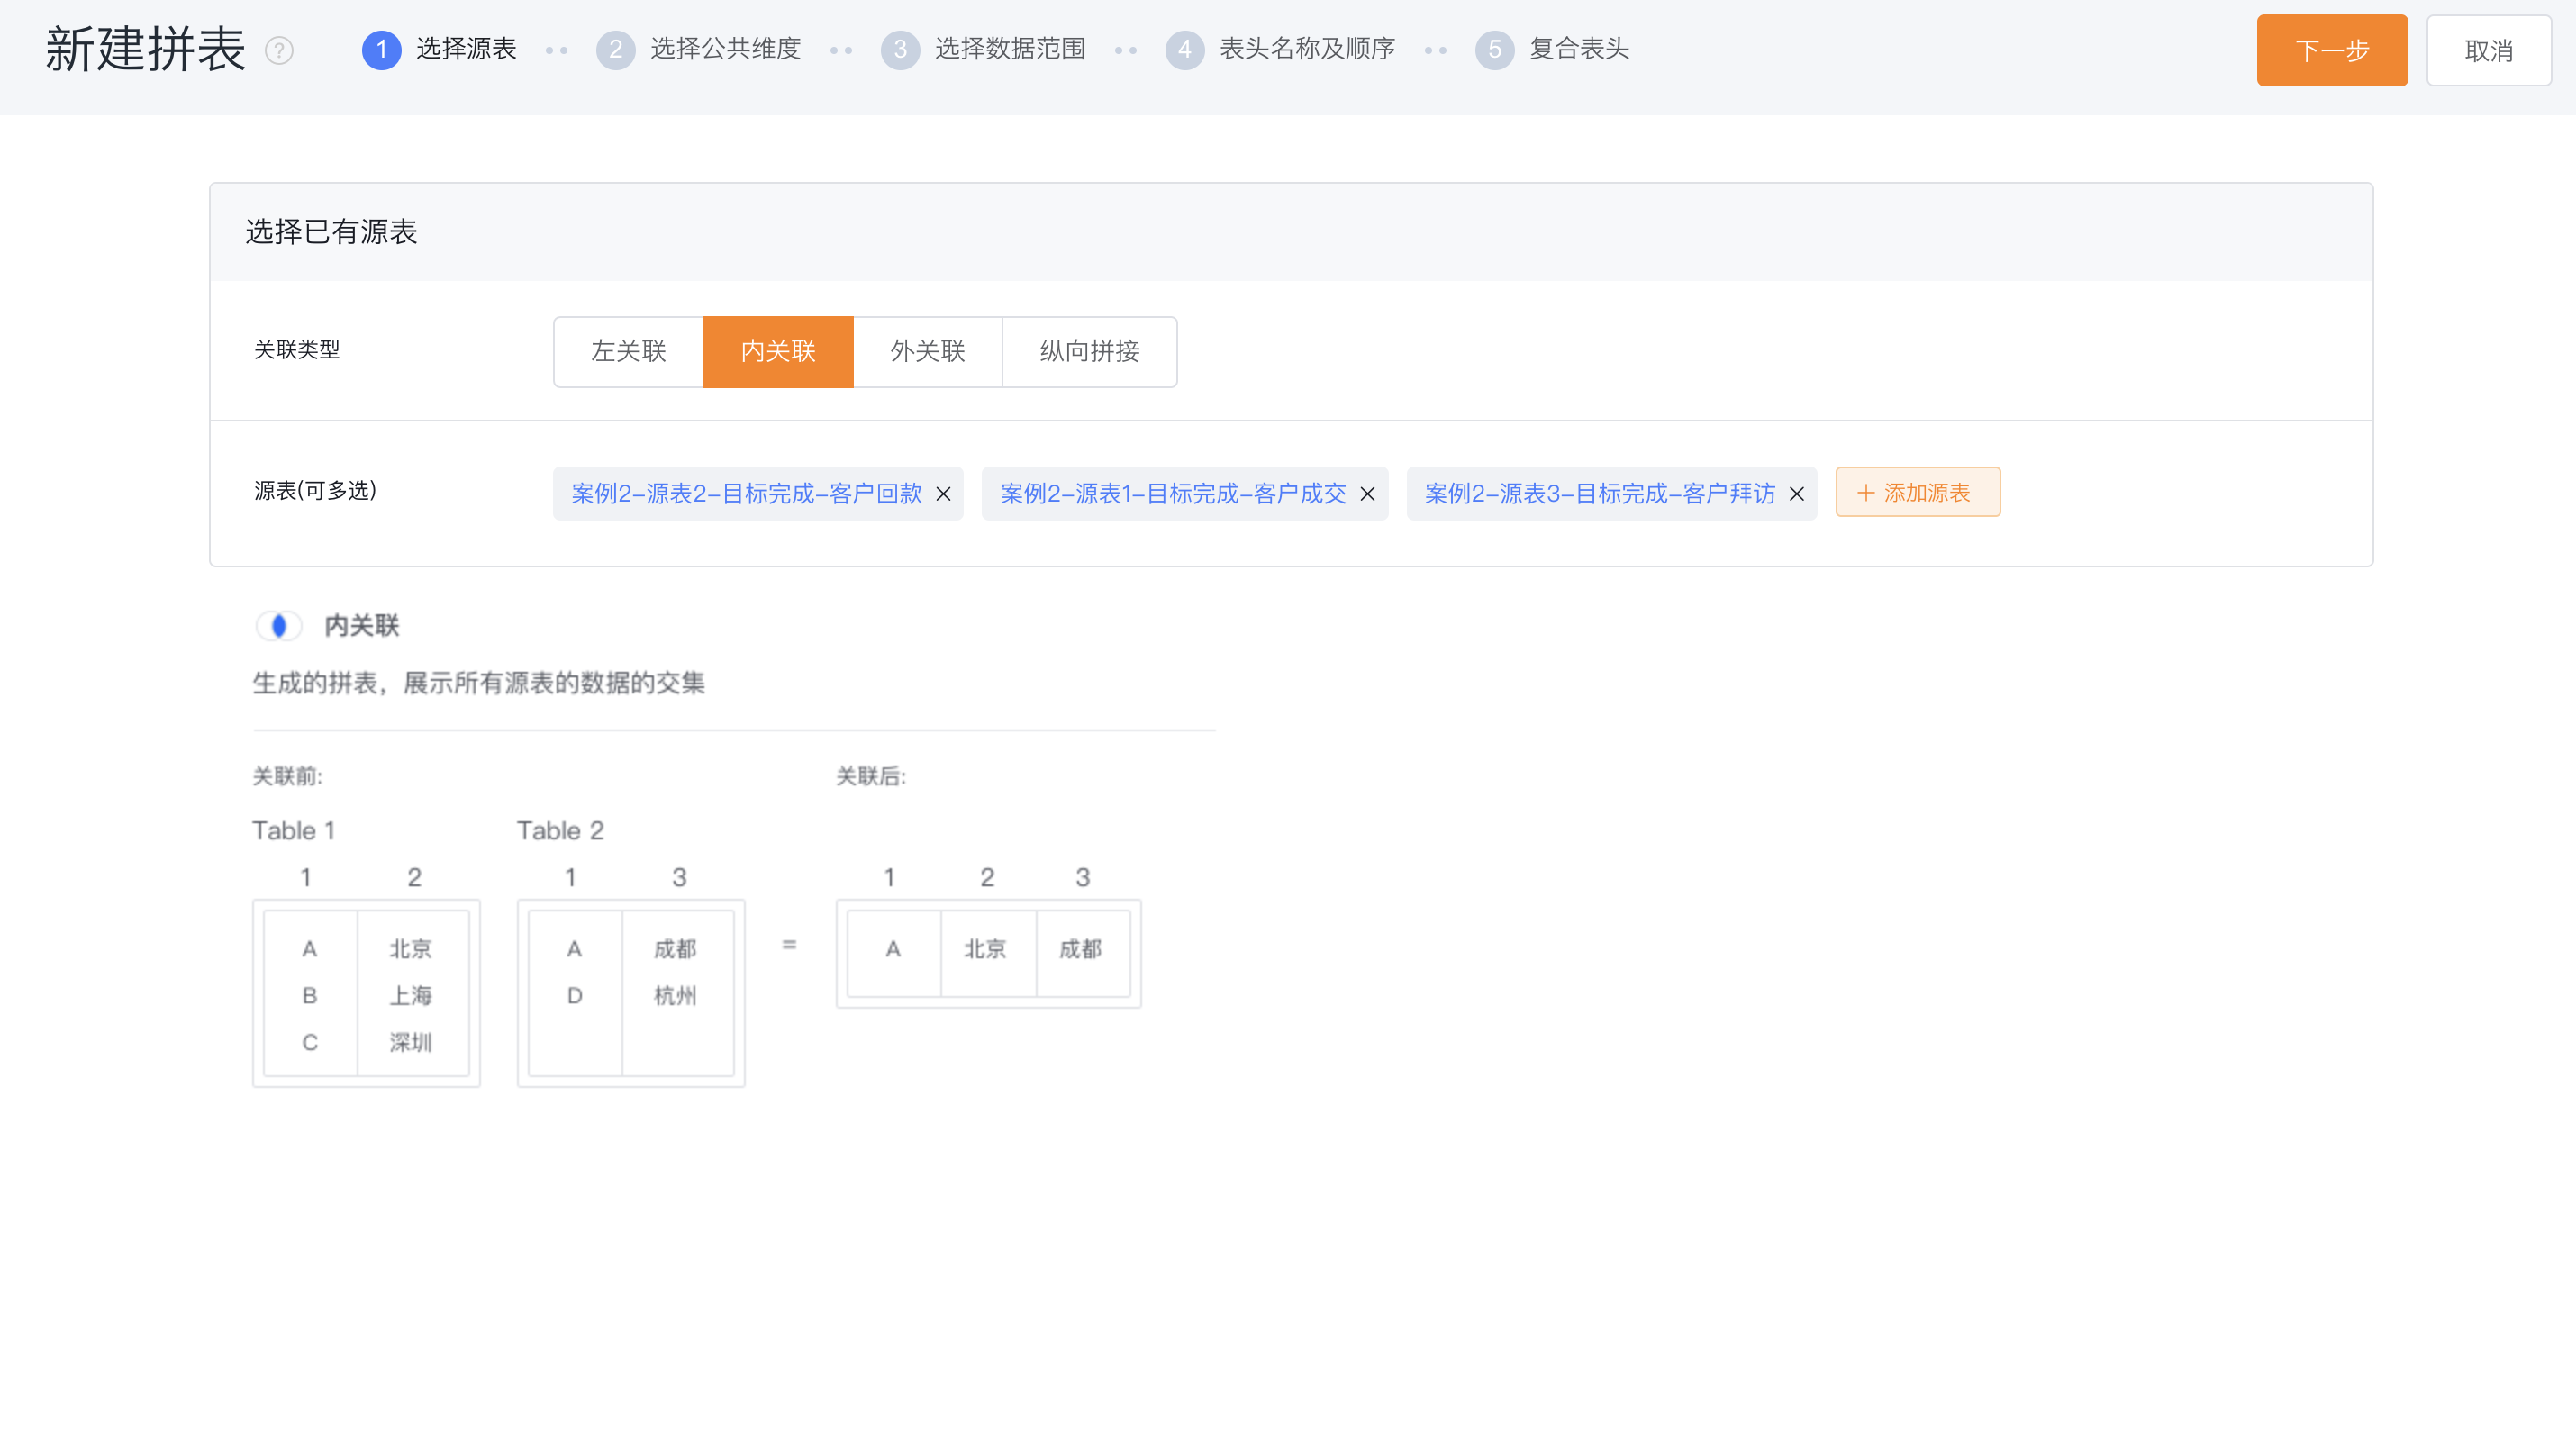
- Source Report: the basic table configured based on BI reports and statistical charts, as the source of the combined table;
- Association Type: the splicing method of each source table when splicing tables
- 1 Left Association: left join, subject to the left source table;
- 2 Inner Association: inner join, take intersection;
- 3 Outer Association: outer join, take union;
- 4 Vertical Splicing: Merge of all data rows;
- Case Description: The dimension value "person in charge" of each source table is completely consistent. At this time, the association type can be selected as inner association. After the intersection of the three source tables, it is still those employees that need to be counted.
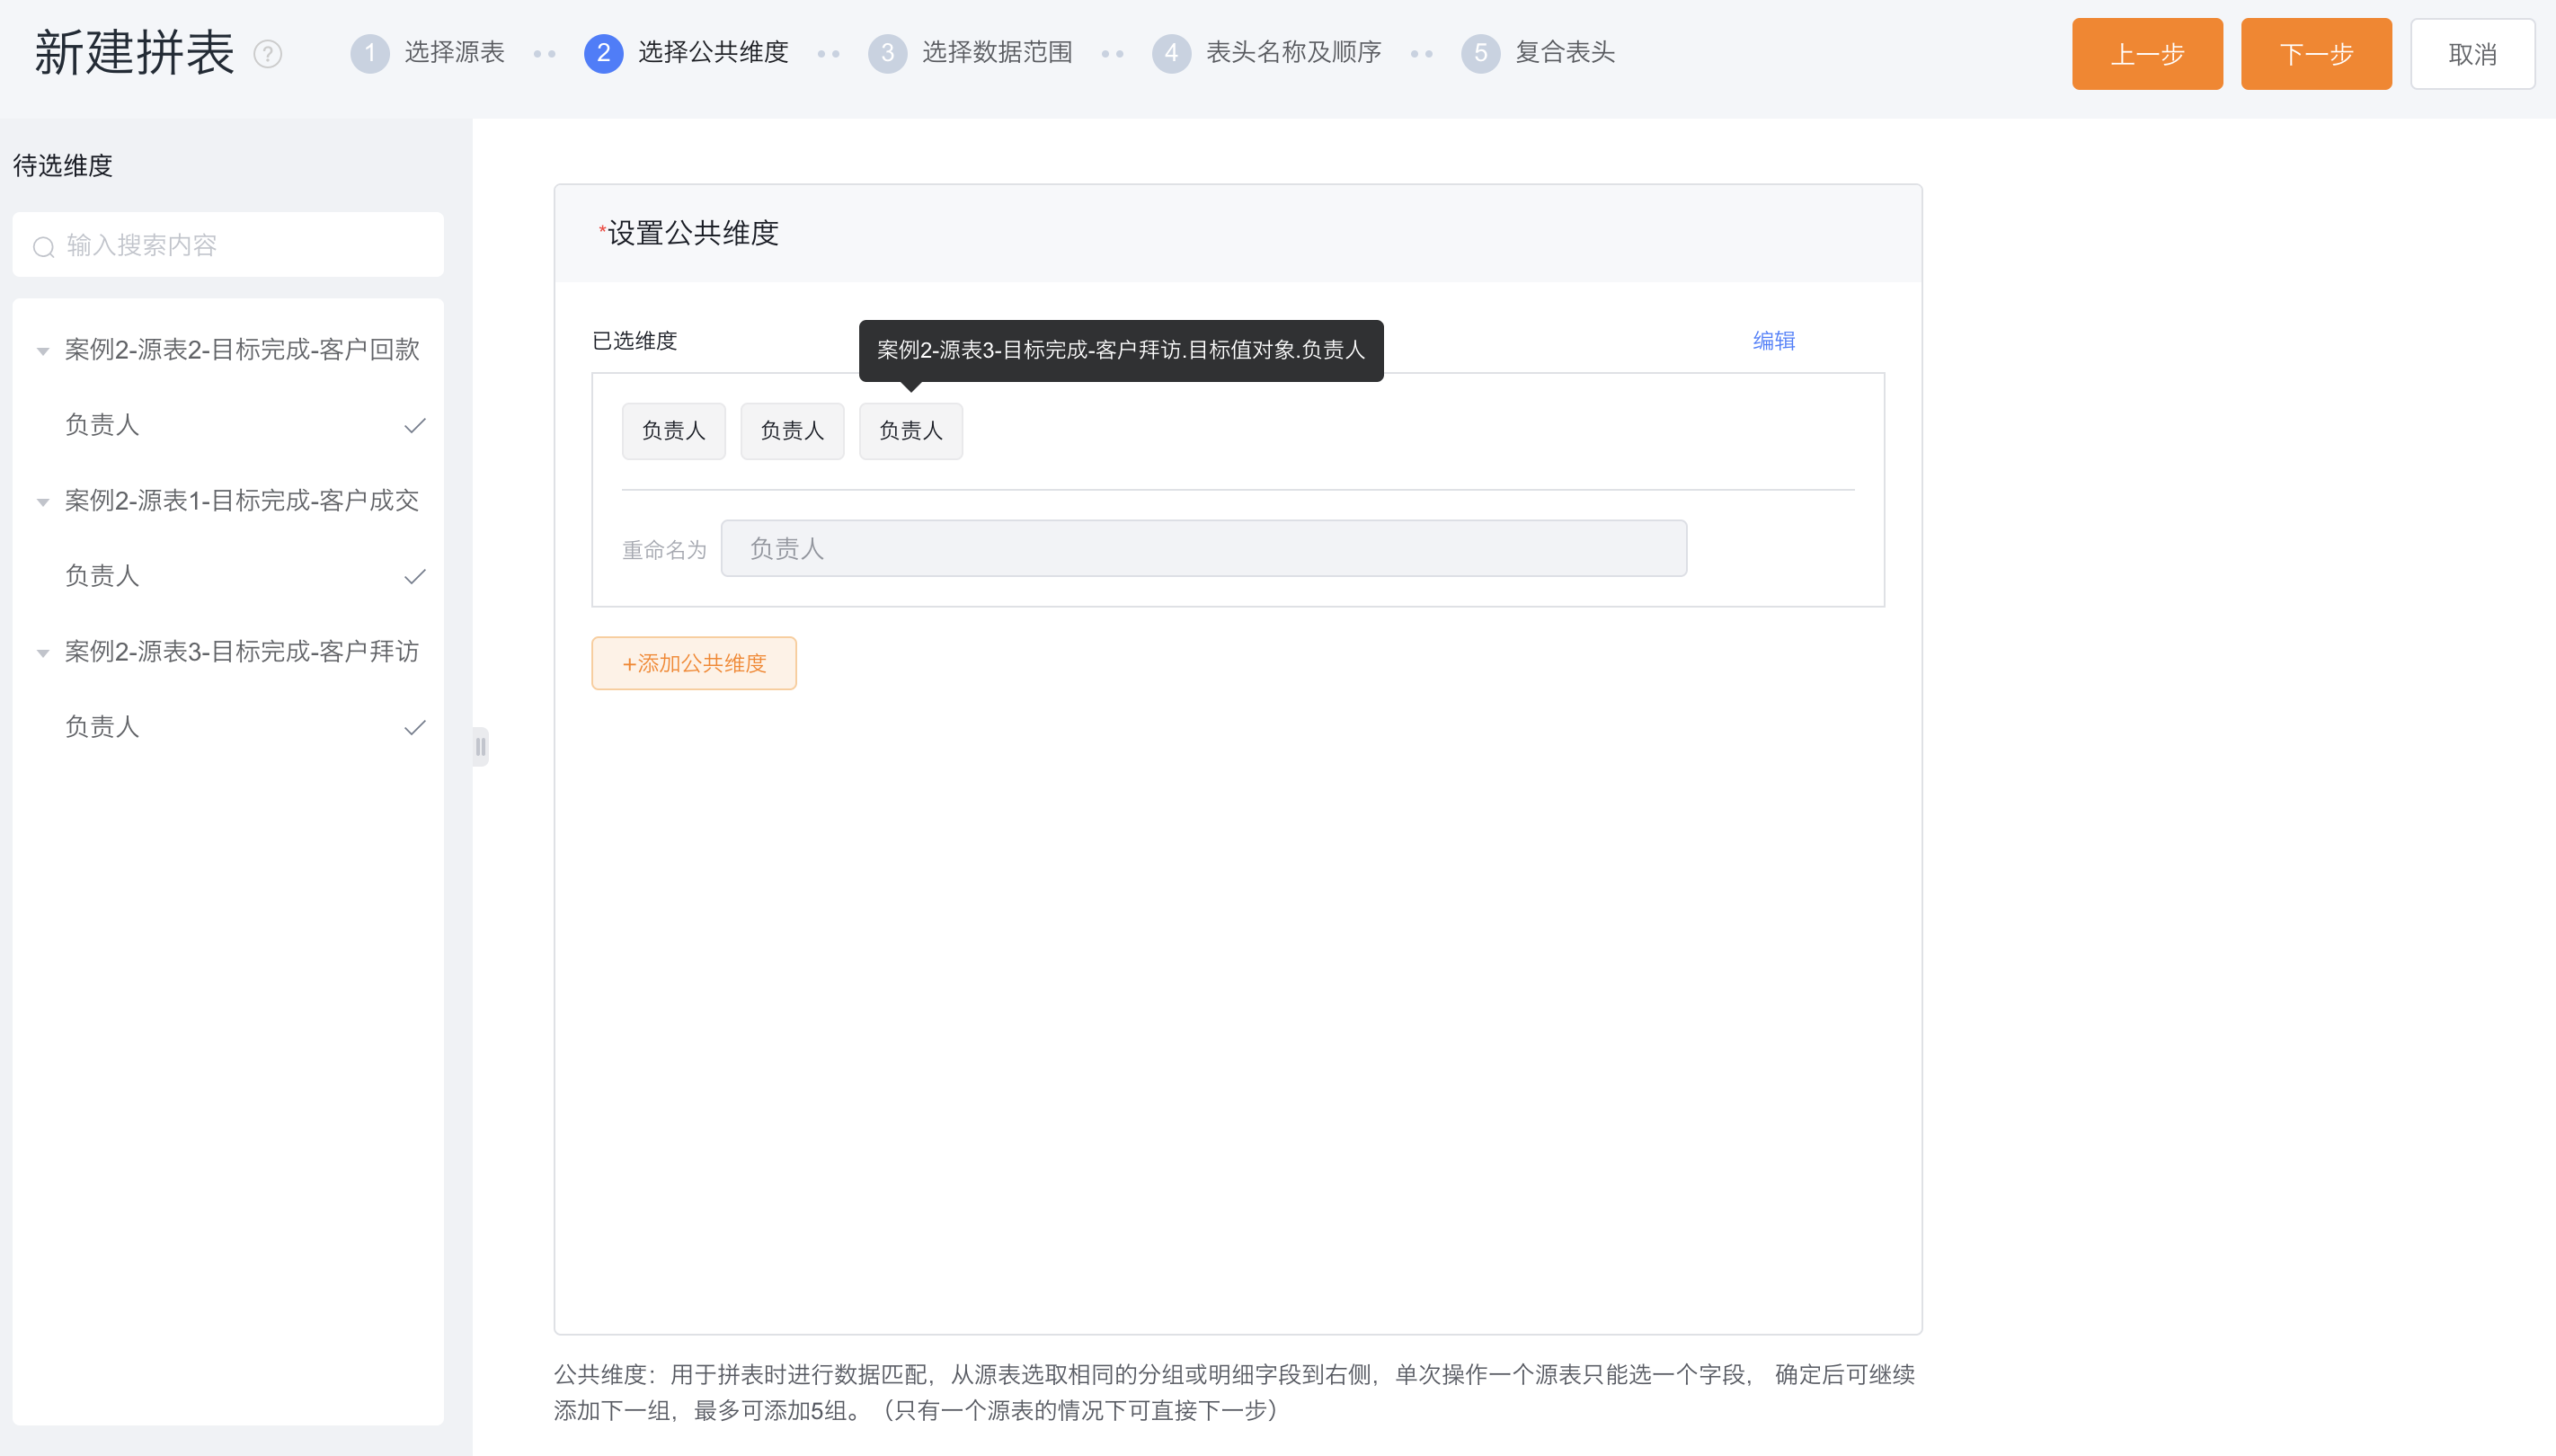
1.2.1.2 Select Public Dimension
- Public Dimension: As the basis for splicing multiple source tables, generally the grouping/dimension fields with the same meaning in each source table click on the fields with the same meaning in each source table and add them to the right to form a set of common dimensions, which will be used as the splicing table Grouping/dimension fields, displayed by renamed field names.
- Case Description: the dimensions of the three tables are "person in charge", and the dimension of the final table is also "person in charge", then: Click "person in charge" in source tables 1, 2, and 3 to add it to the public dimension on the right , click OK.
1.2.1.3 Select Data Range
- Add Merged Data Range: the common data range of each source table is similar to the common dimension, click on the left to add to the right as a group. Clicking "Merge" means that it will eventually be merged into one filter condition to be used in the data range of the stitching table, and displayed according to the renamed field name. The default values for the filter can also be modified here.
- Add Data Range: In addition to the public data range, other filter conditions, which need to be exposed in the data range after the table is assembled. Filter conditions that have not been added will not be displayed in the data range of the combined table, and will work according to the default configuration of the source table.
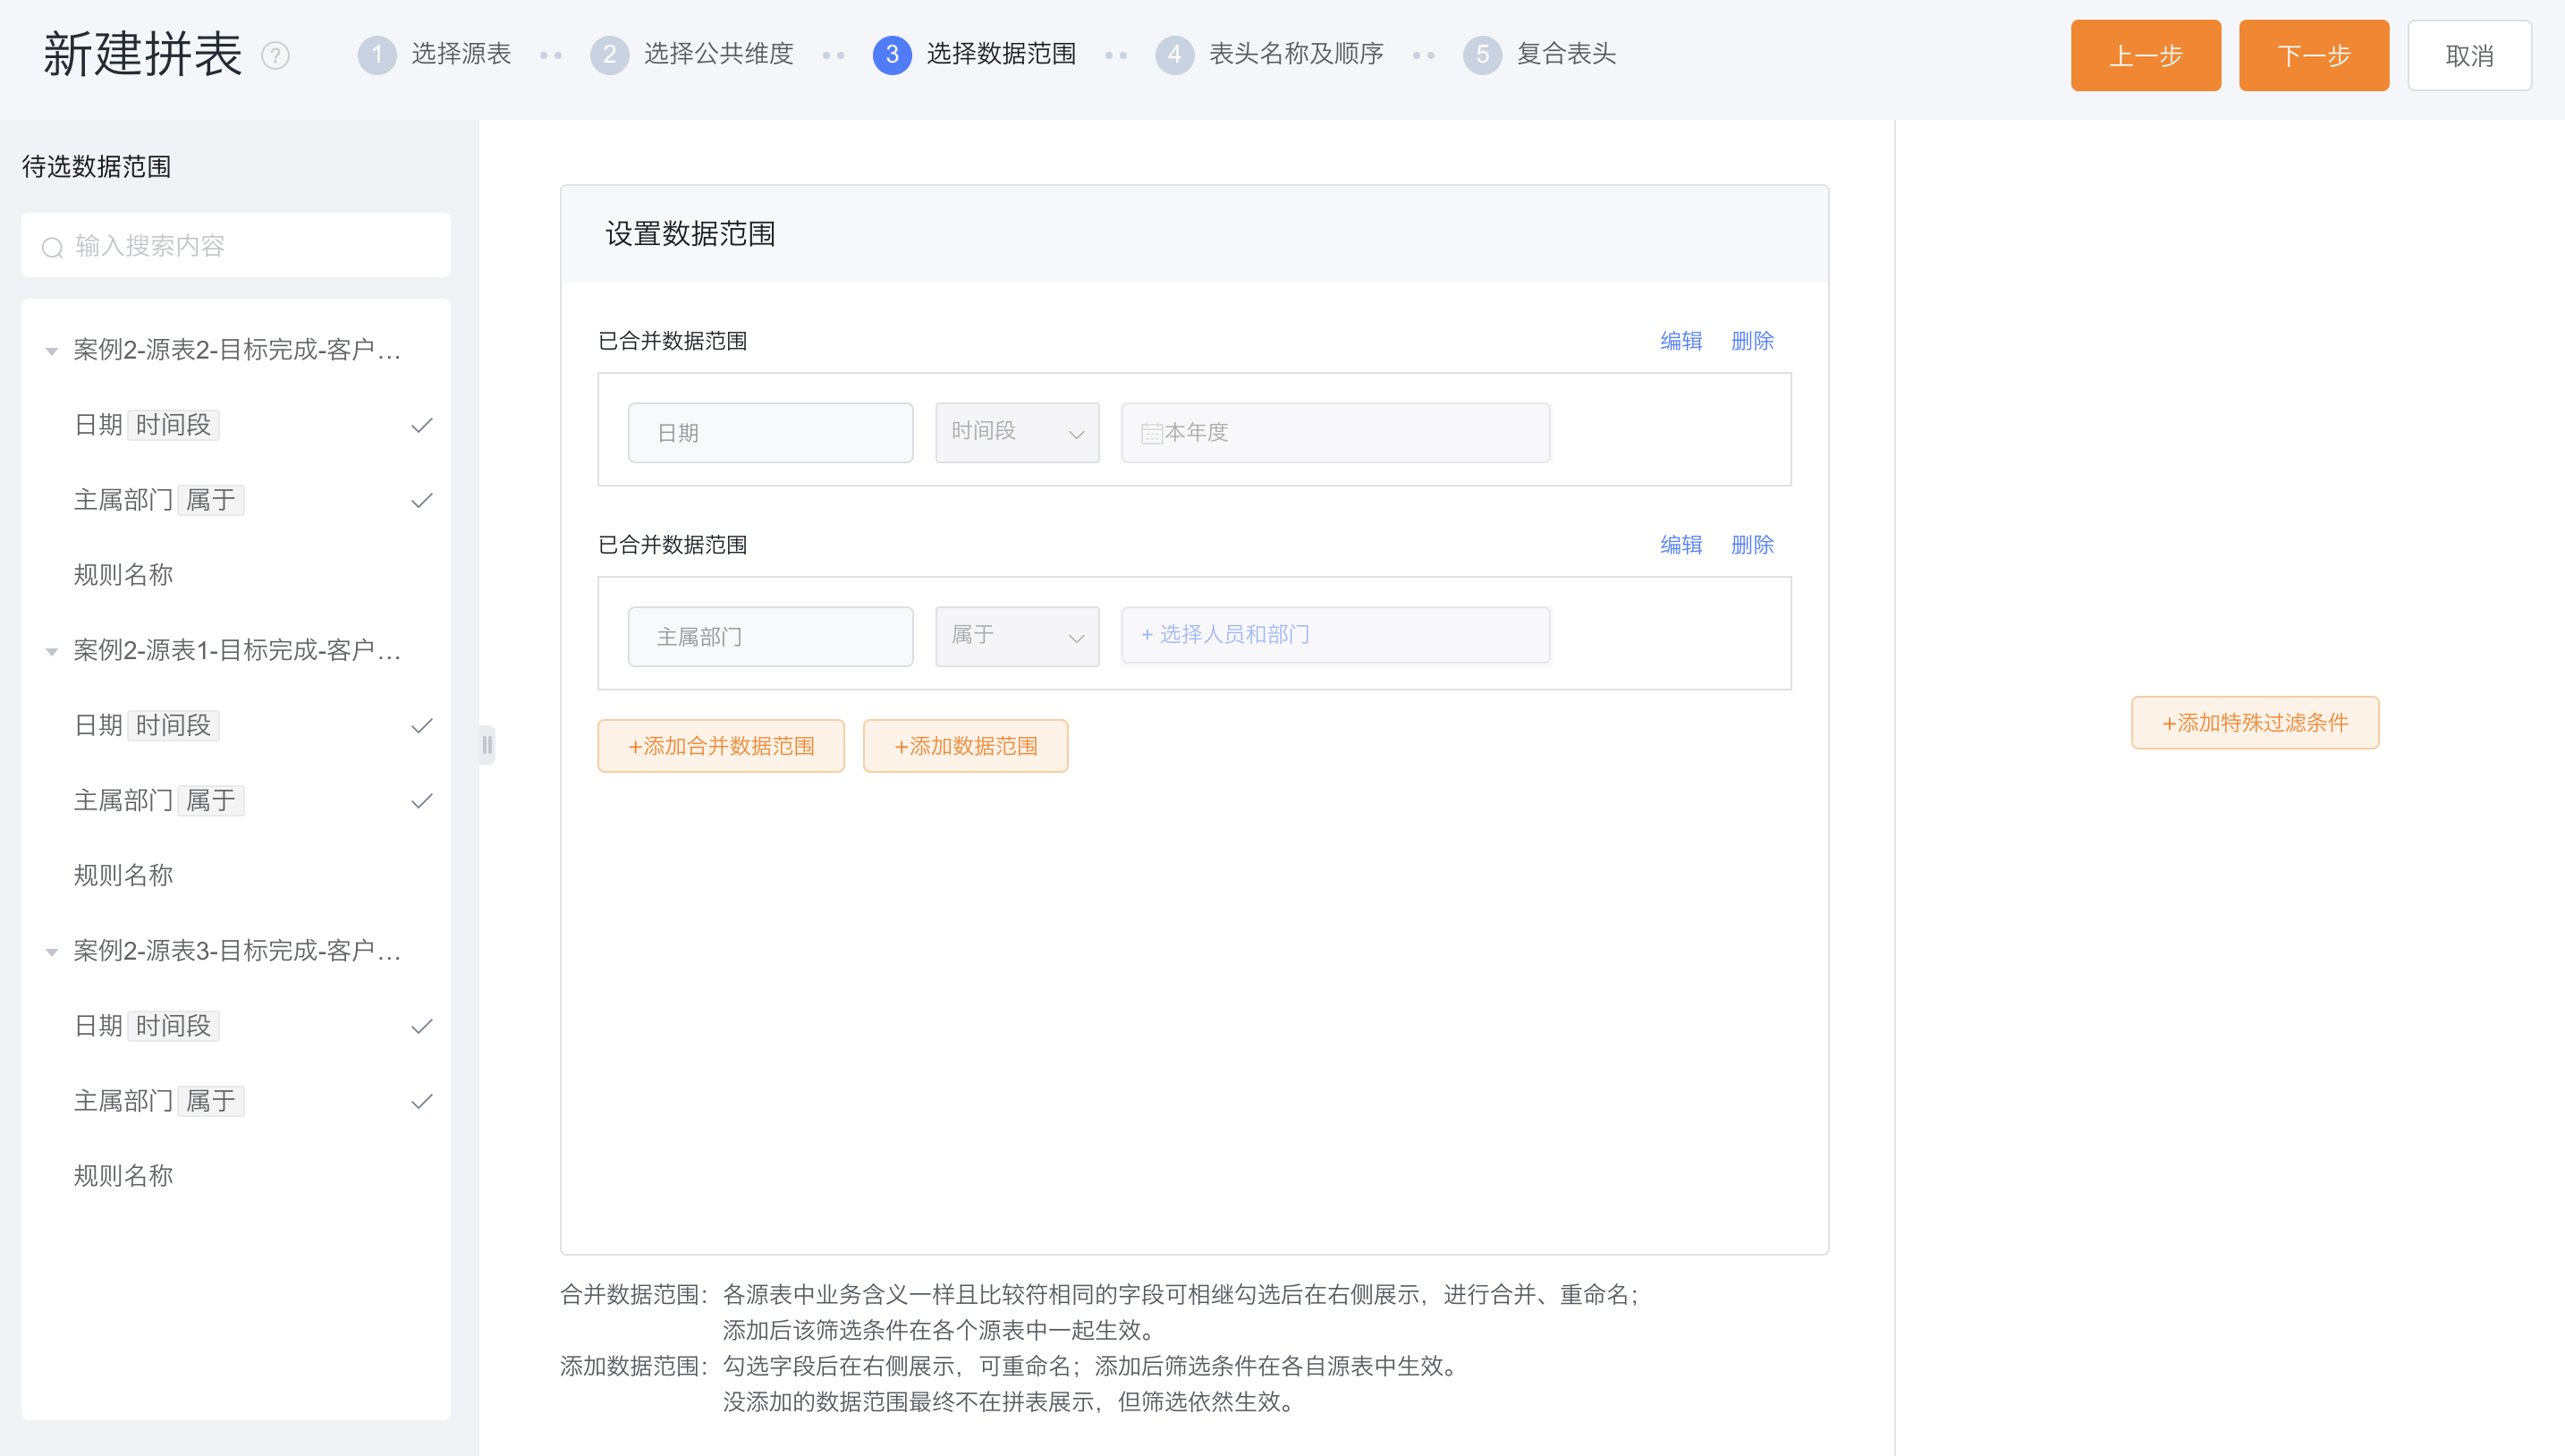
- Case Description: Add two sets of merged data ranges: date and main department as the public data range after the table is merged, and the filtering will work on the 3 source tables at the same time. None of the target rules are displayed, and the data is fixed to be filtered according to the specified target rules according to the source table configuration.
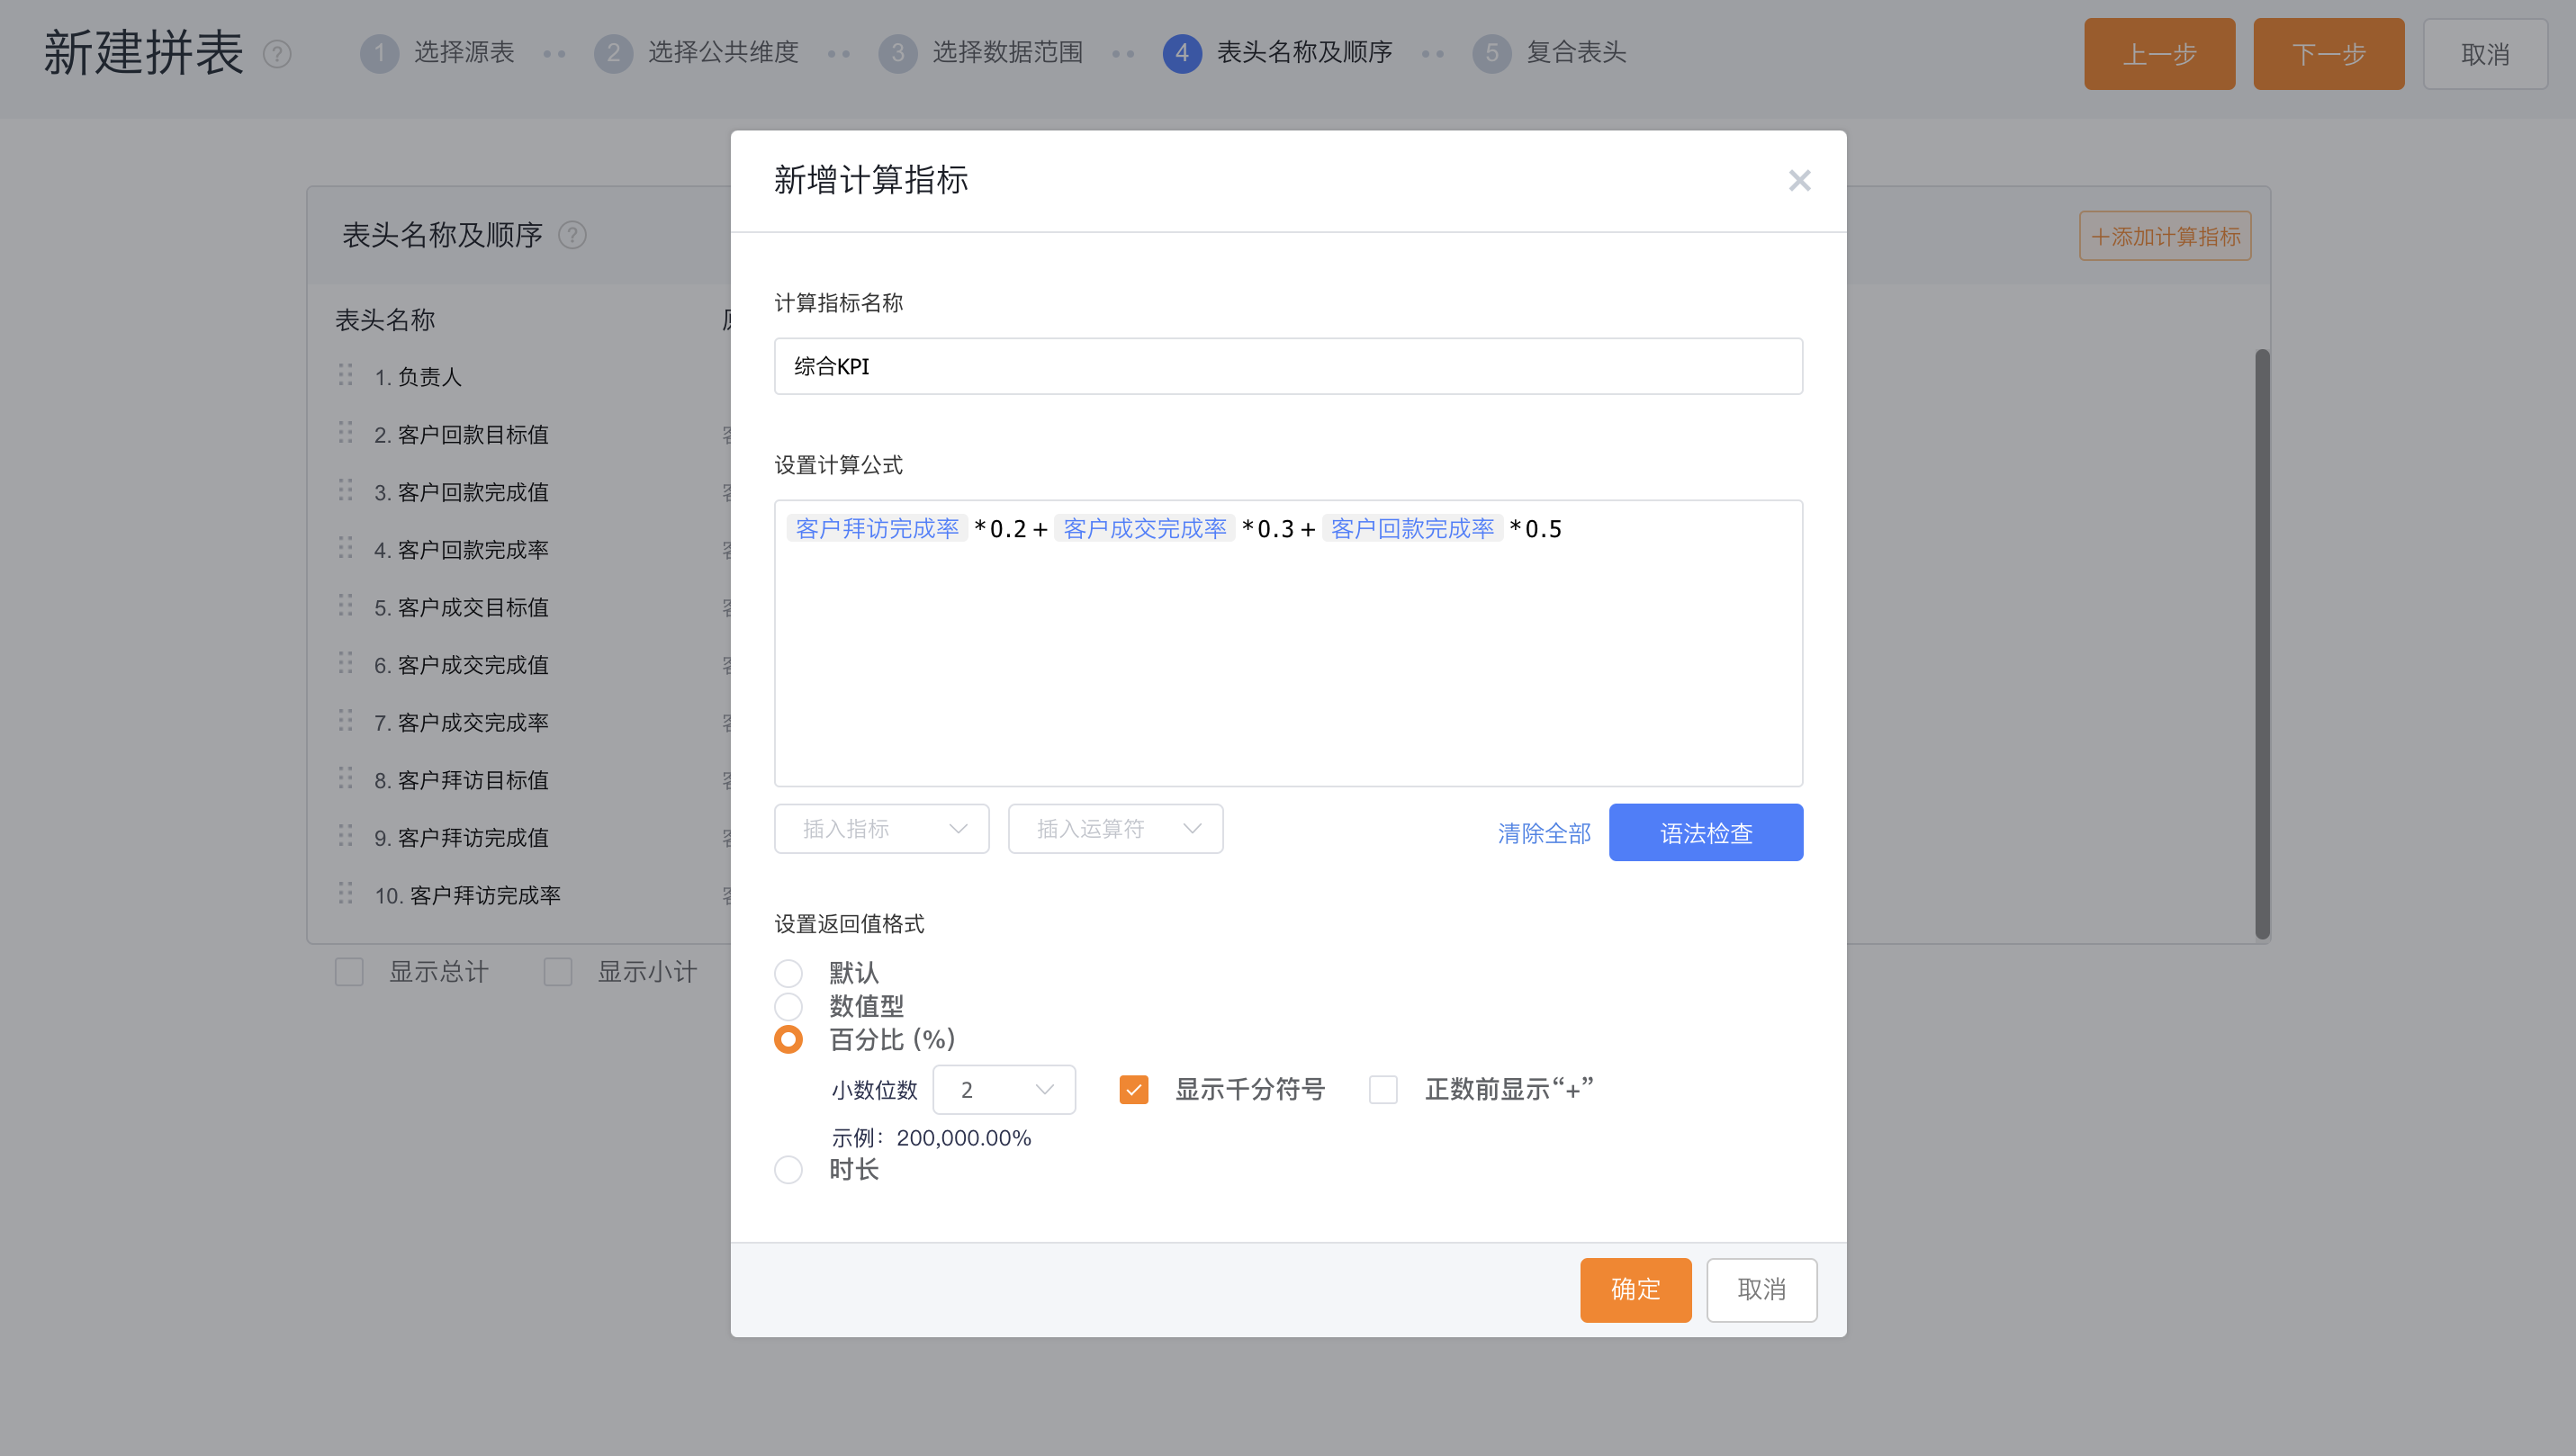
1.2.1.4 Header Name & Order
- Header Name: The field name of the public dimension is displayed according to the setting in the second step, which cannot be modified here, and other field names can be modified as required.
- Adjust Order: Drag and drop to adjust the order of the columns, where the common dimension must be at the front and cannot be adjusted.
- Add & Hide Columns: You can add calculated indicators as new columns; you can hide columns that don't need to be displayed in the spelling table.
- Case Description: Add a calculation indicator, multiply the three target rules by weight, and drag to the last display.
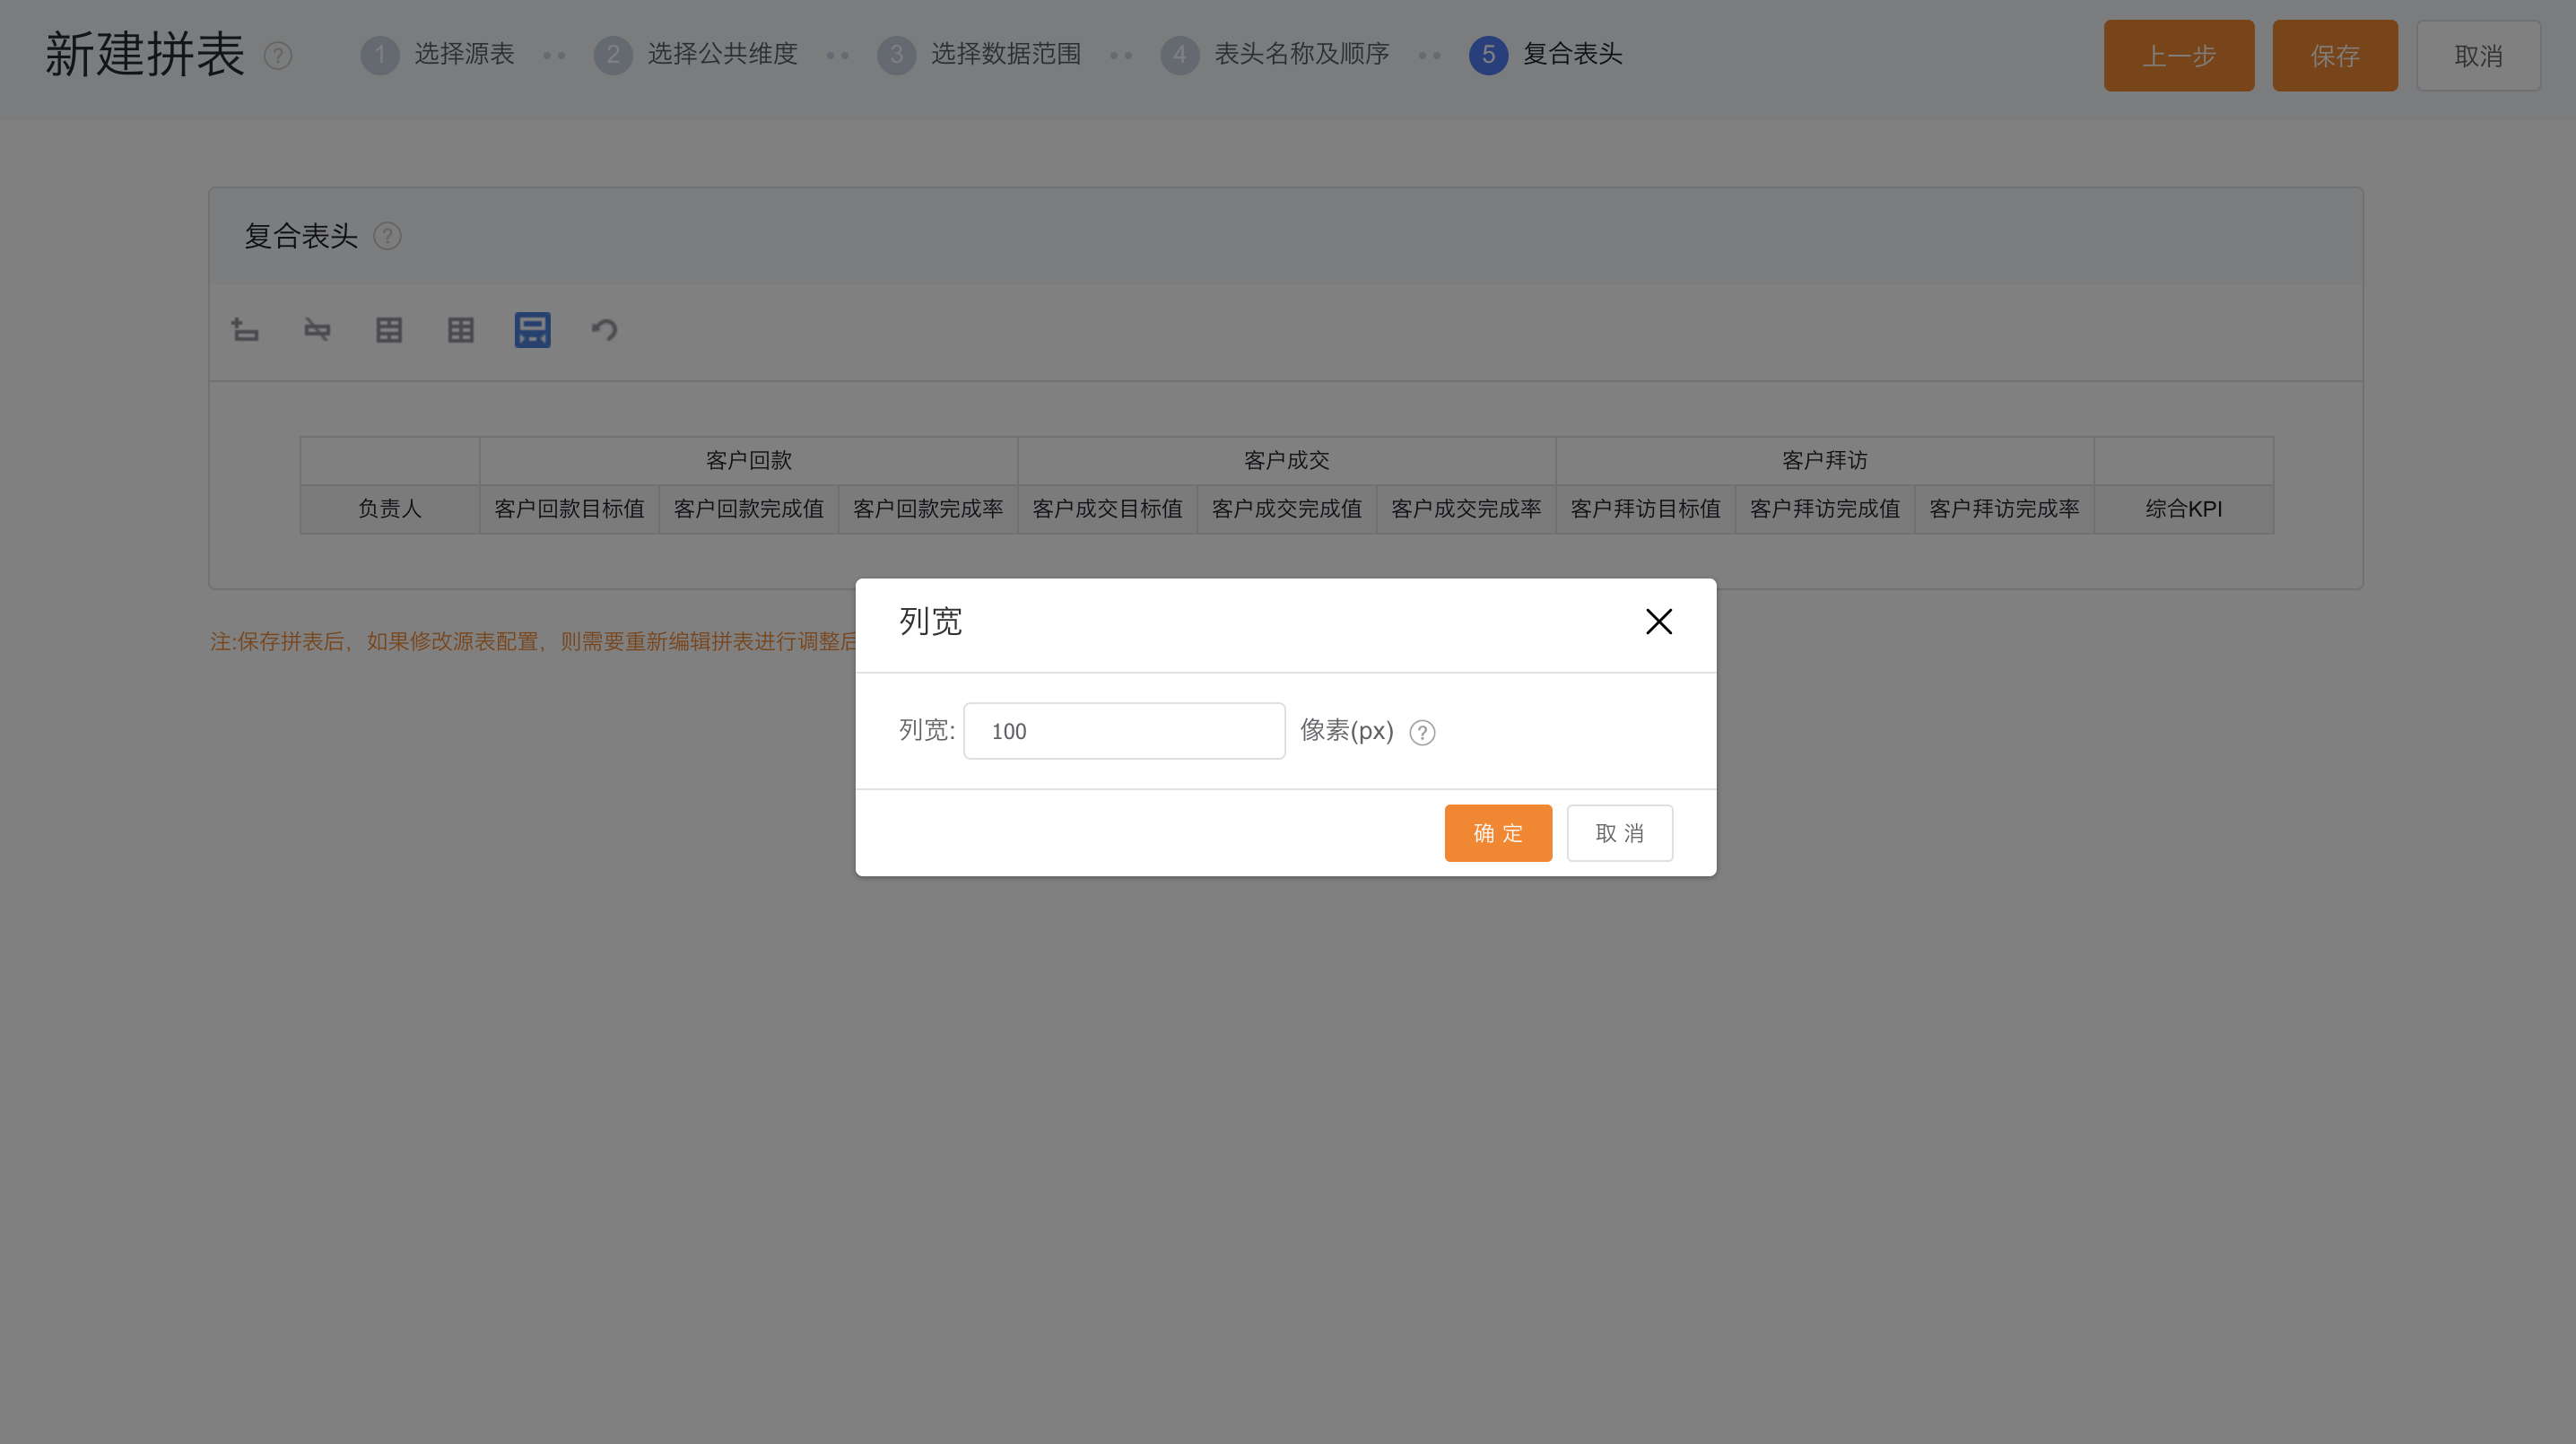
1.2.1.5 Composite Header
-
Composite Header: Display the title and order of the headers adjusted in the previous step, and add multiple layers of composite headers to the top.
-
Actions:
Add Row: add a new row above; Delete Row: delete the selected row; Merge Cells: Merge multiple cells in the mouse circle; Split Cell: split the merged cell back to the original cell; Compact Mode: compact mode can be set; Back: Go back to the previous step; Modify Column Width: Click the original header to modify the column width; Modify Display Name: Click the added grid to modify the display name; -
Case Description: add a line above, merge cells separately, divide the table header into customer payment, customer transaction, and customer visit merge table header according to the target rules, adjust the width of each column to 100 pixels, and set the compact mode for convenient viewing in one screen.
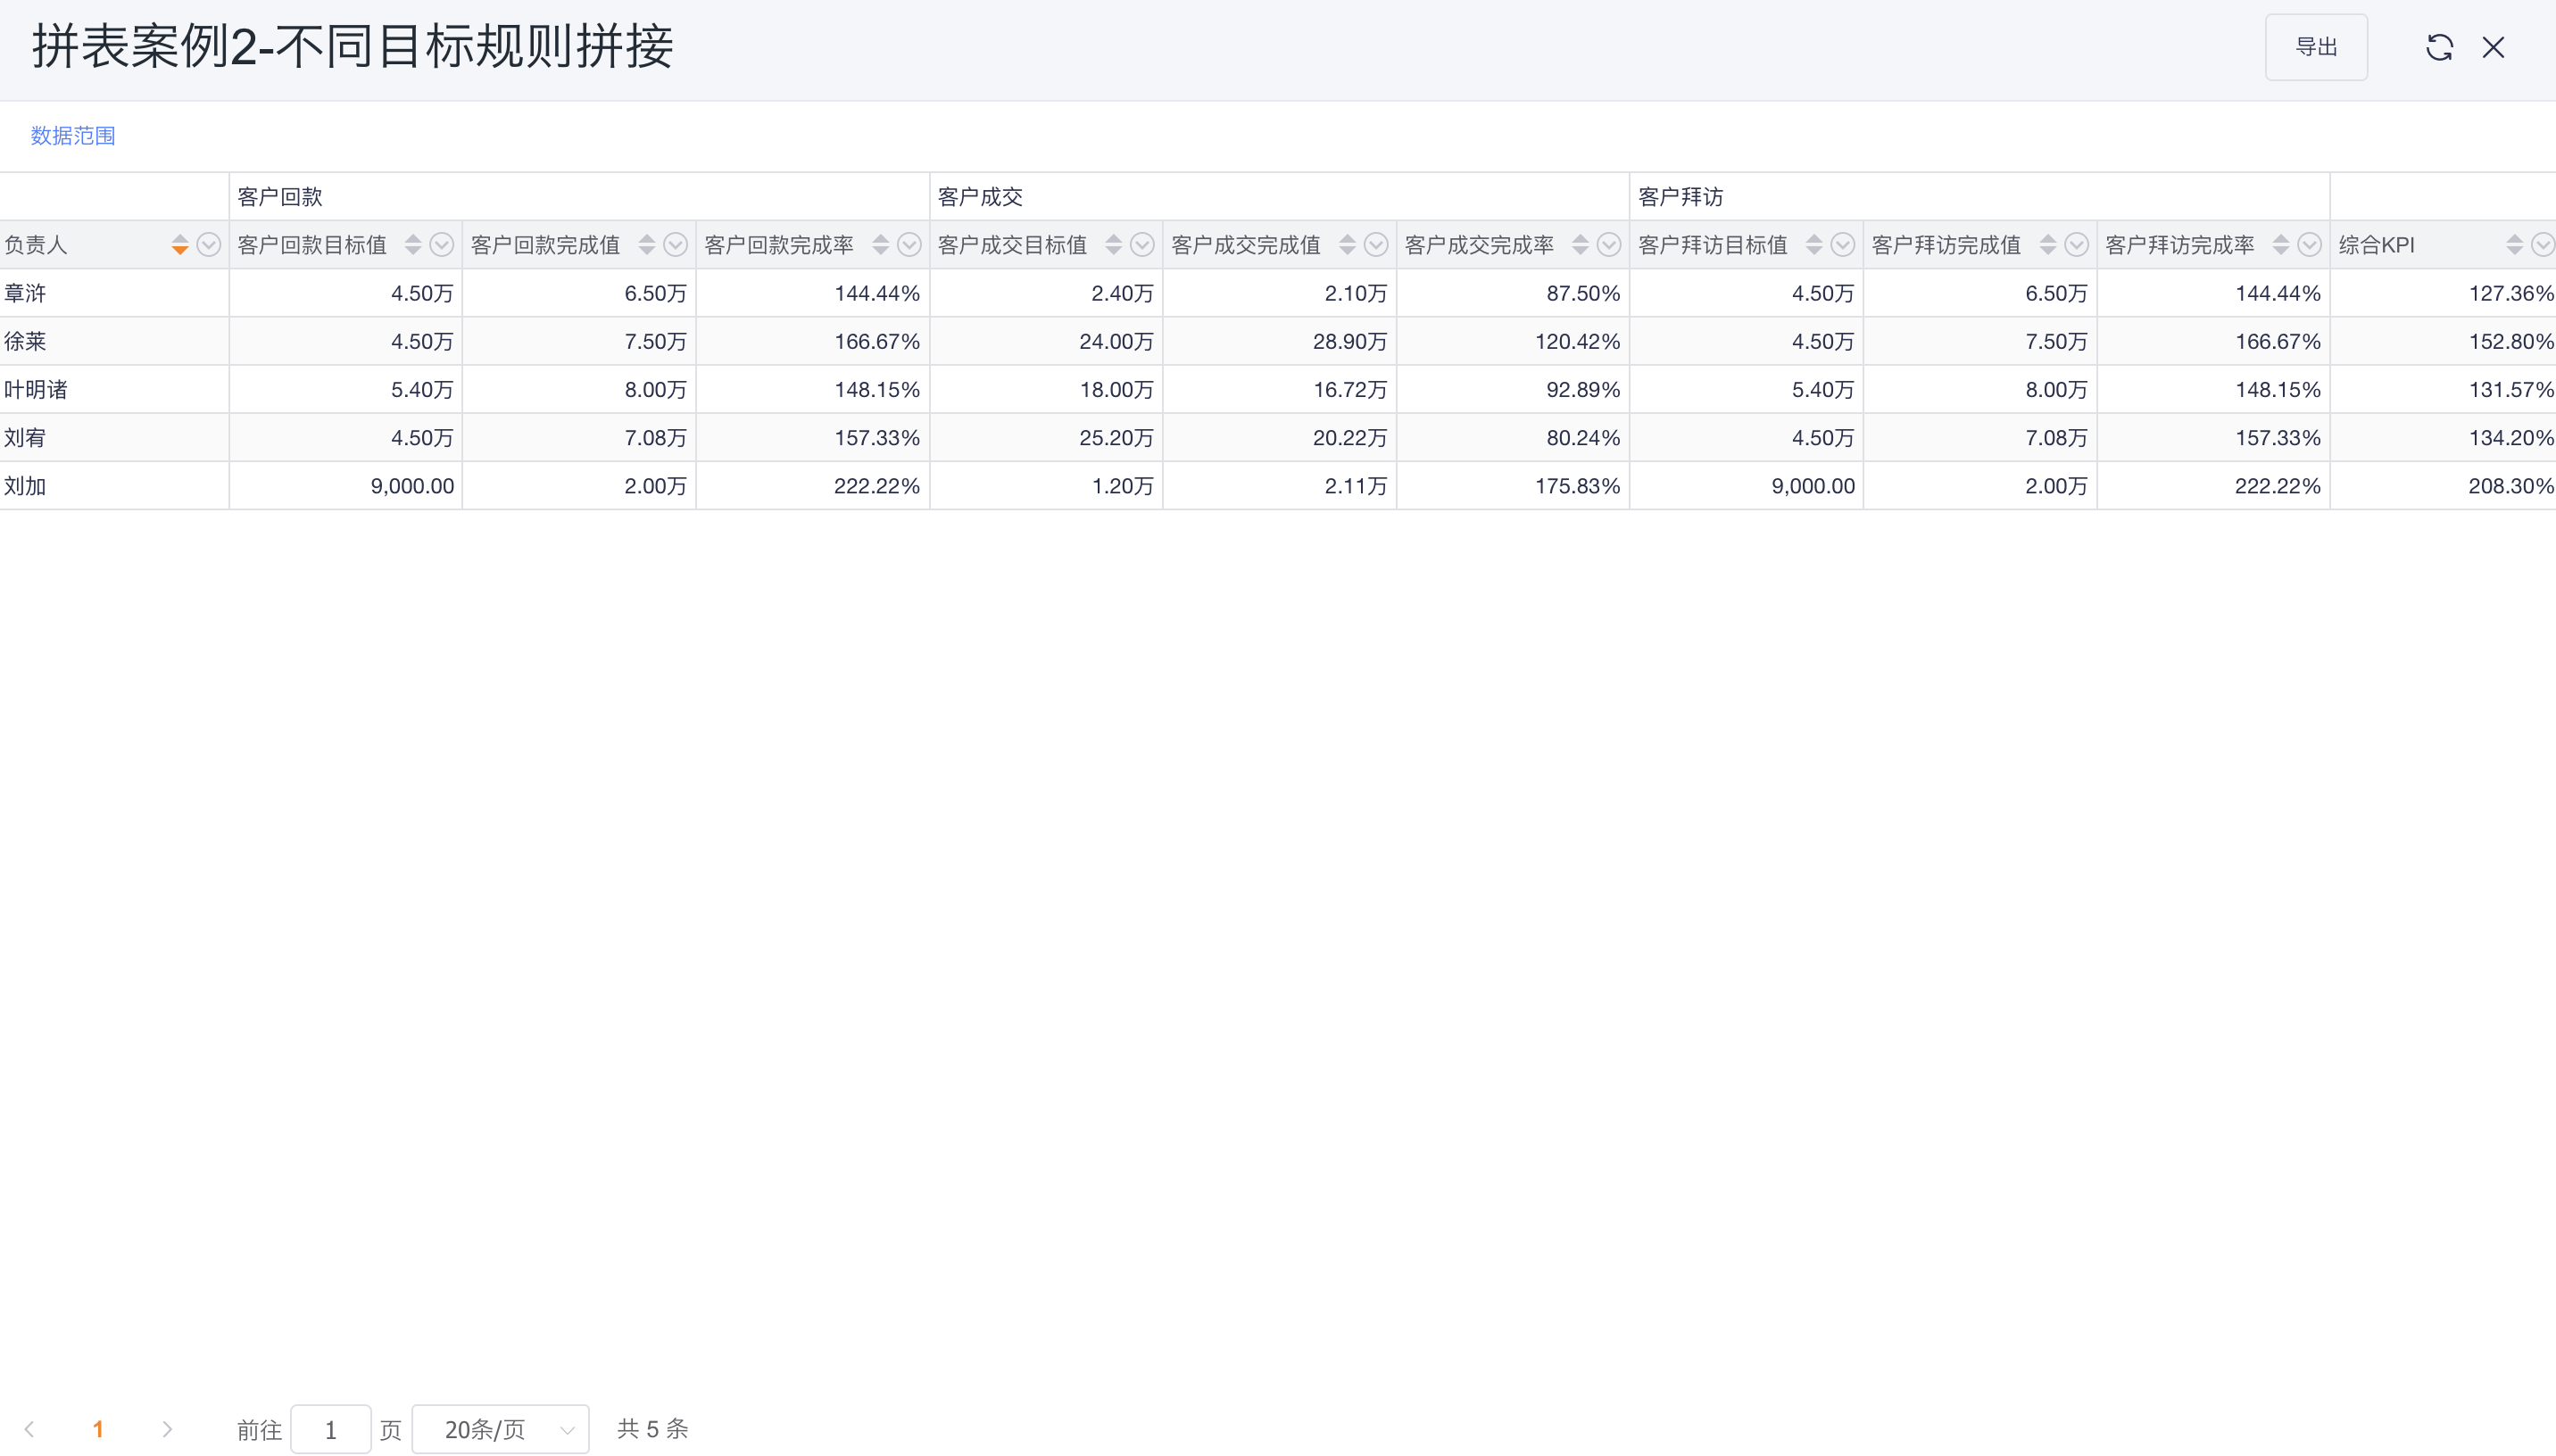
1.2.2 Joined Report Results
Two, multi-table splicing
2.1 Case 3: Splicing of different themes
- Core appeal: Use the employee theme to count the number of sales visits, the number of employees who have visited, and the total number of employees, use the customer theme to count the number of customers visited, the total number of customers in charge, and further calculate the proportion of sales staff going out to work, as well as customer visits coverage;
- Source table configuration:
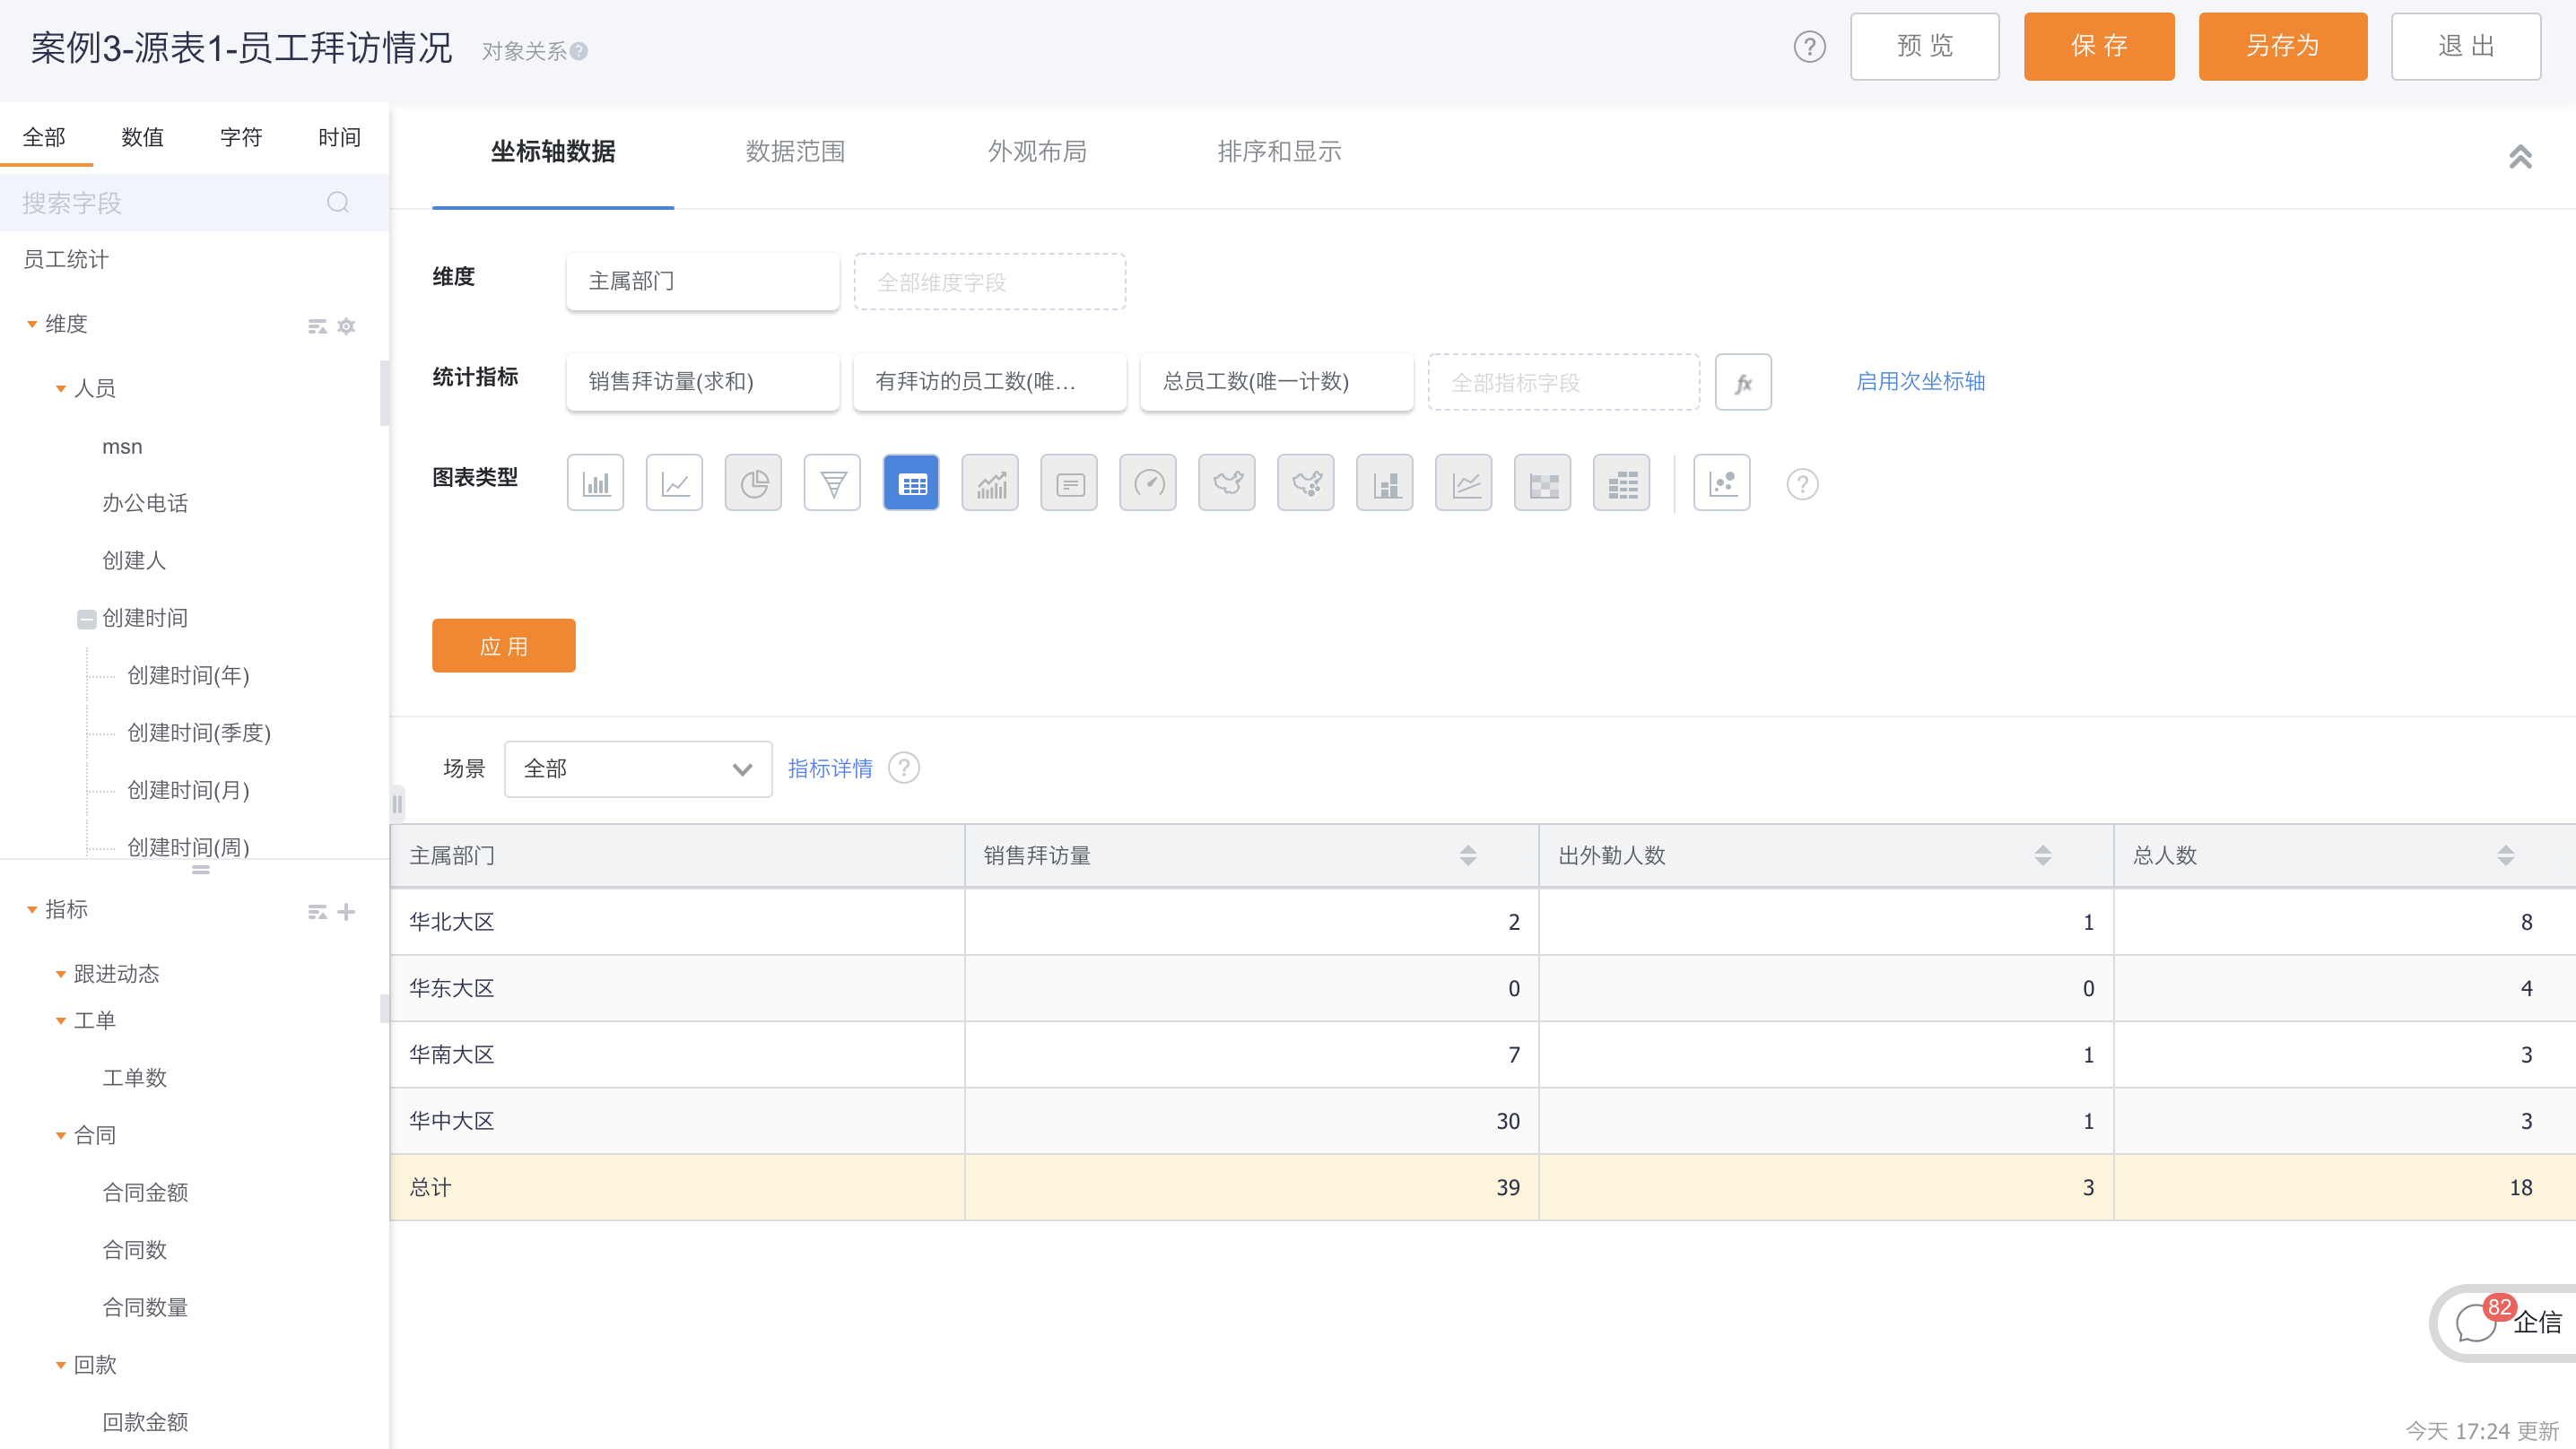
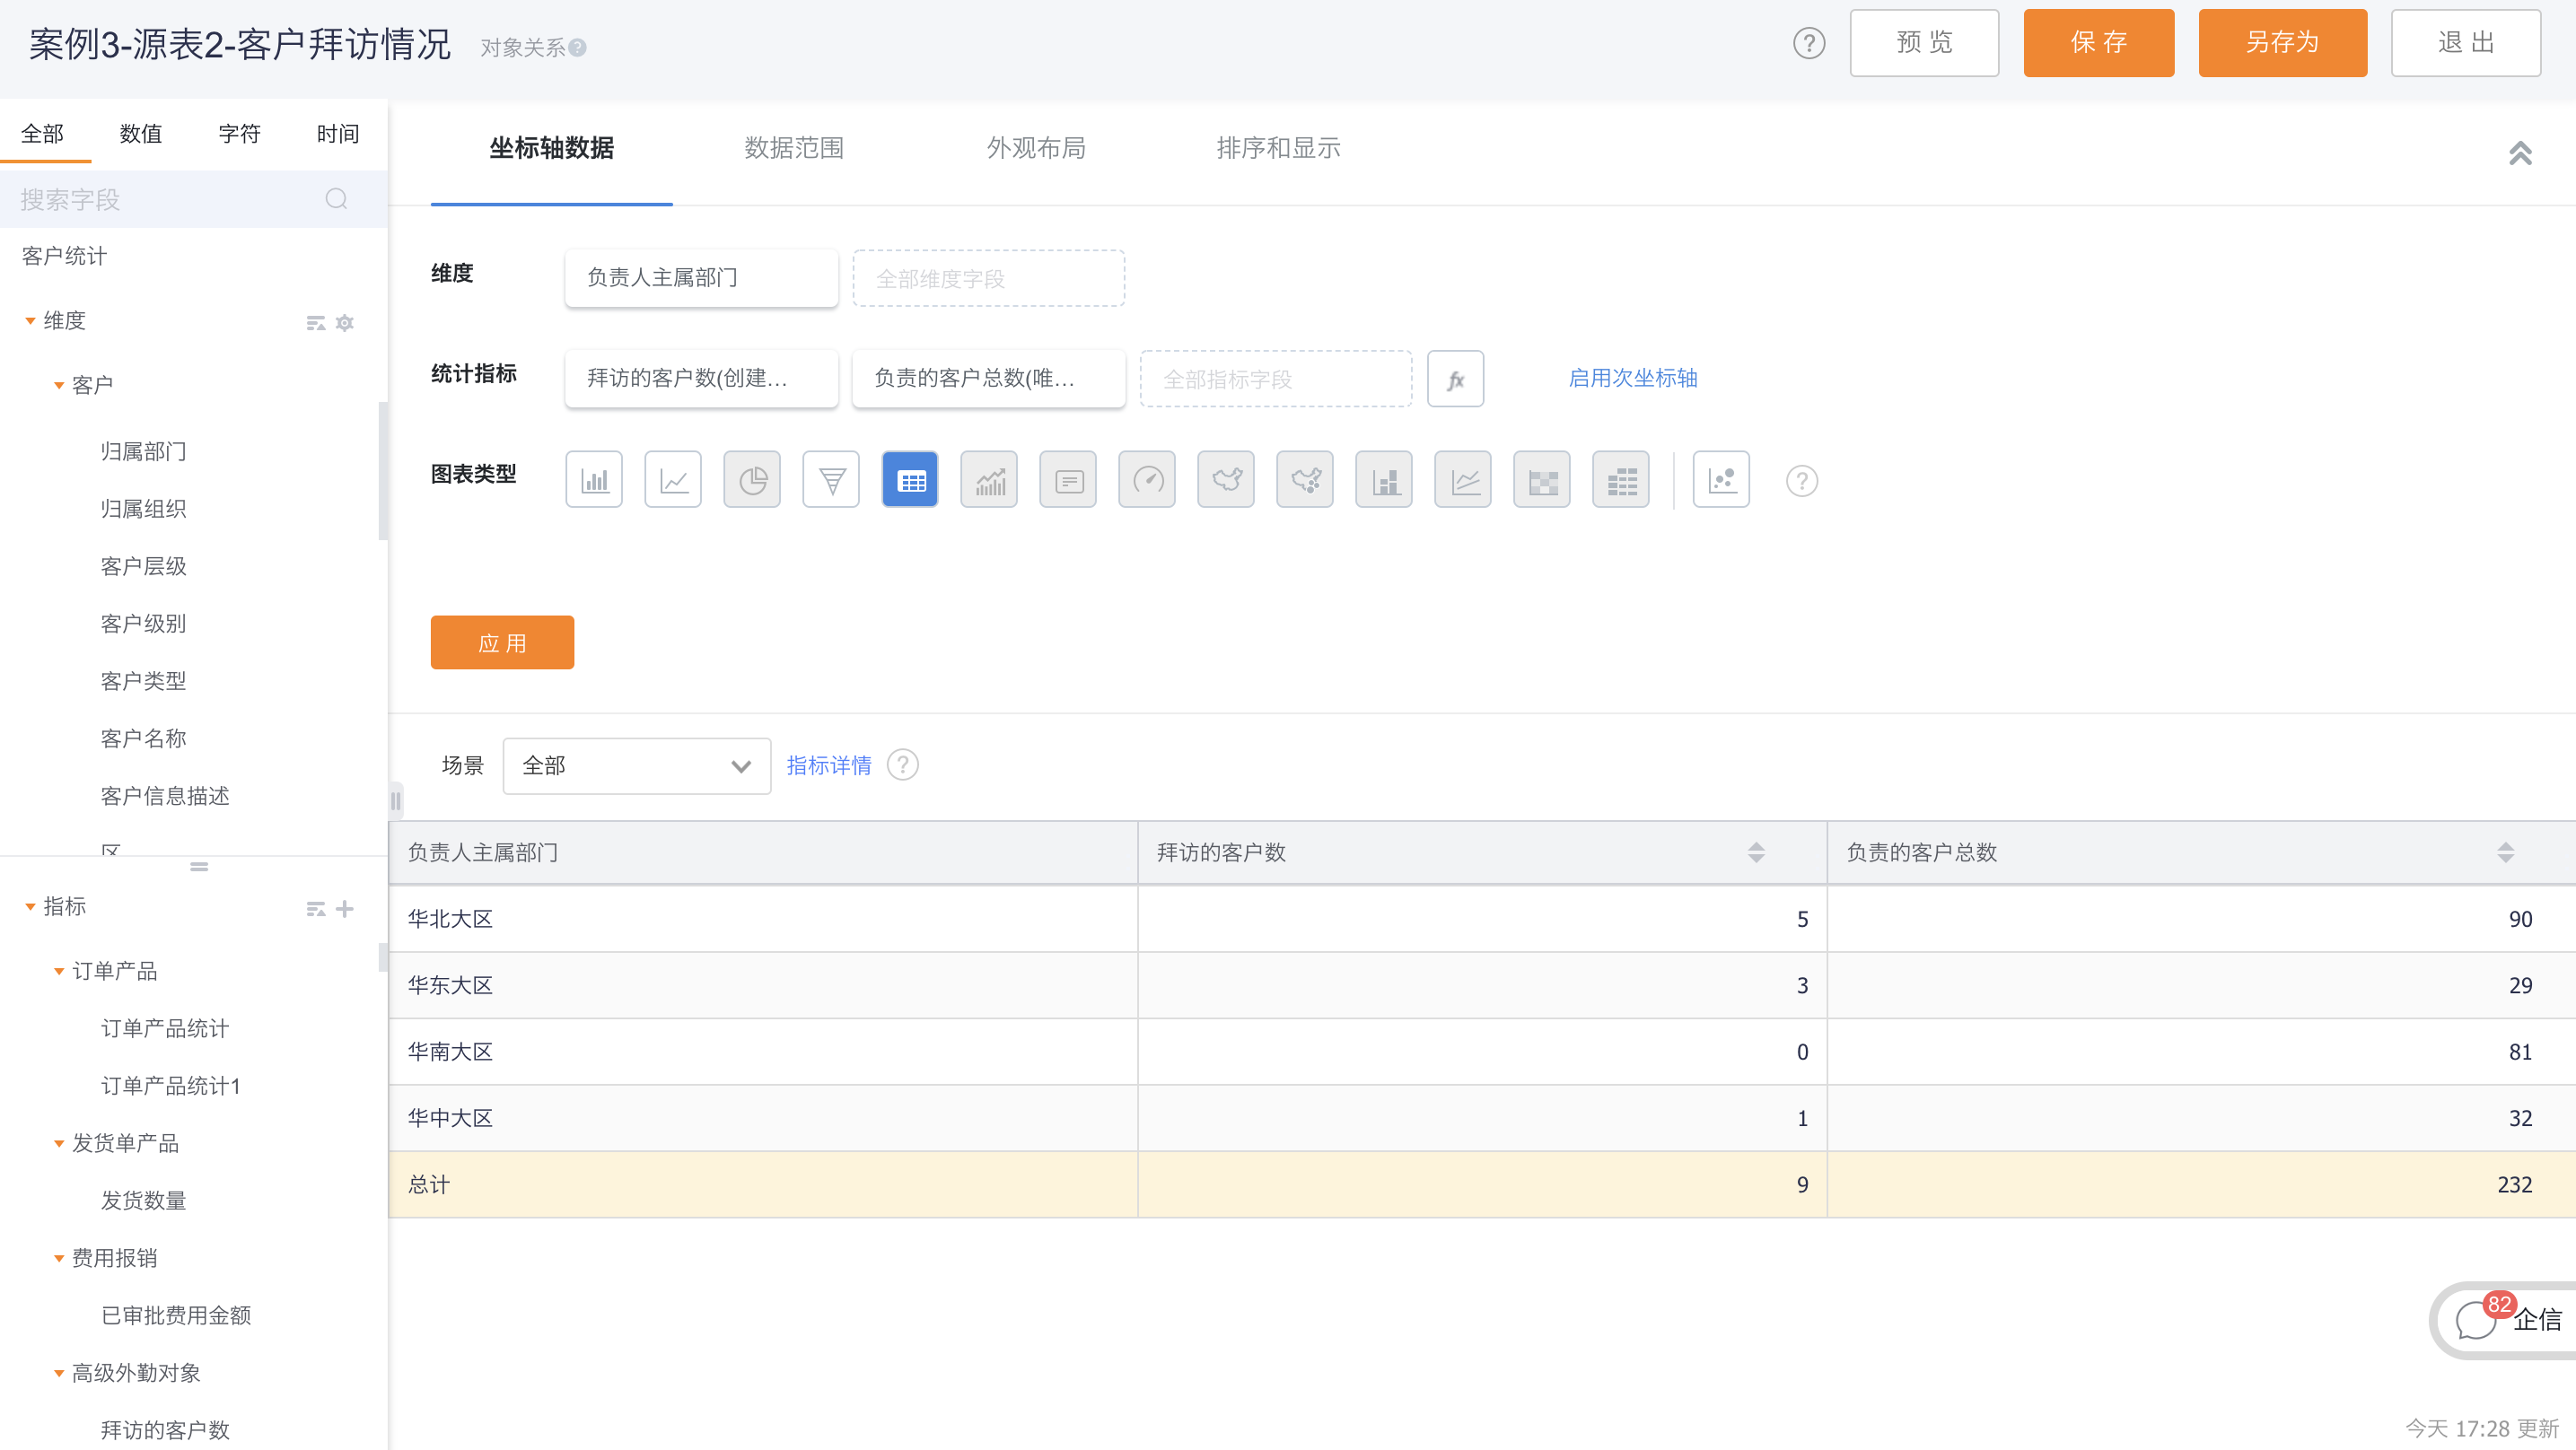
2.1.1 Configuration process
2.1.1.1 Select source table and association type
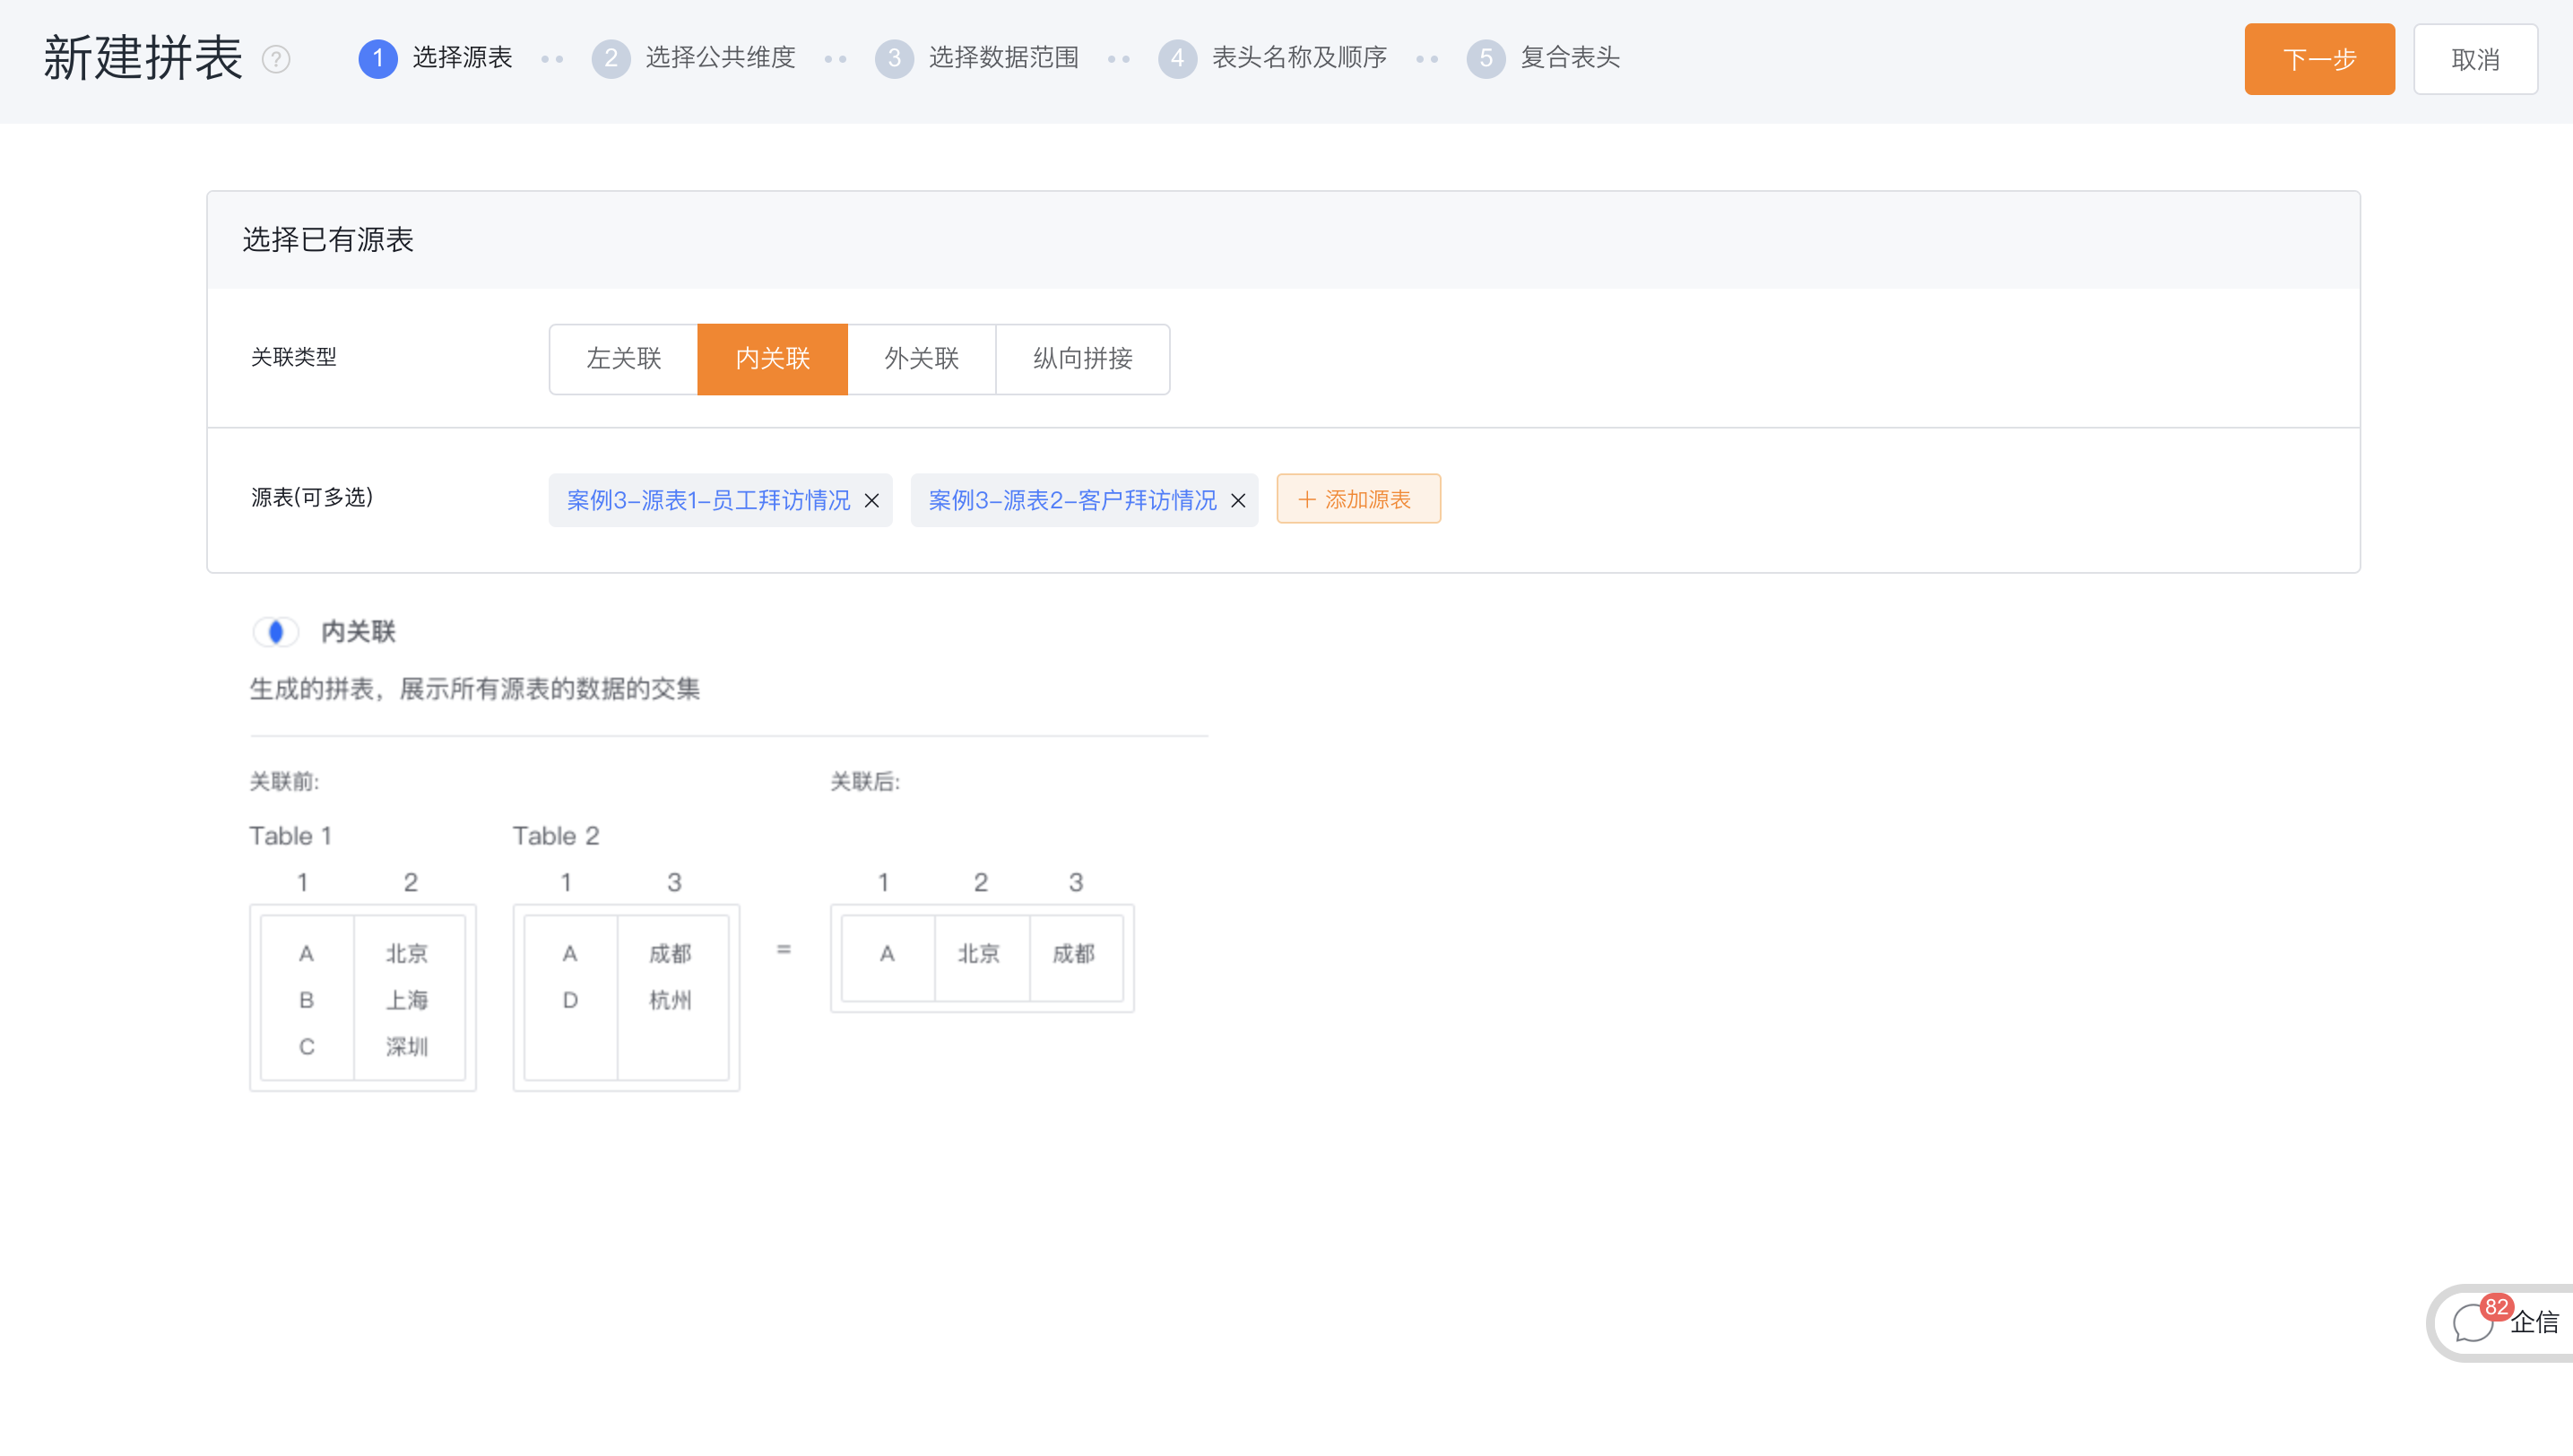
- Source table: the basic table configured based on BI reports and statistical charts, as the source of the combined table;
- Association type: the splicing method of each source table when splicing tables
- 1 Left association: left join, subject to the left source table;
- 2 Inner association: inner join, take intersection;
- 3 Outer association: outer join, take union;
- 4 Vertical splicing: Merge of all data rows;
- Case description: The dimension value "main department" of source table 1 and the dimension value "principal department of the person in charge" of source table 2 have the same meaning, because the dimension whose indicator is 0 is checked in the source table, and the association is now The type can choose internal association, and after the intersection of the two source tables, there are still those departments that need to be counted.
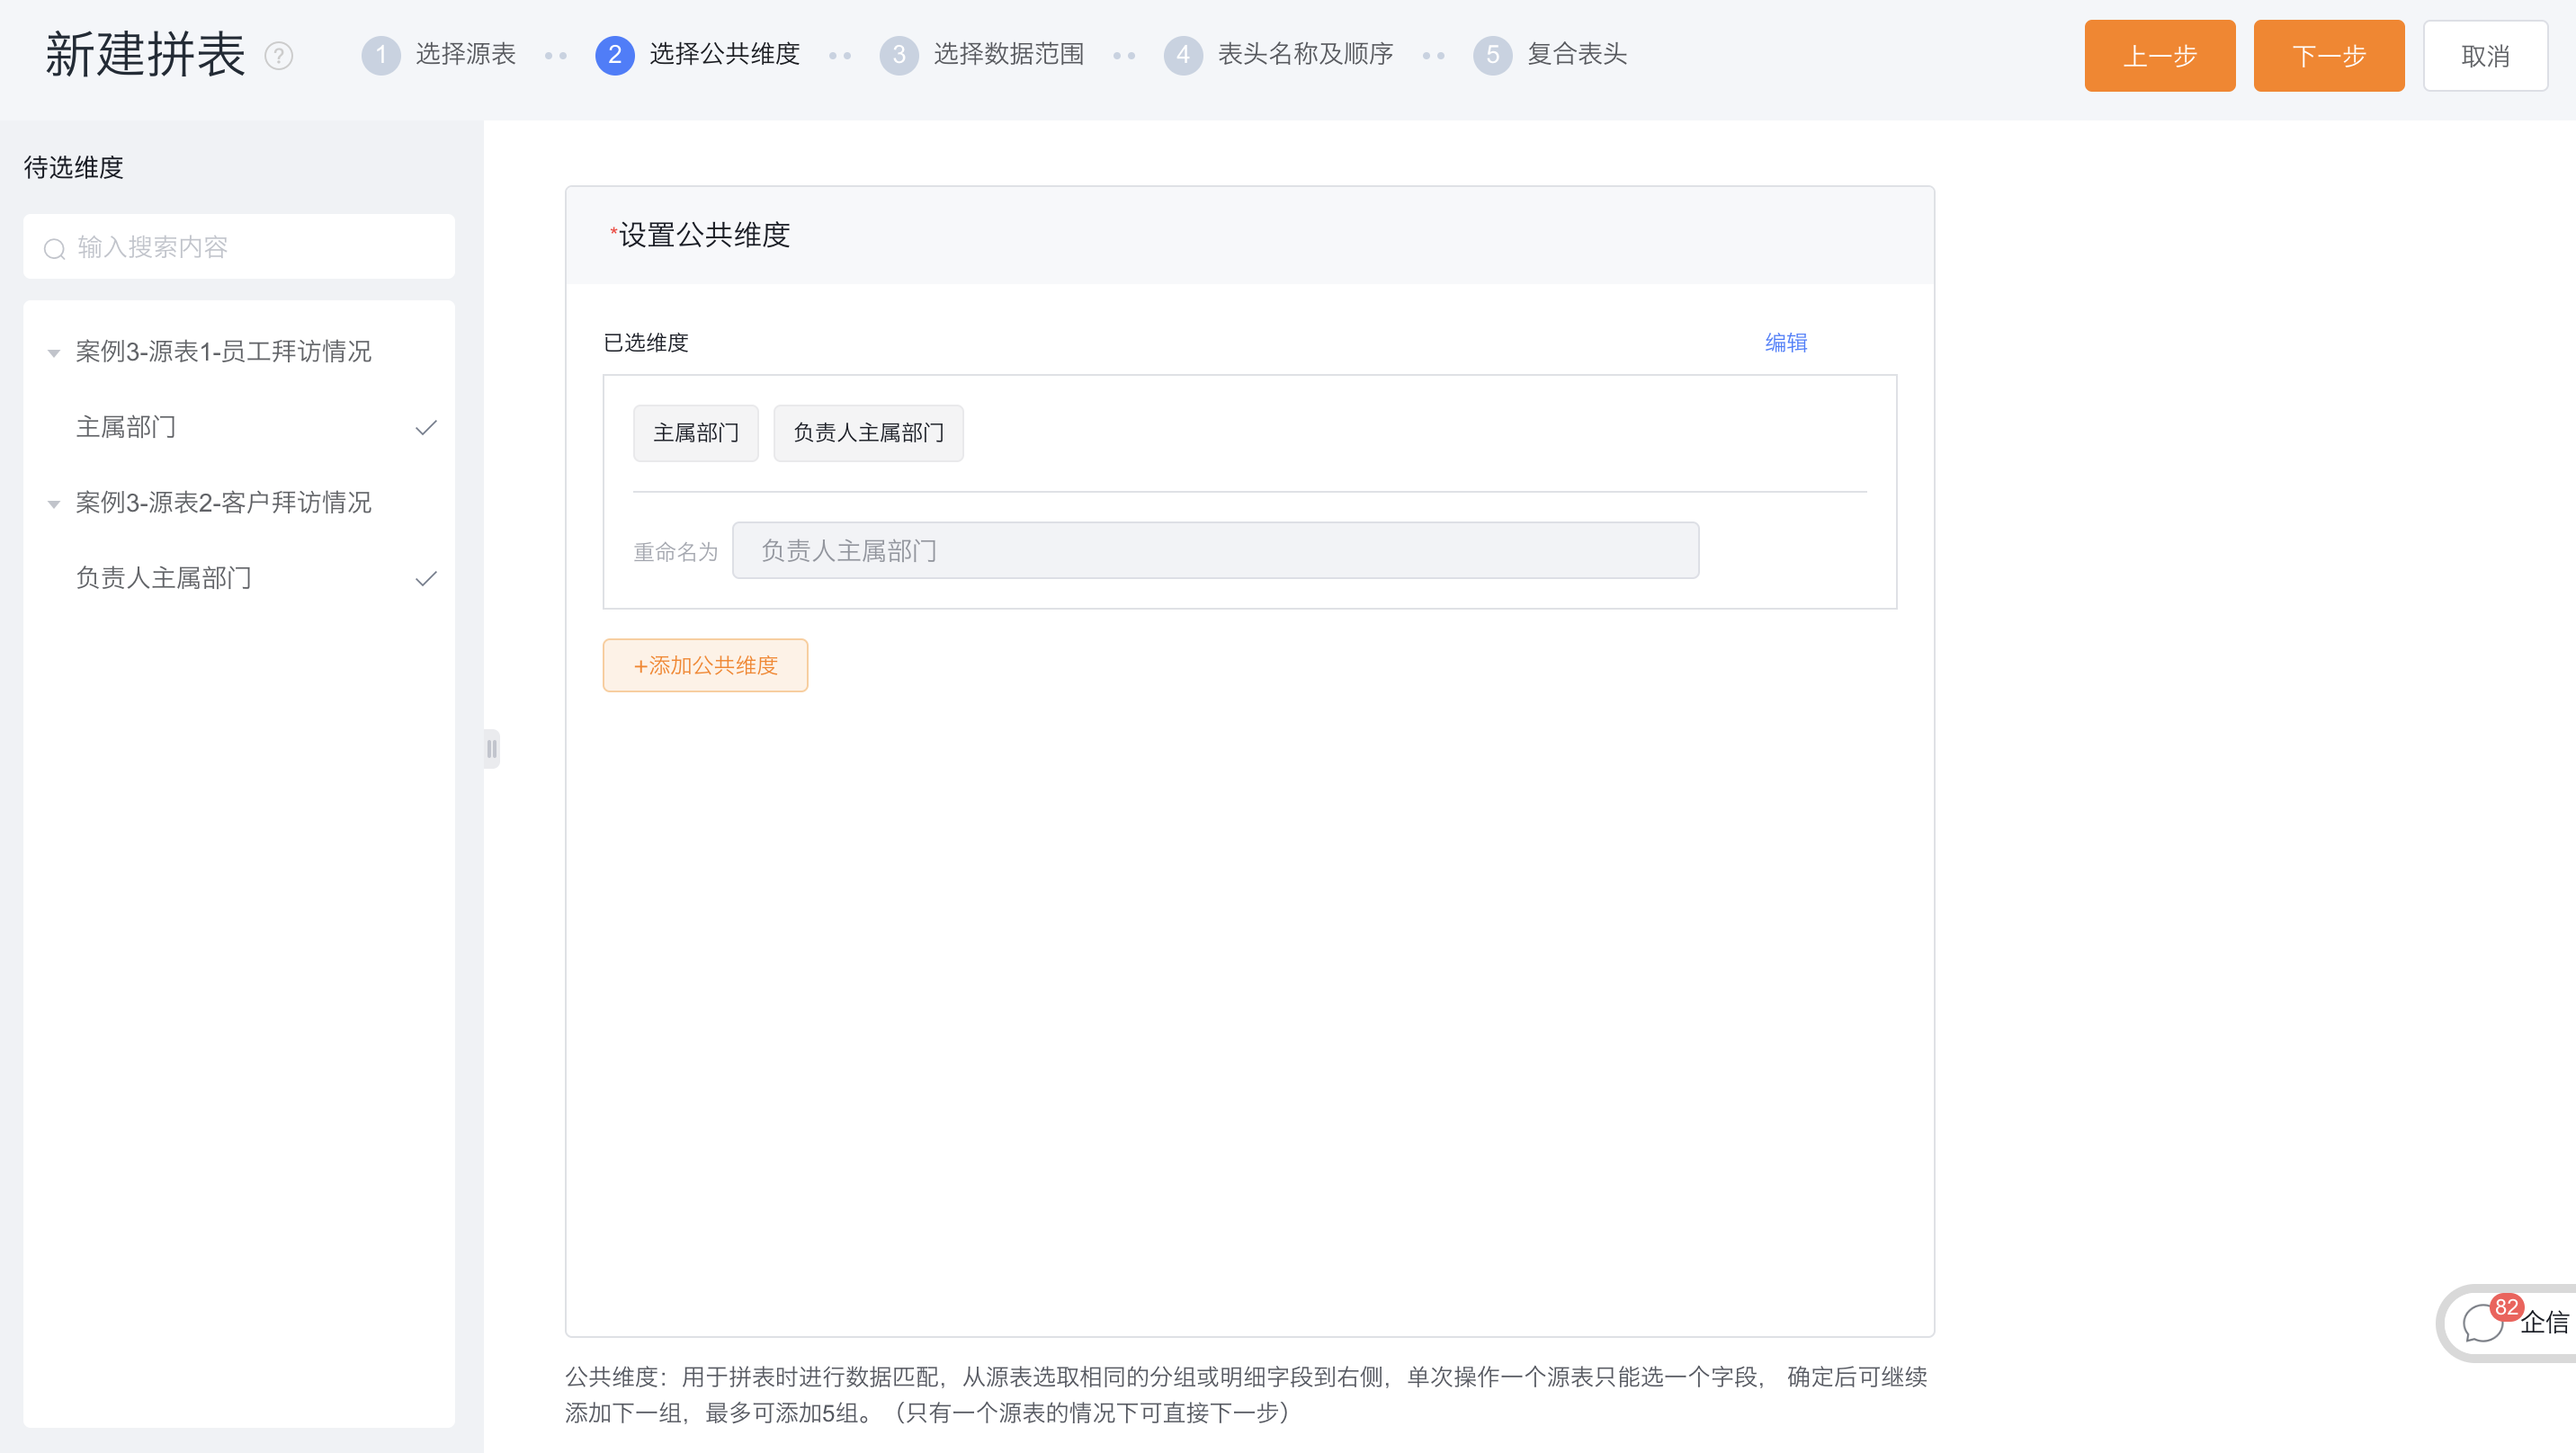
2.1.1.2 Select public dimension
- Common dimension: As the basis for splicing multiple source tables, generally the grouping/dimension fields with the same meaning in each source table click on the fields with the same meaning in each source table and add them to the right to form a set of common dimensions, which will be used as the splicing table Grouping/dimension fields, displayed by renamed field names.
- Case description: The dimension value of source table 1 is "Principal Department" and the dimension value of source table 2 is "Principal Department of the person in charge". "Department" and "Principal Department" in source table 2 are added to the public dimension on the right, and renamed to: "Principal Department", and click OK.
2.1.1.3 Select data range
- Add merged data range: the common data range of each source table is similar to the common dimension, click on the left to add to the right as a group. Clicking "Merge" means that it will eventually be merged into one filter condition to be used in the data range of the stitching table, and displayed according to the renamed field name. The default values for the filter can also be modified here.
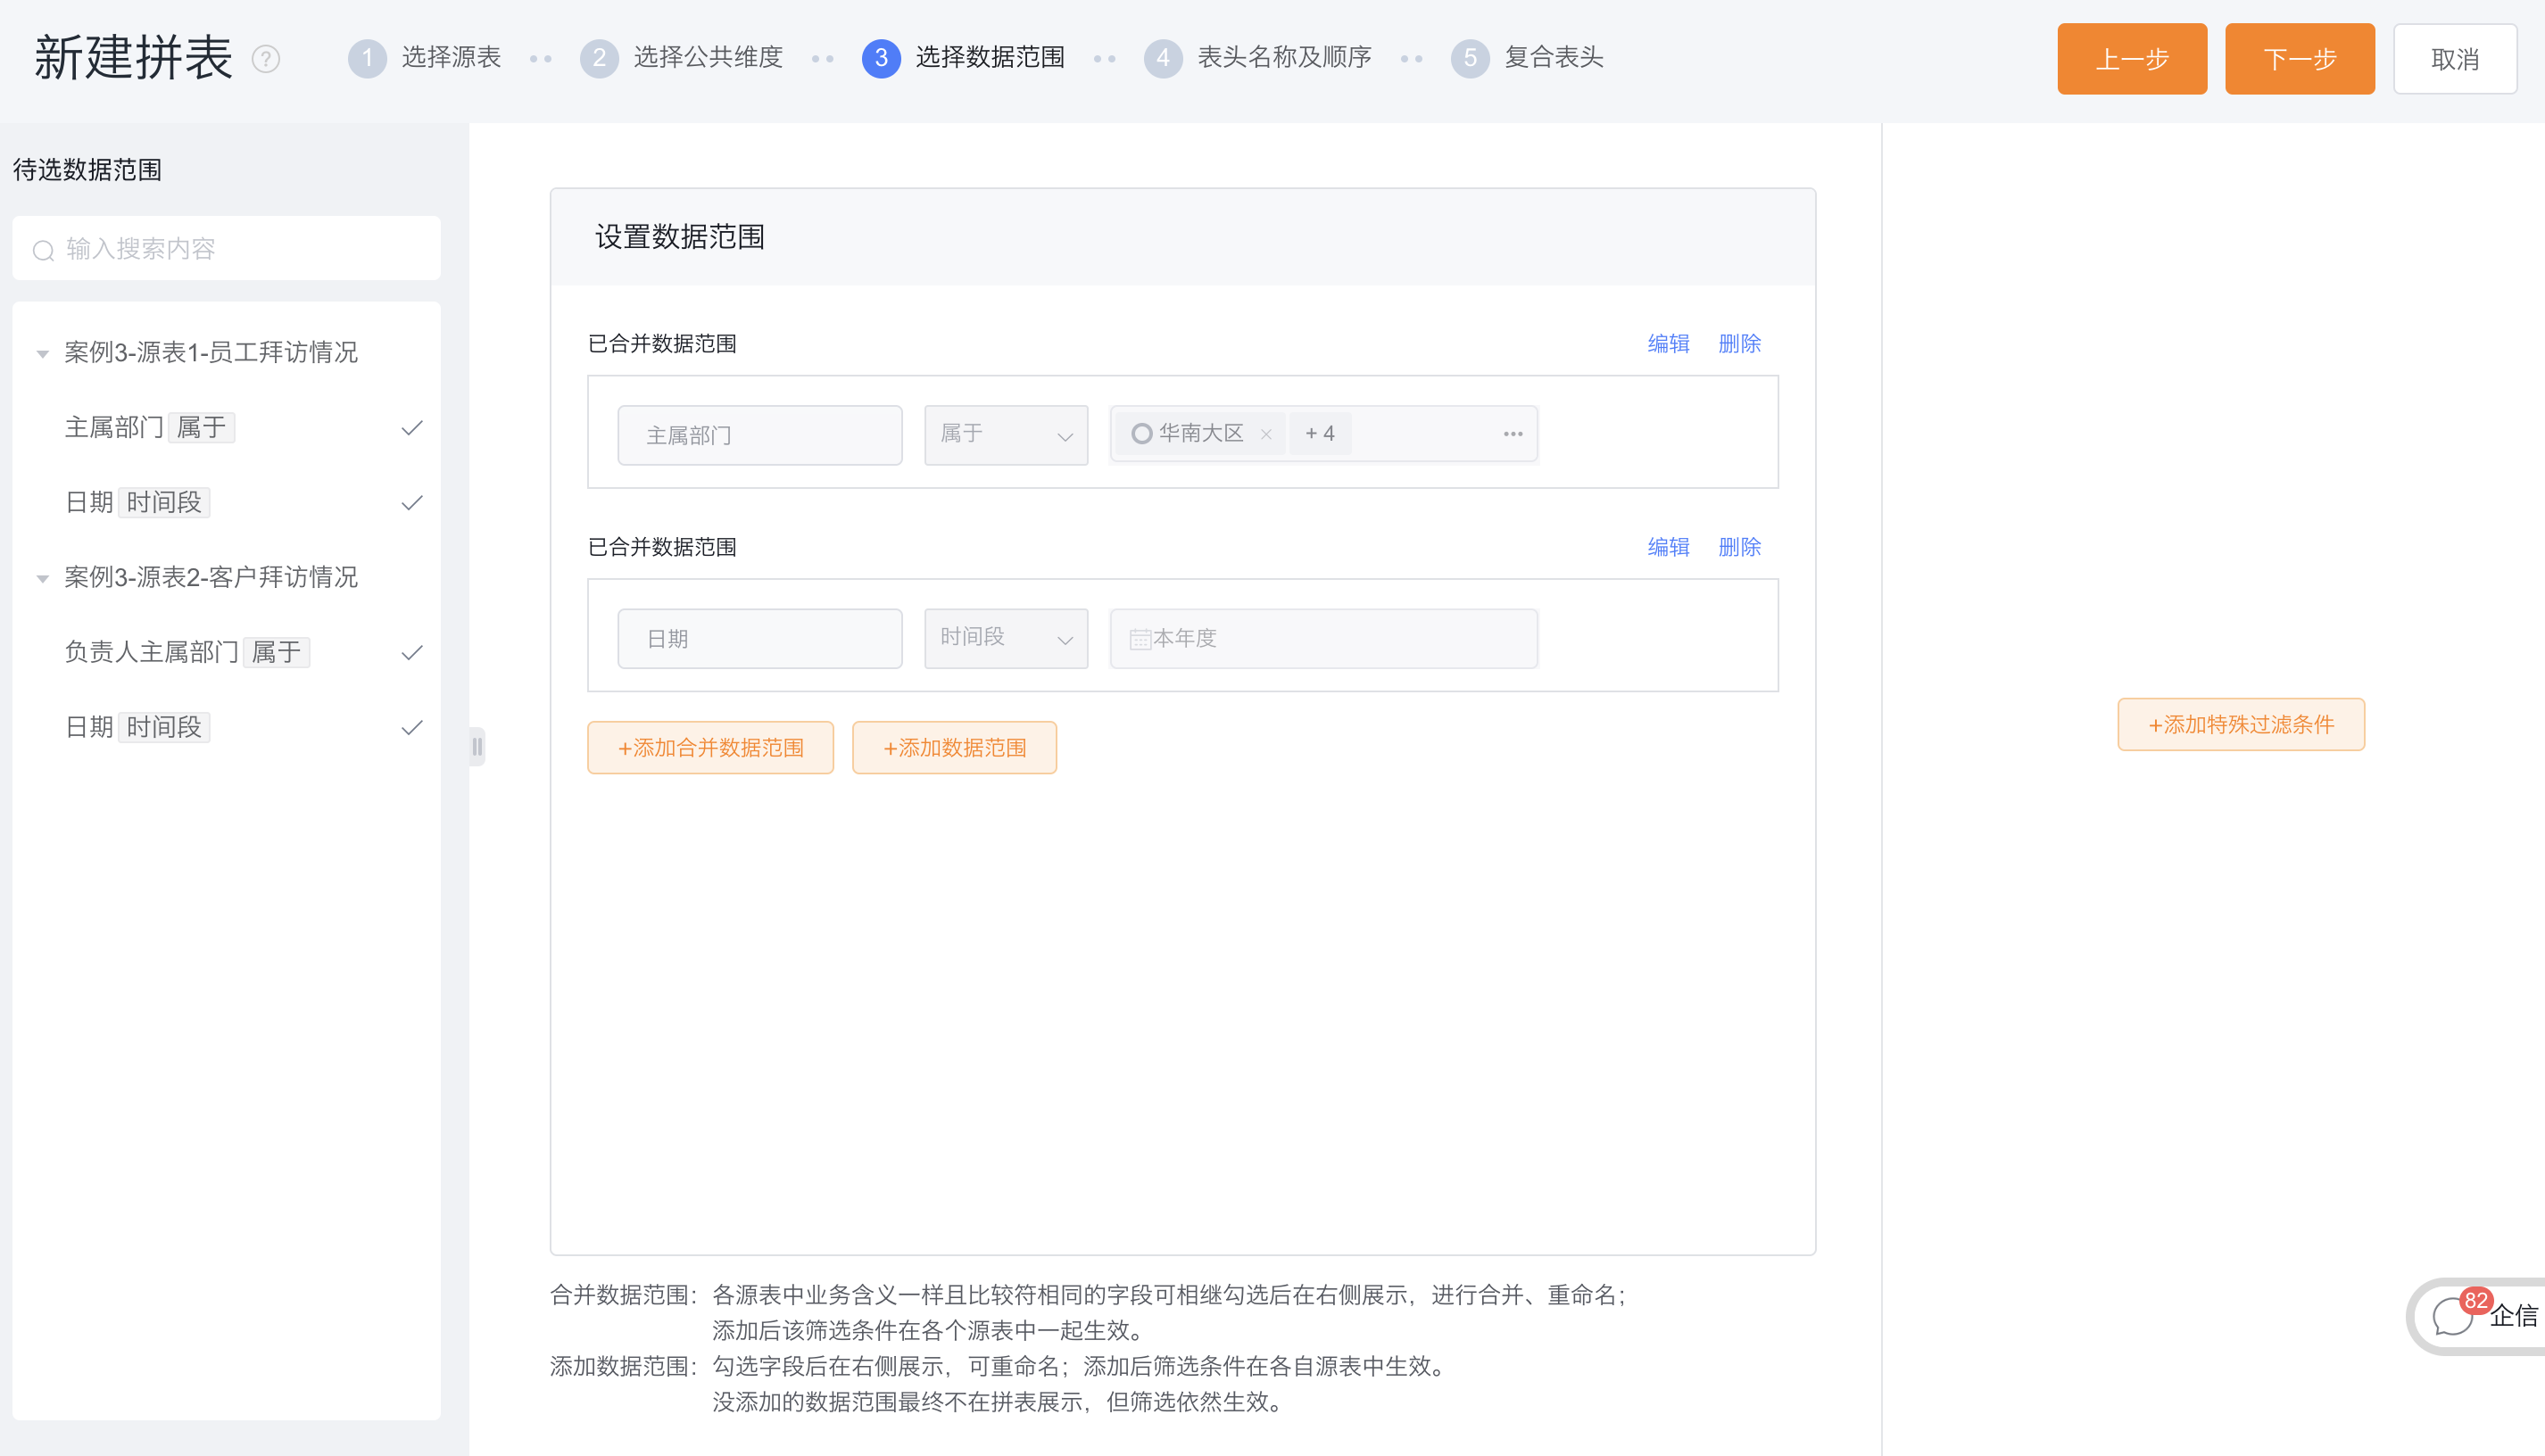
- Add data range: In addition to the public data range, other filter conditions, which need to be exposed in the data range after the table is assembled. Filter conditions that have not been added will not be displayed in the data range of the combined table, and will work according to the default configuration of the source table.
- Case Description: The date and the person in charge's main department are used as the public data range after the table is merged, and it works on the two source tables at the same time.
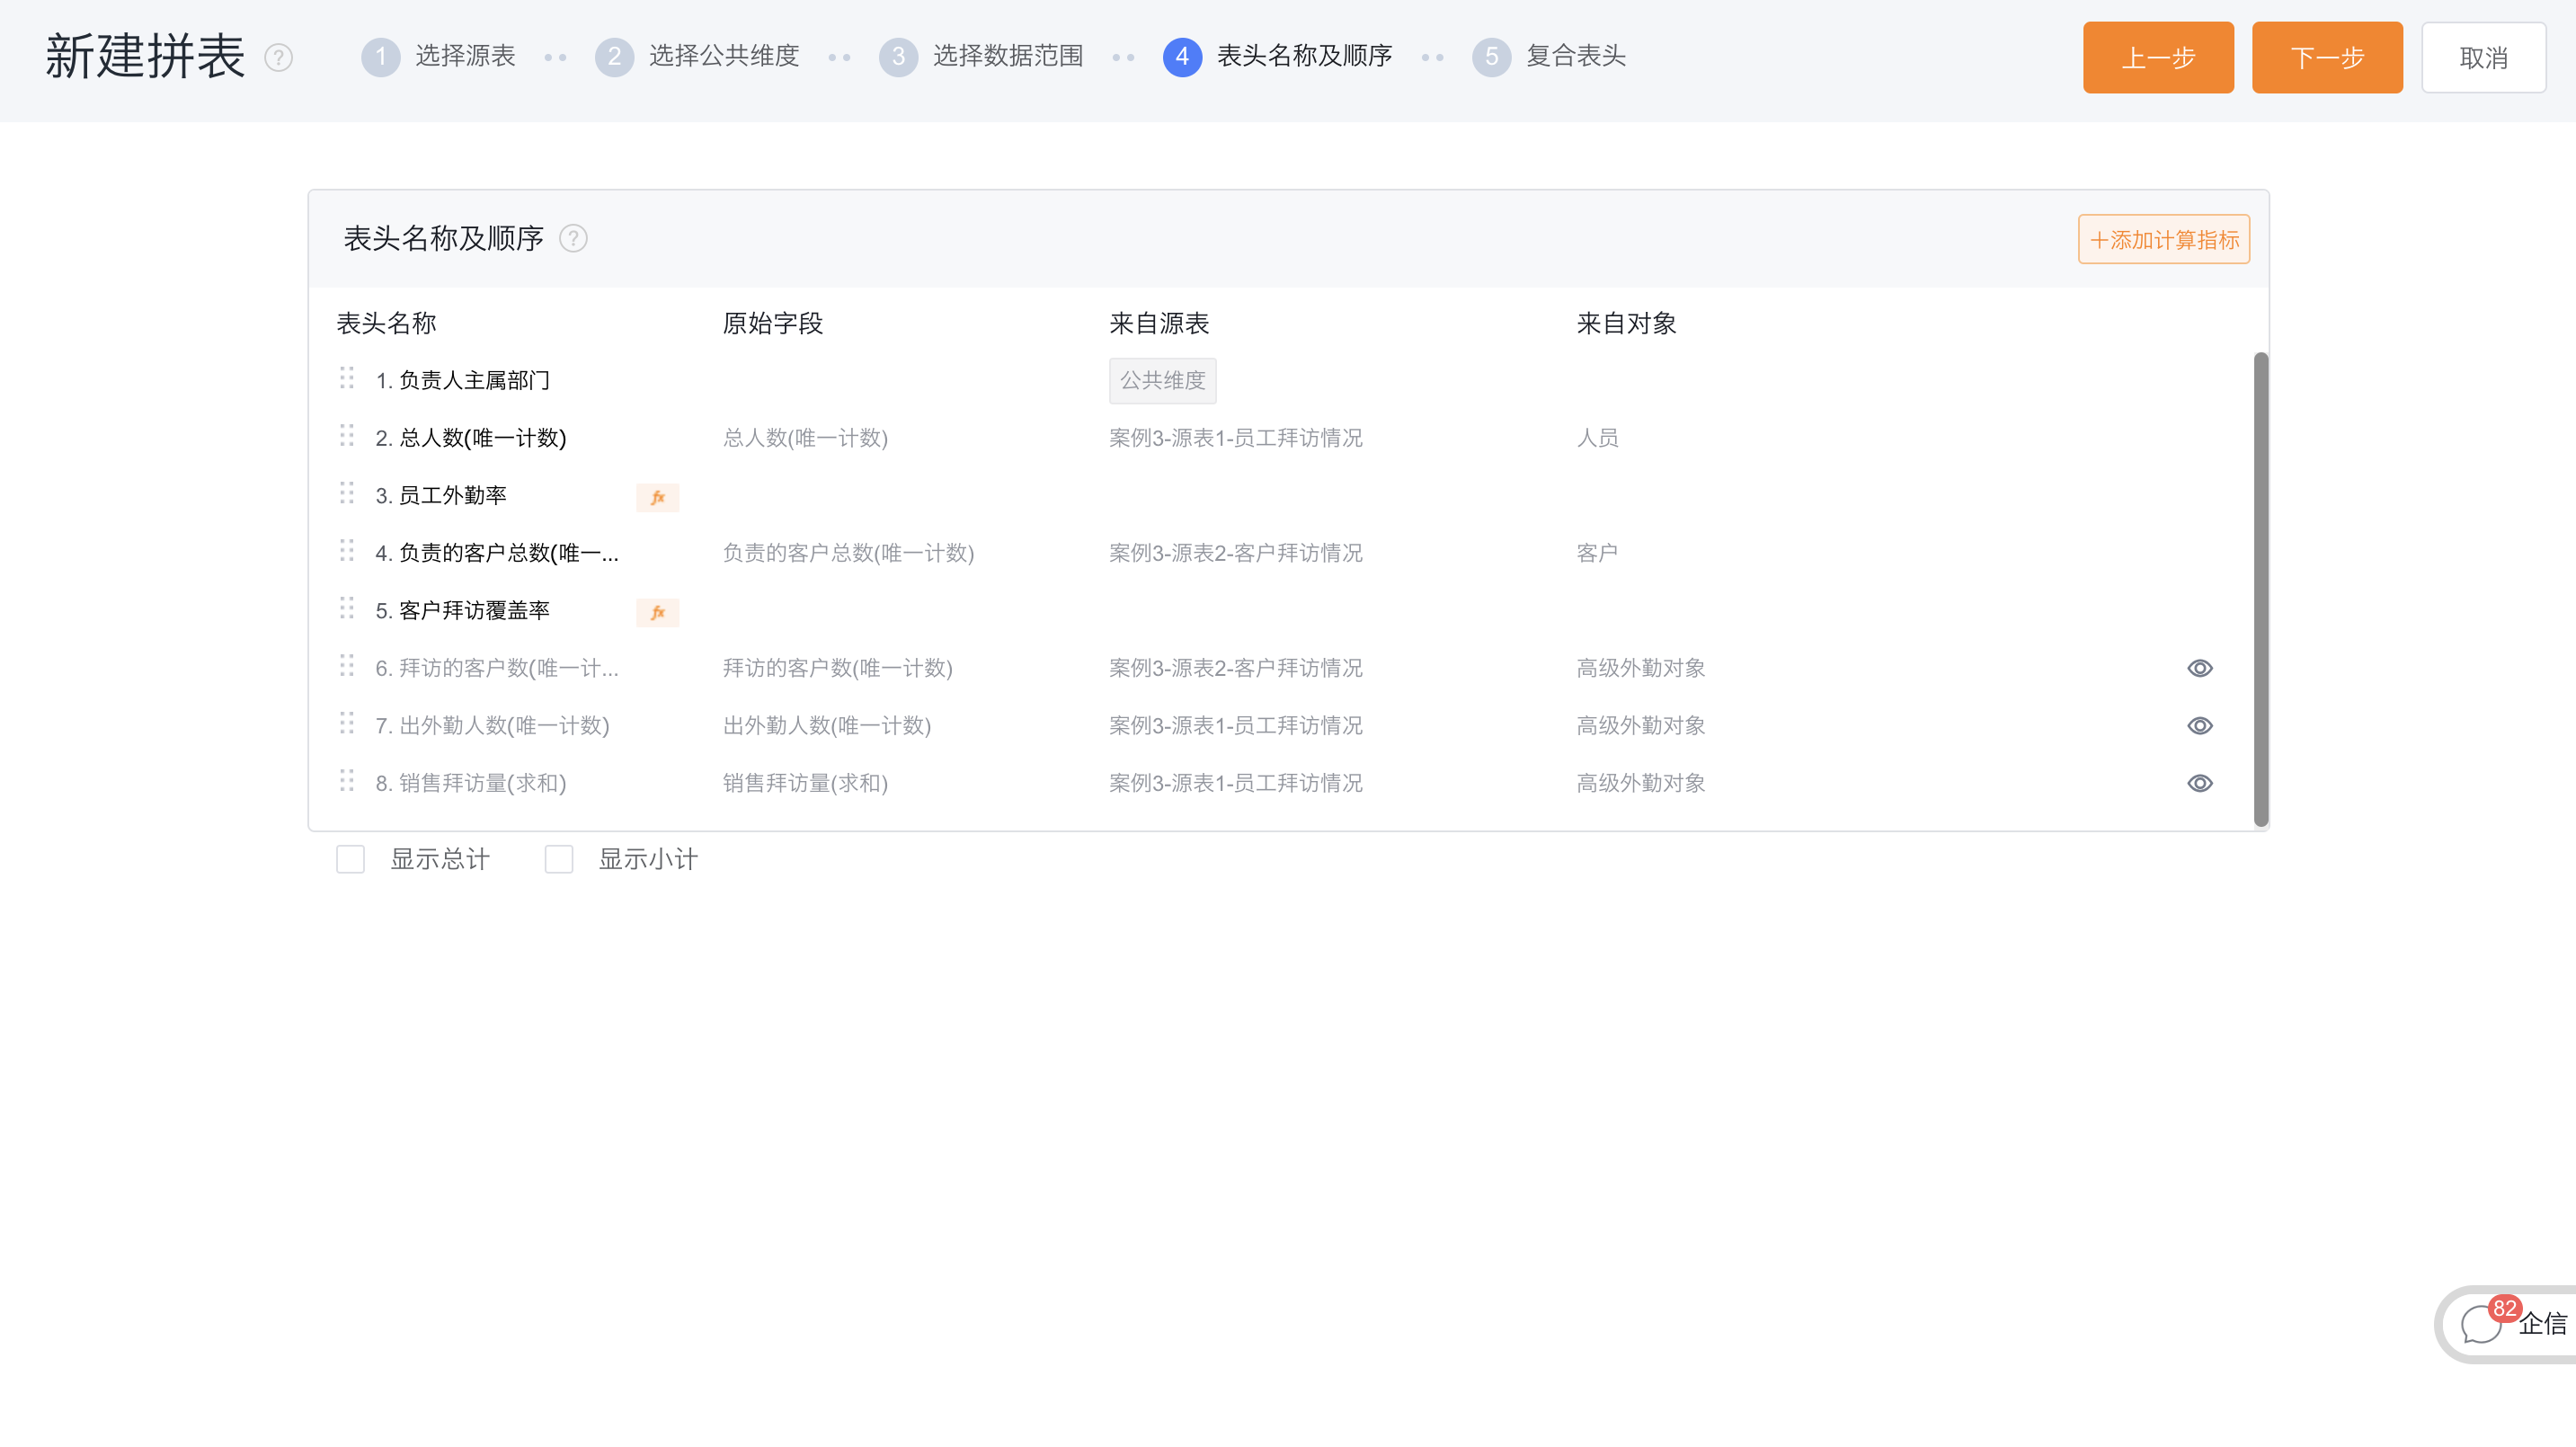
2.1.1.4 Header name and sequence
- Header name: The field name of the public dimension is displayed according to the setting in the second step, which cannot be modified here, and other field names can be modified as required.
- Adjust the order: Drag and drop to adjust the order of the columns, where the common dimension must be at the front and cannot be adjusted.
- Add and hide columns: You can add calculated indicators as new columns; you can hide columns that don't need to be displayed in the spelling table.
- Case description: Add two calculation indicators: employee field attendance rate = number of people who go out to work / total number of people, customer visit coverage = number of customers visited / total number of customers in charge, and finally do not need to be displayed in the list (only use for calculation) indicators are set to hidden.
2.1.1.5 Composite header
-
Composite header: Display the title and order of the headers adjusted in the previous step, and add multiple layers of composite headers to the top.
-
operate:
Add row: add a new row above; Delete row: delete the selected row; Merge cells: Merge multiple cells in the mouse circle; Split cell: split the merged cell back to the original cell; Compact mode: compact mode can be set; Back: Go back to the previous step; Modify column width: Click the original header to modify the column width; Modify the display name: Click the added grid to modify the display name; -
Case description: The hidden columns will not be displayed in the final header, and there is no need to add a composite header, just save it directly.
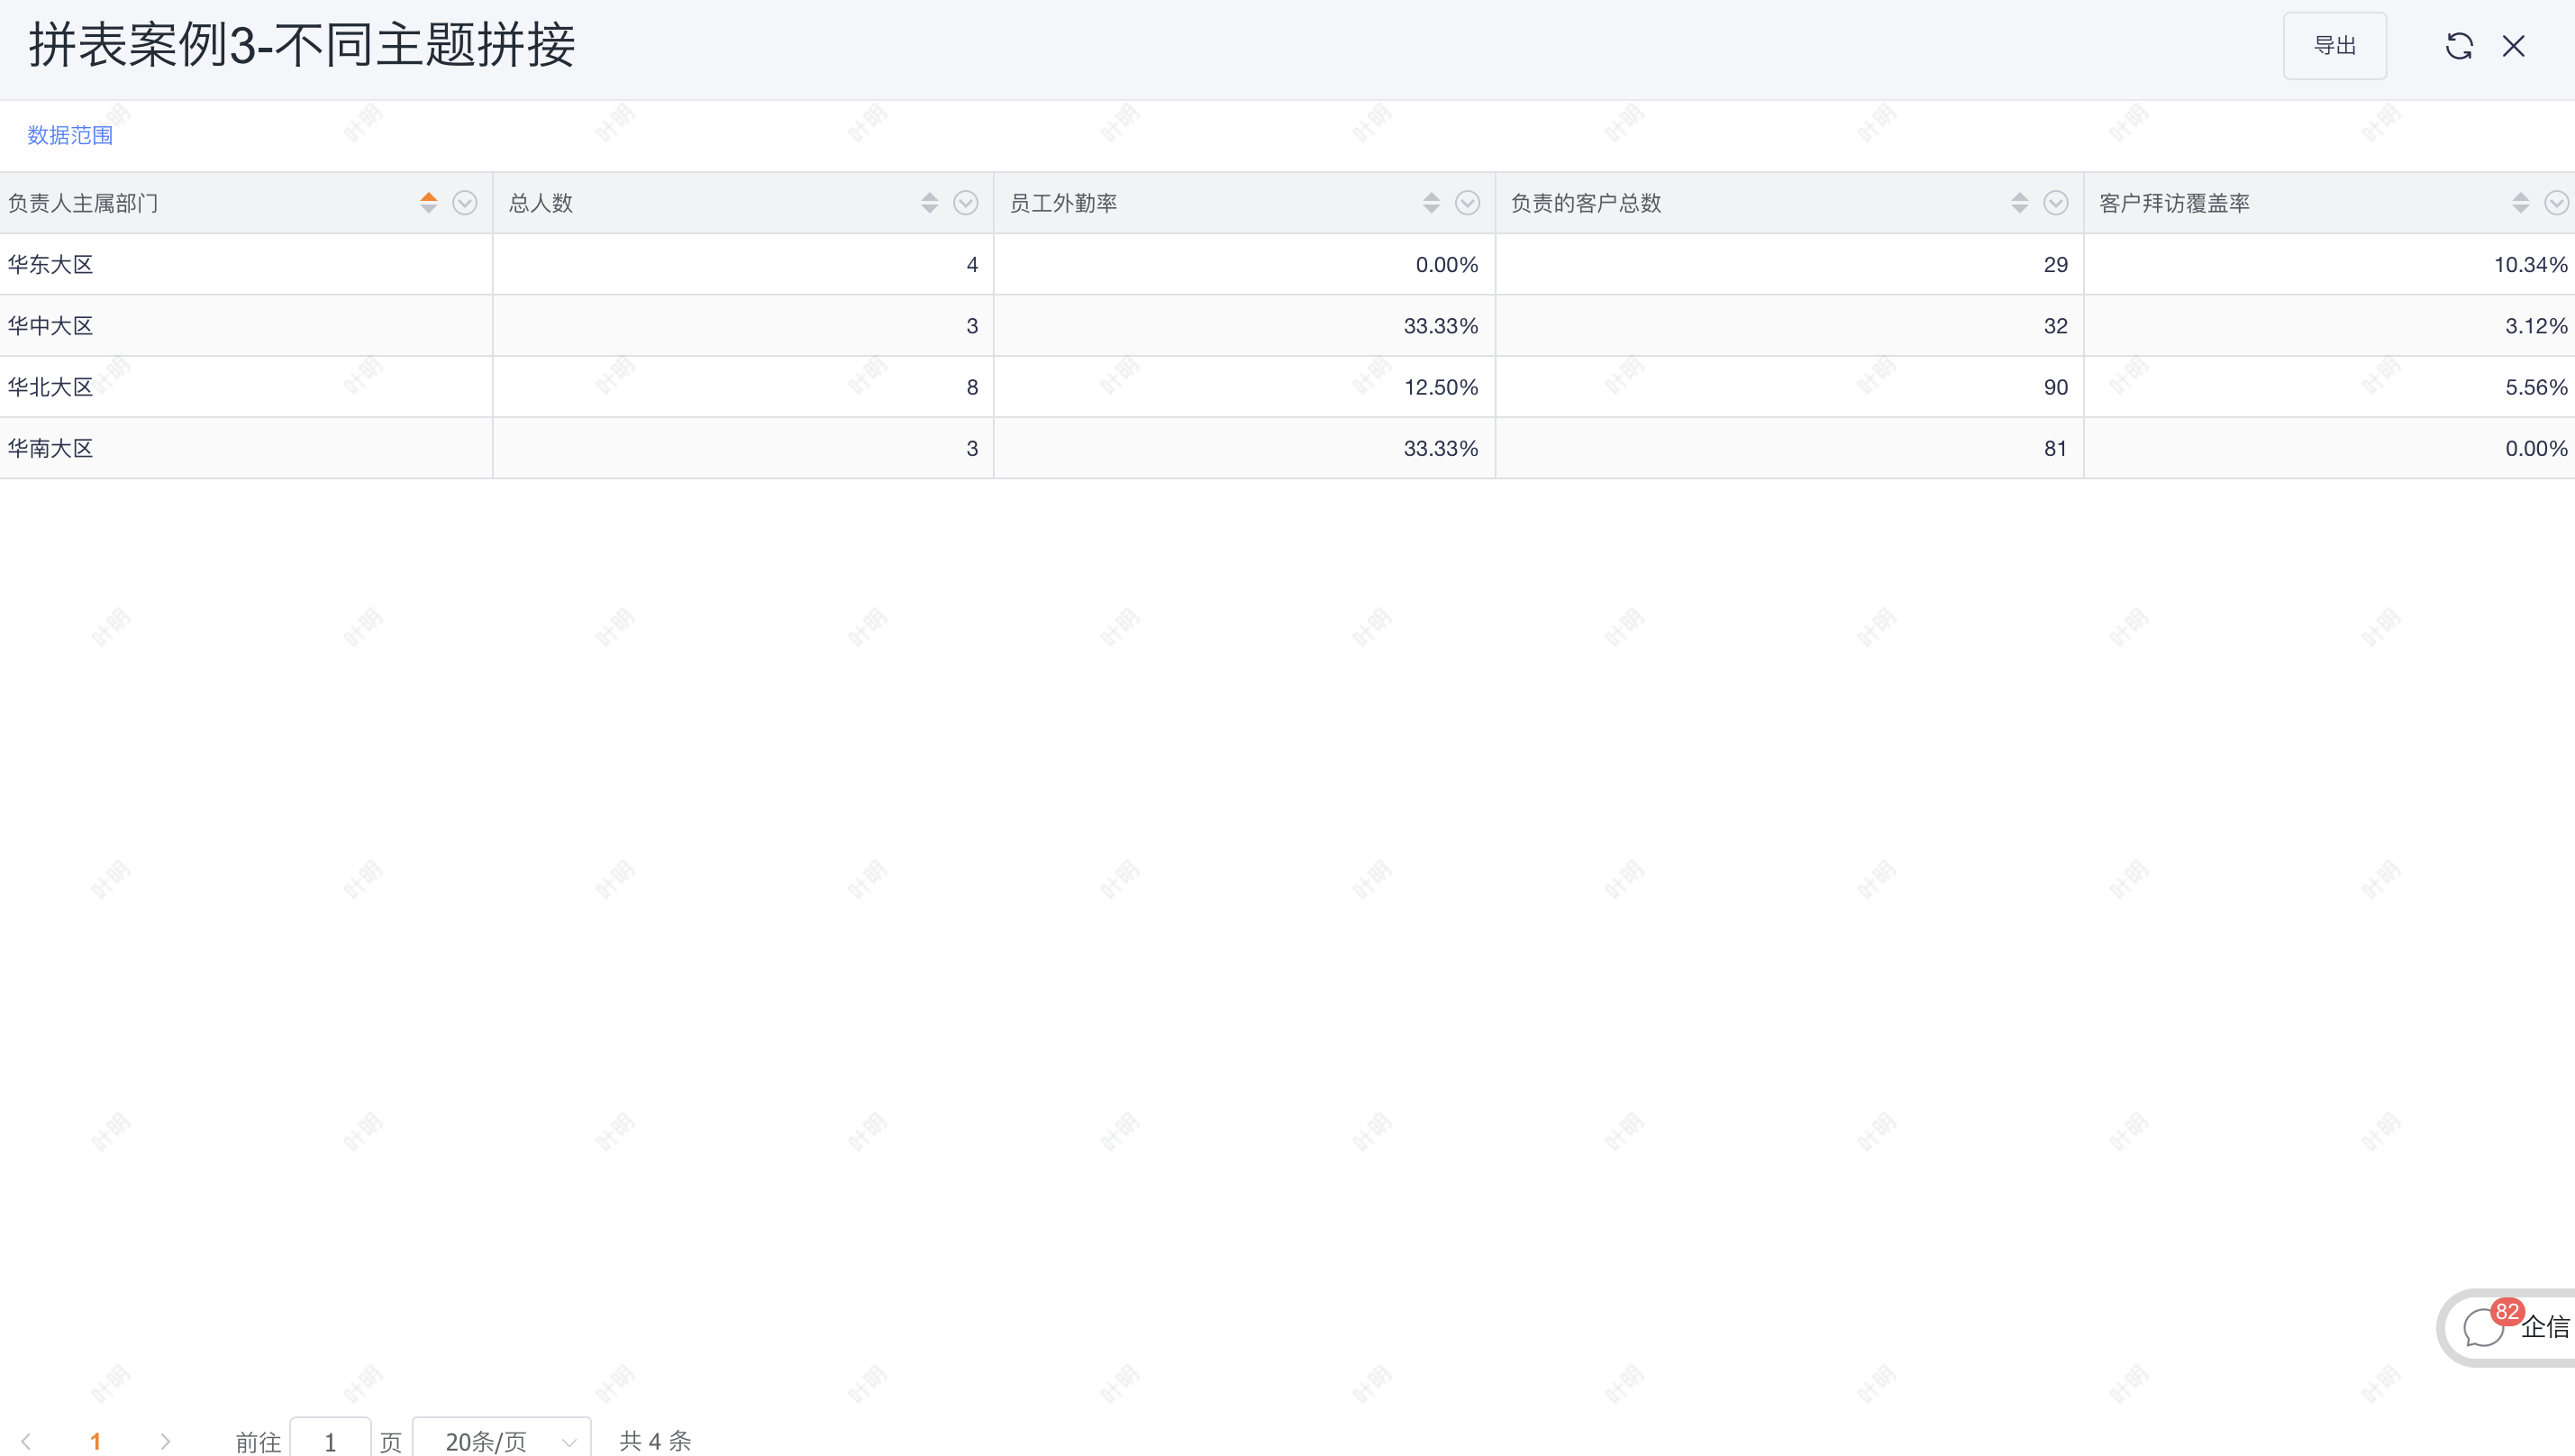
2.1.2 Table spelling results
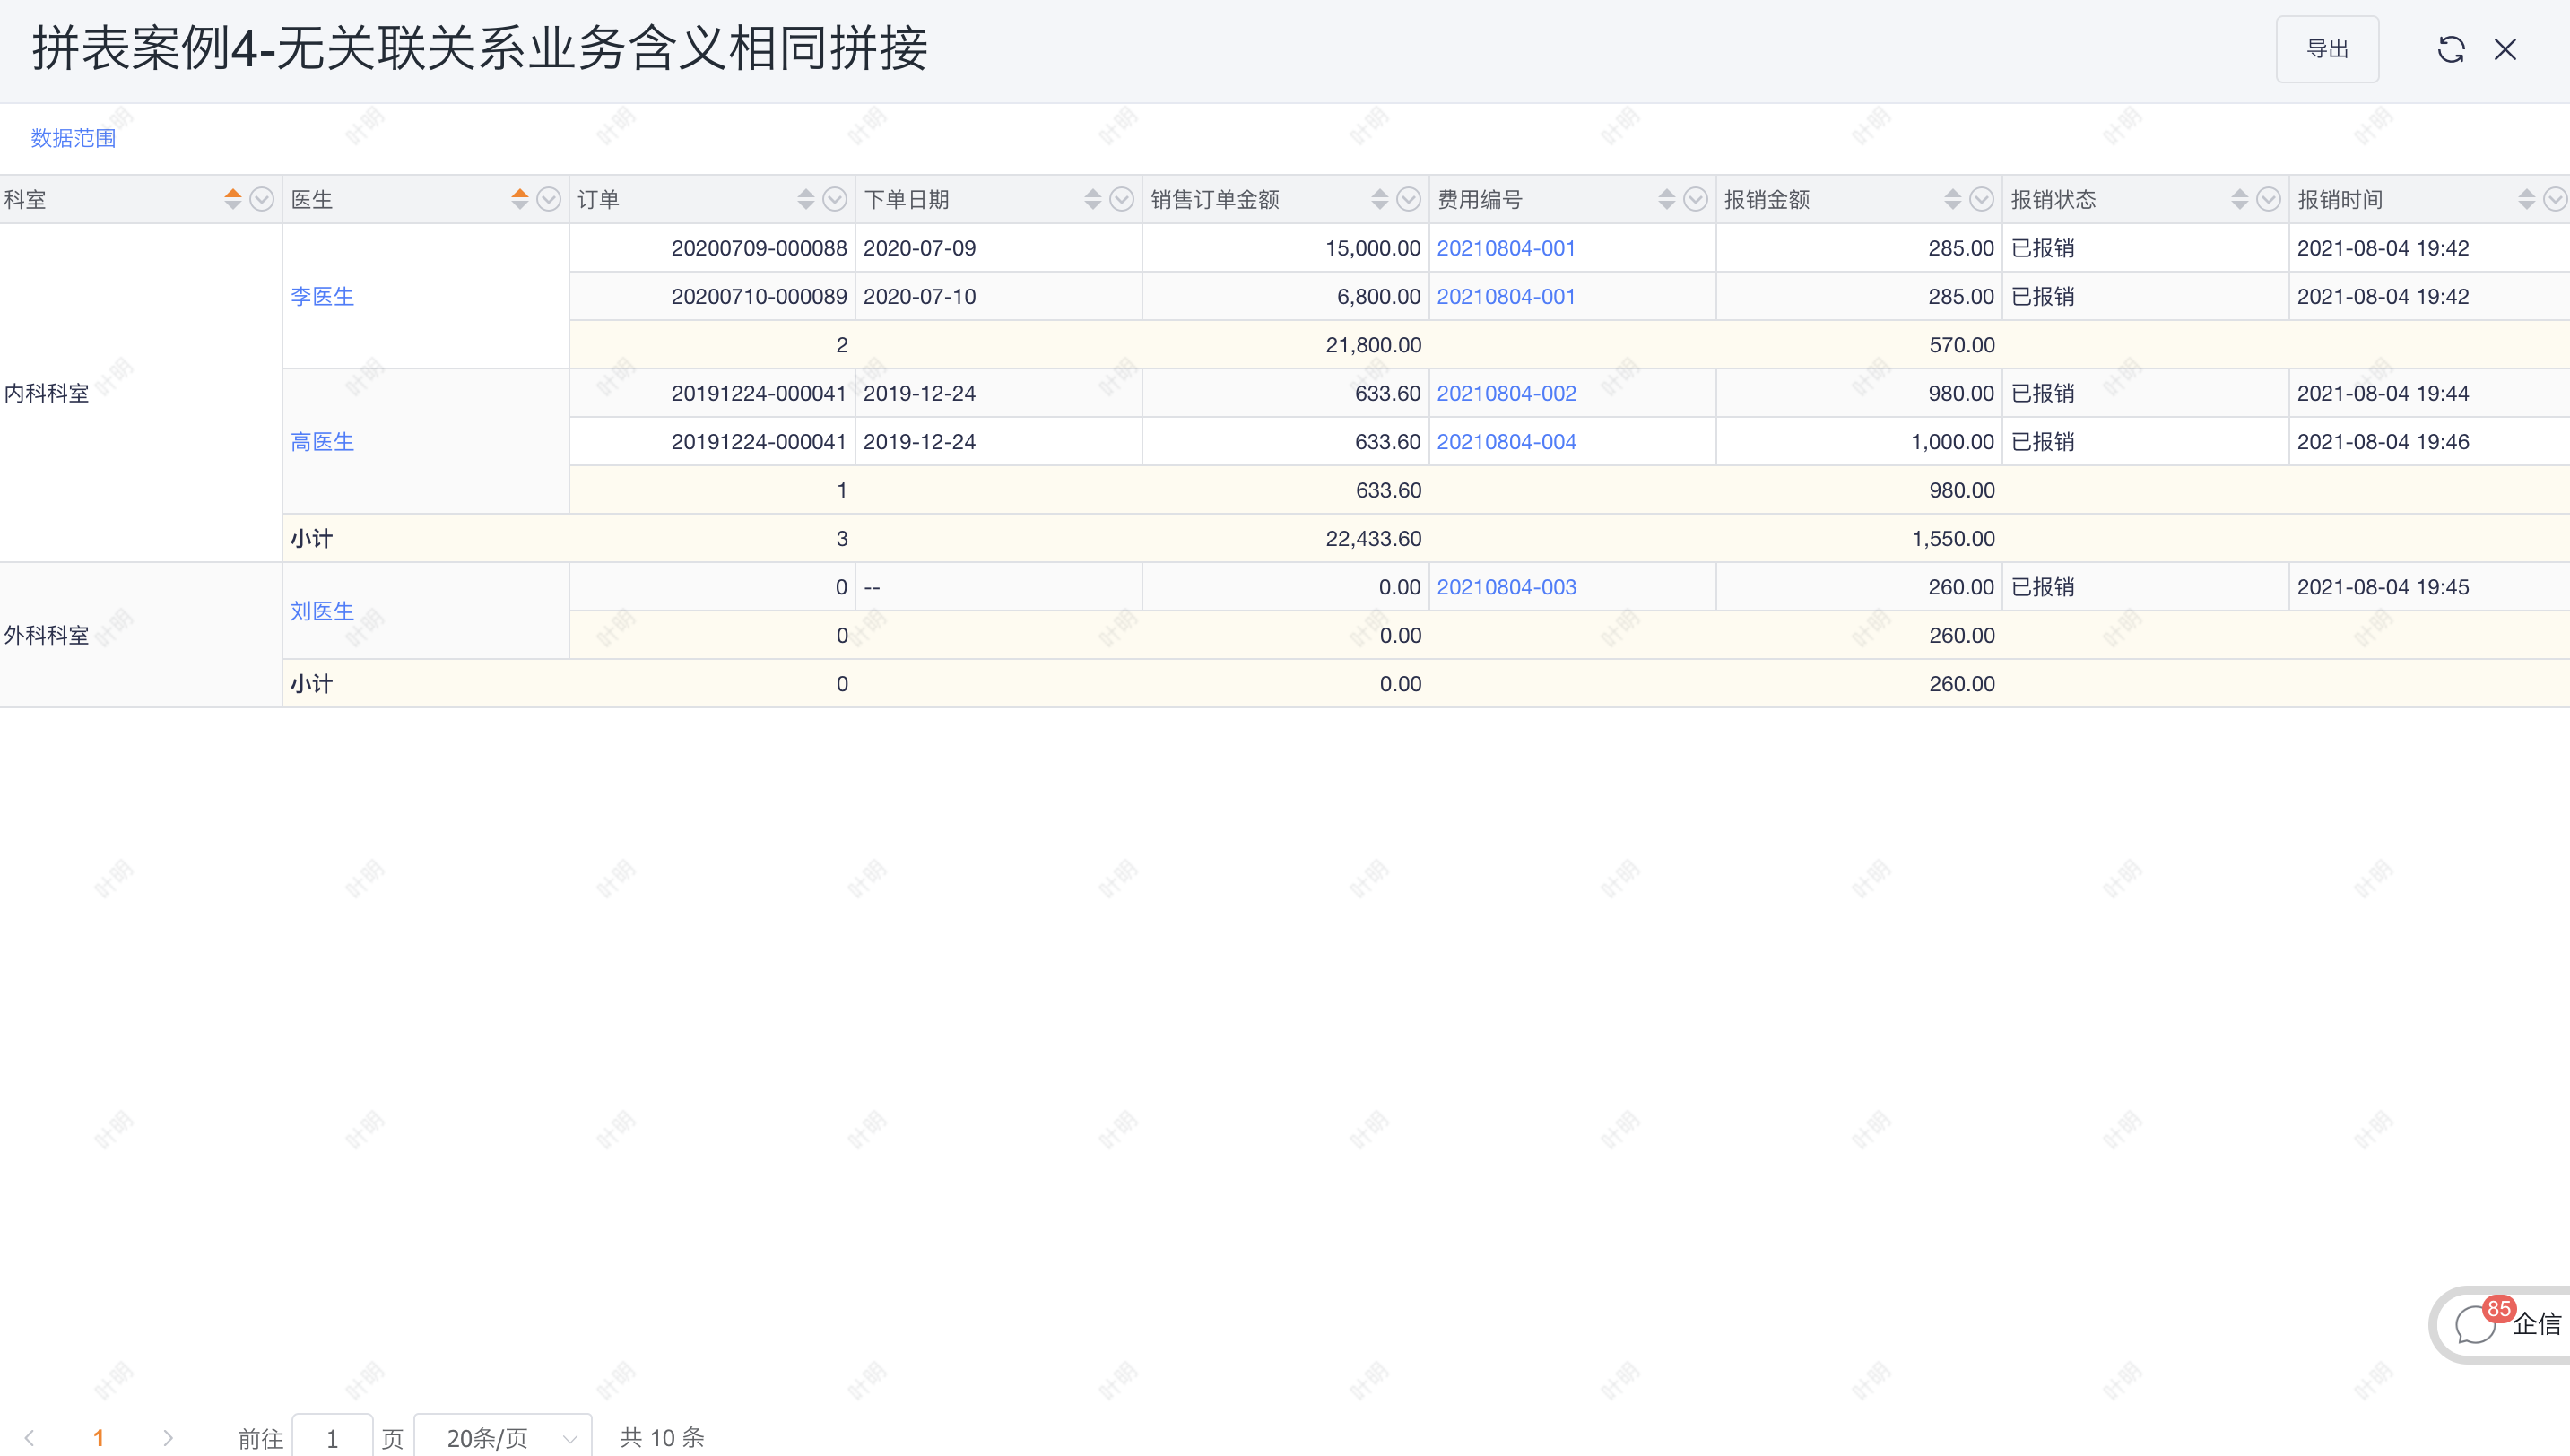
2.2 Case 4: No relationship but the same business meaning splicing
-
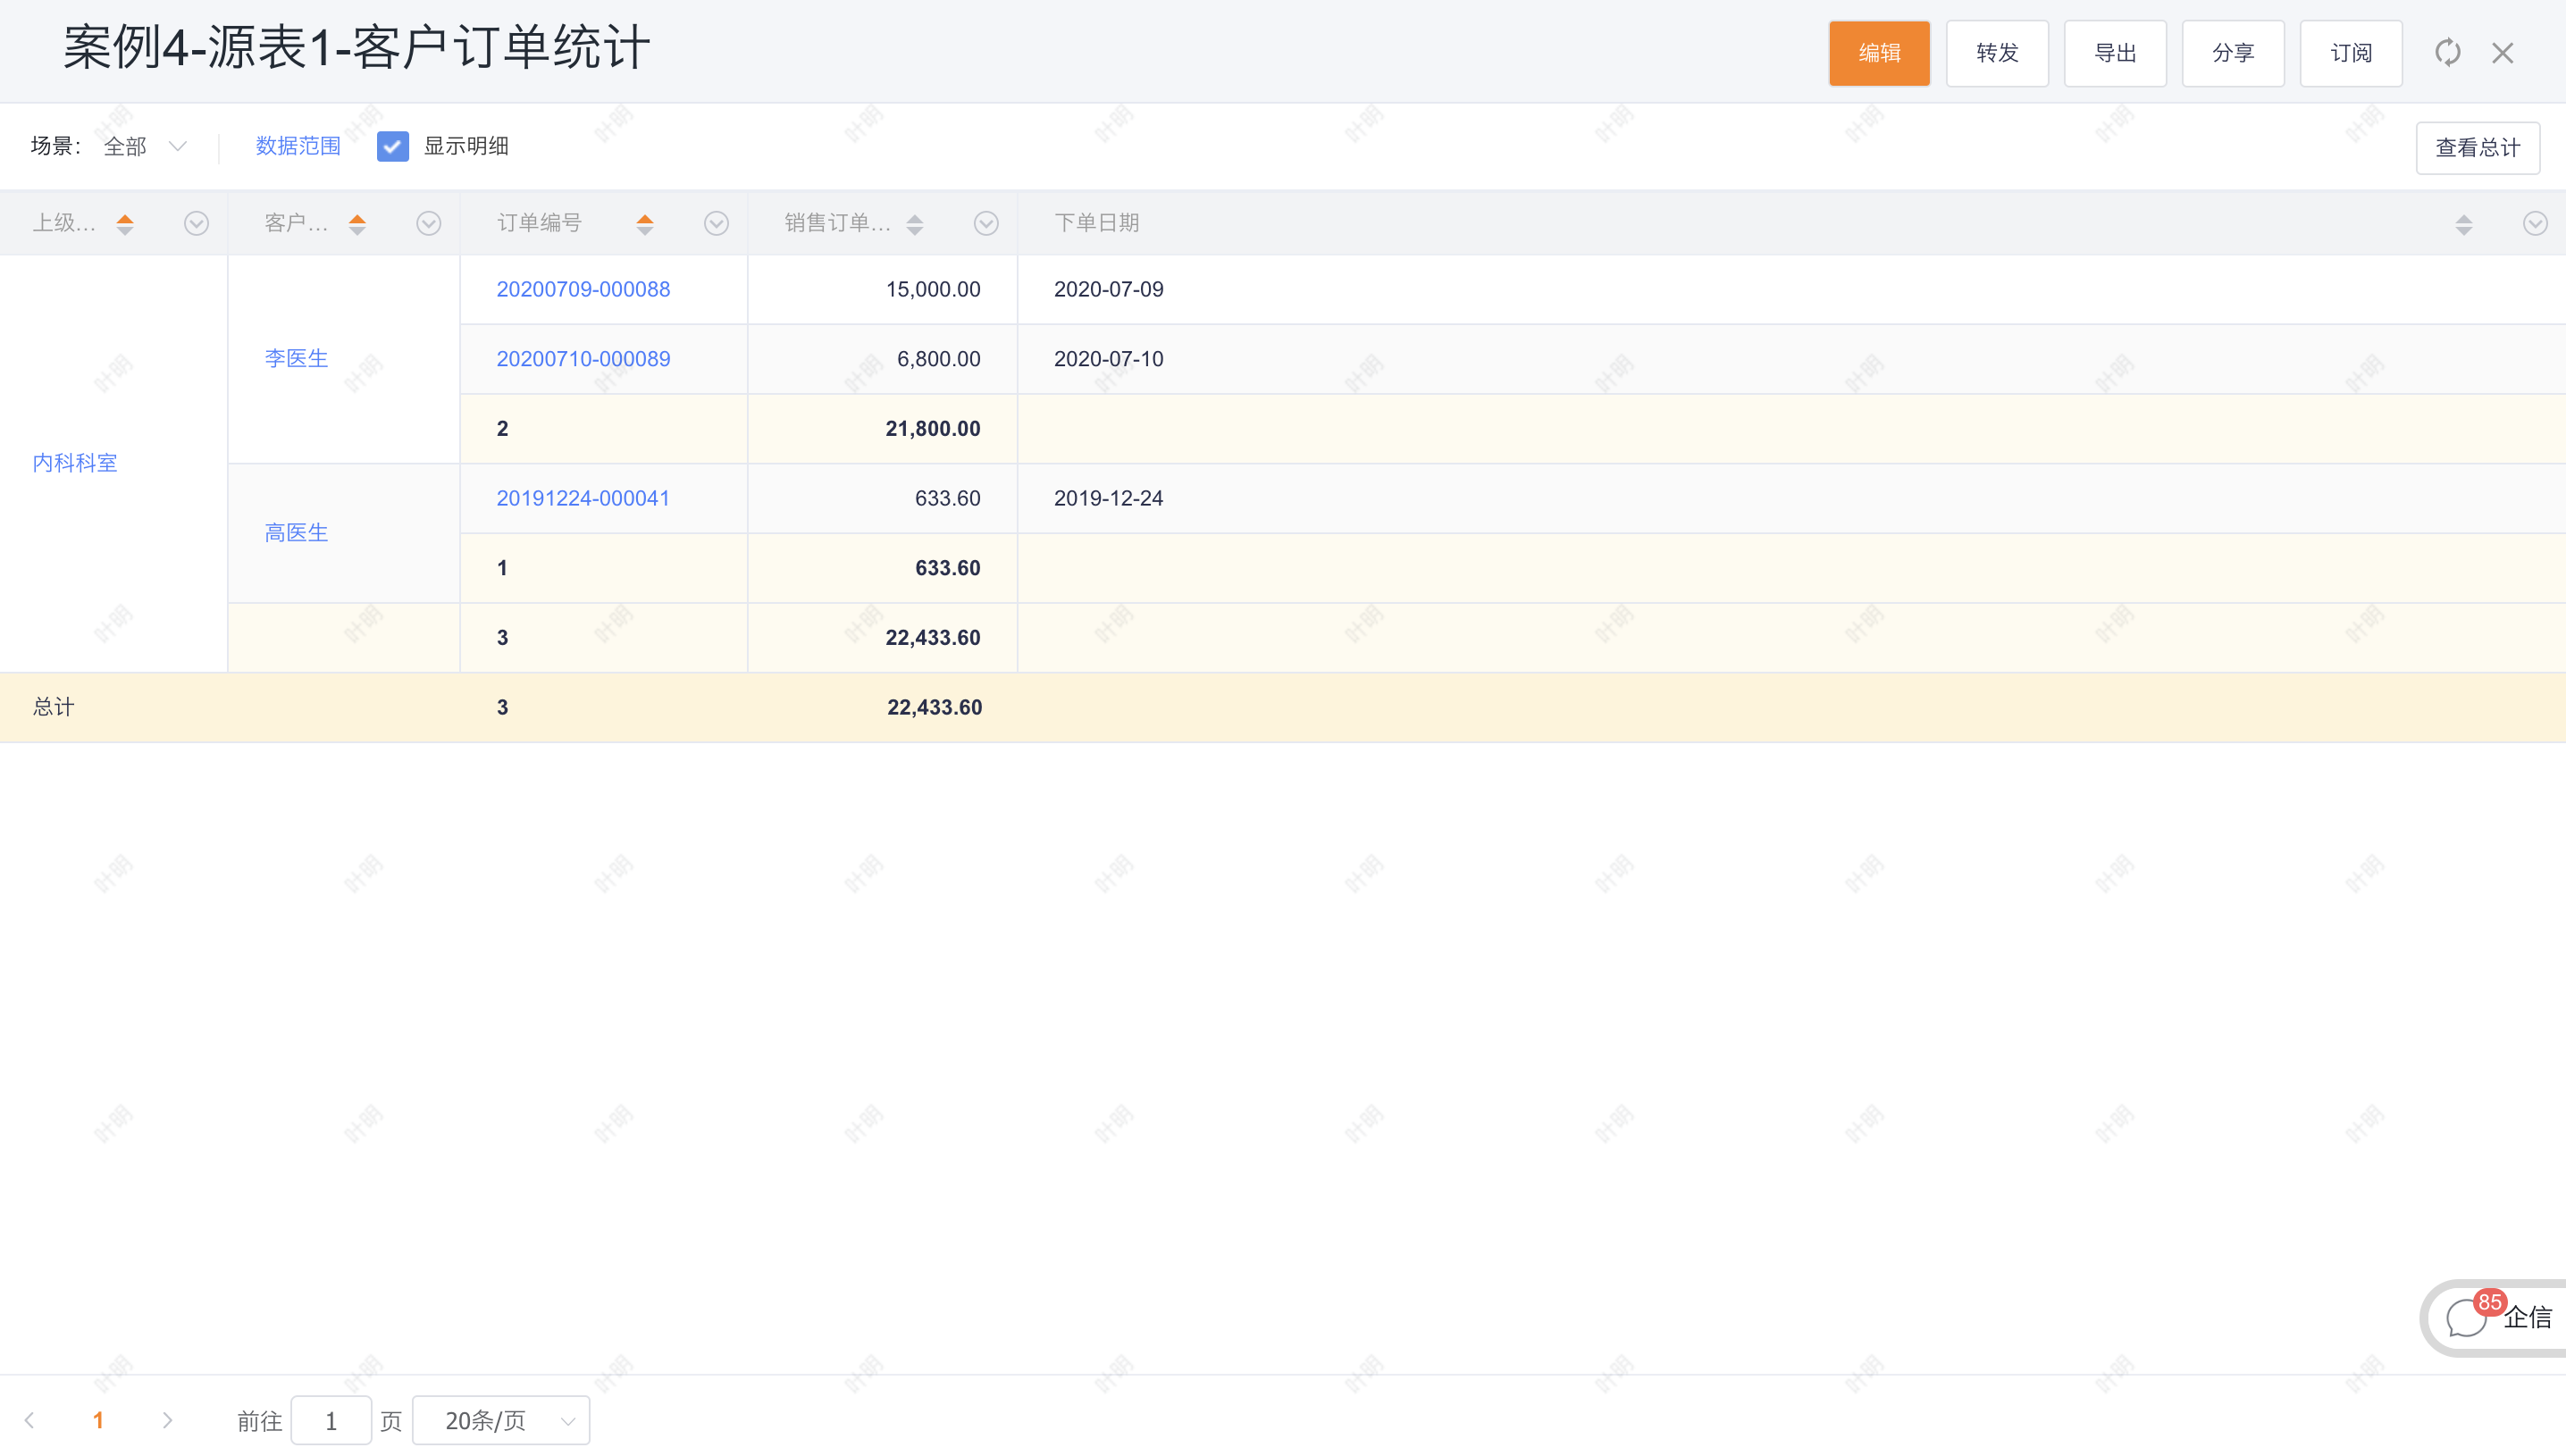
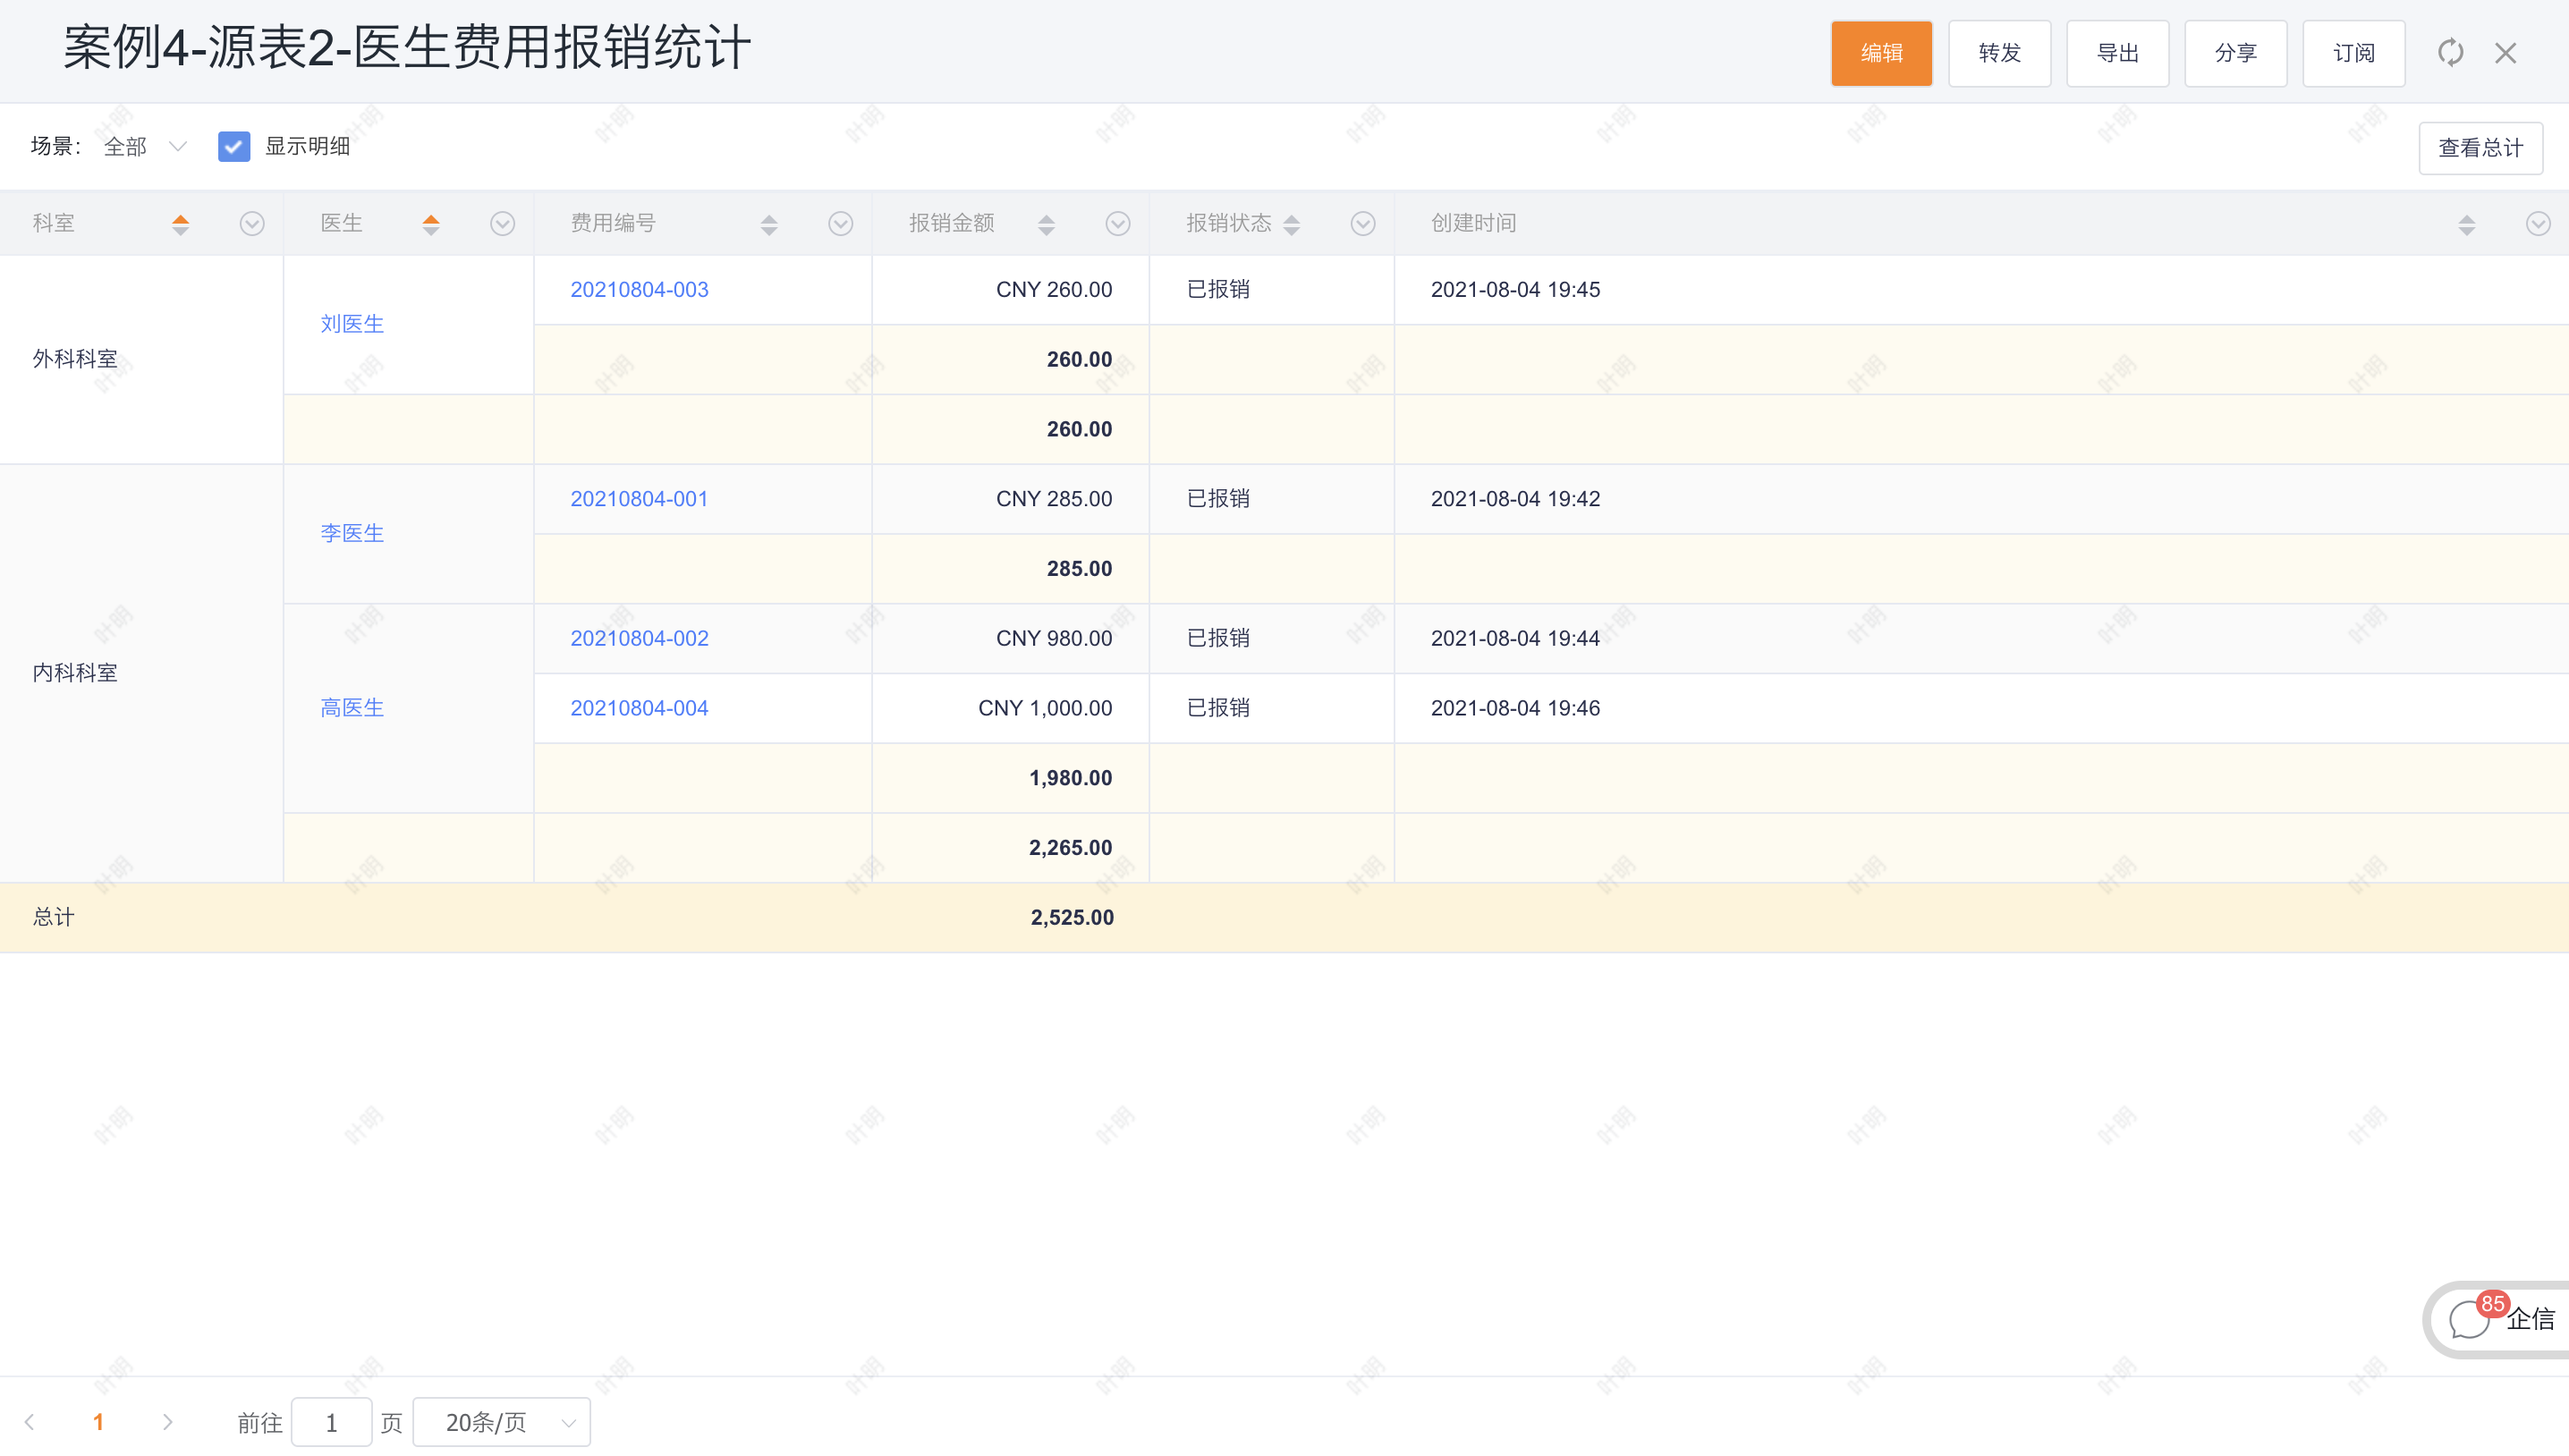
Core appeal: The customer name on the customer object refers to the name of the doctor, and the superior customer refers to the department of the doctor. The order object is associated with the customer, which has the same meaning as the doctor and department fields on the doctor custom object, but the two objects are not related Relationship, the expense object is associated with the doctor's custom object, and it is hoped that the order amount and the expense reimbursement amount will be counted from the dimensions of the department and doctor
-
Source table configuration:
2.2.1 Configuration process
2.2.1.1 Select source table and association type
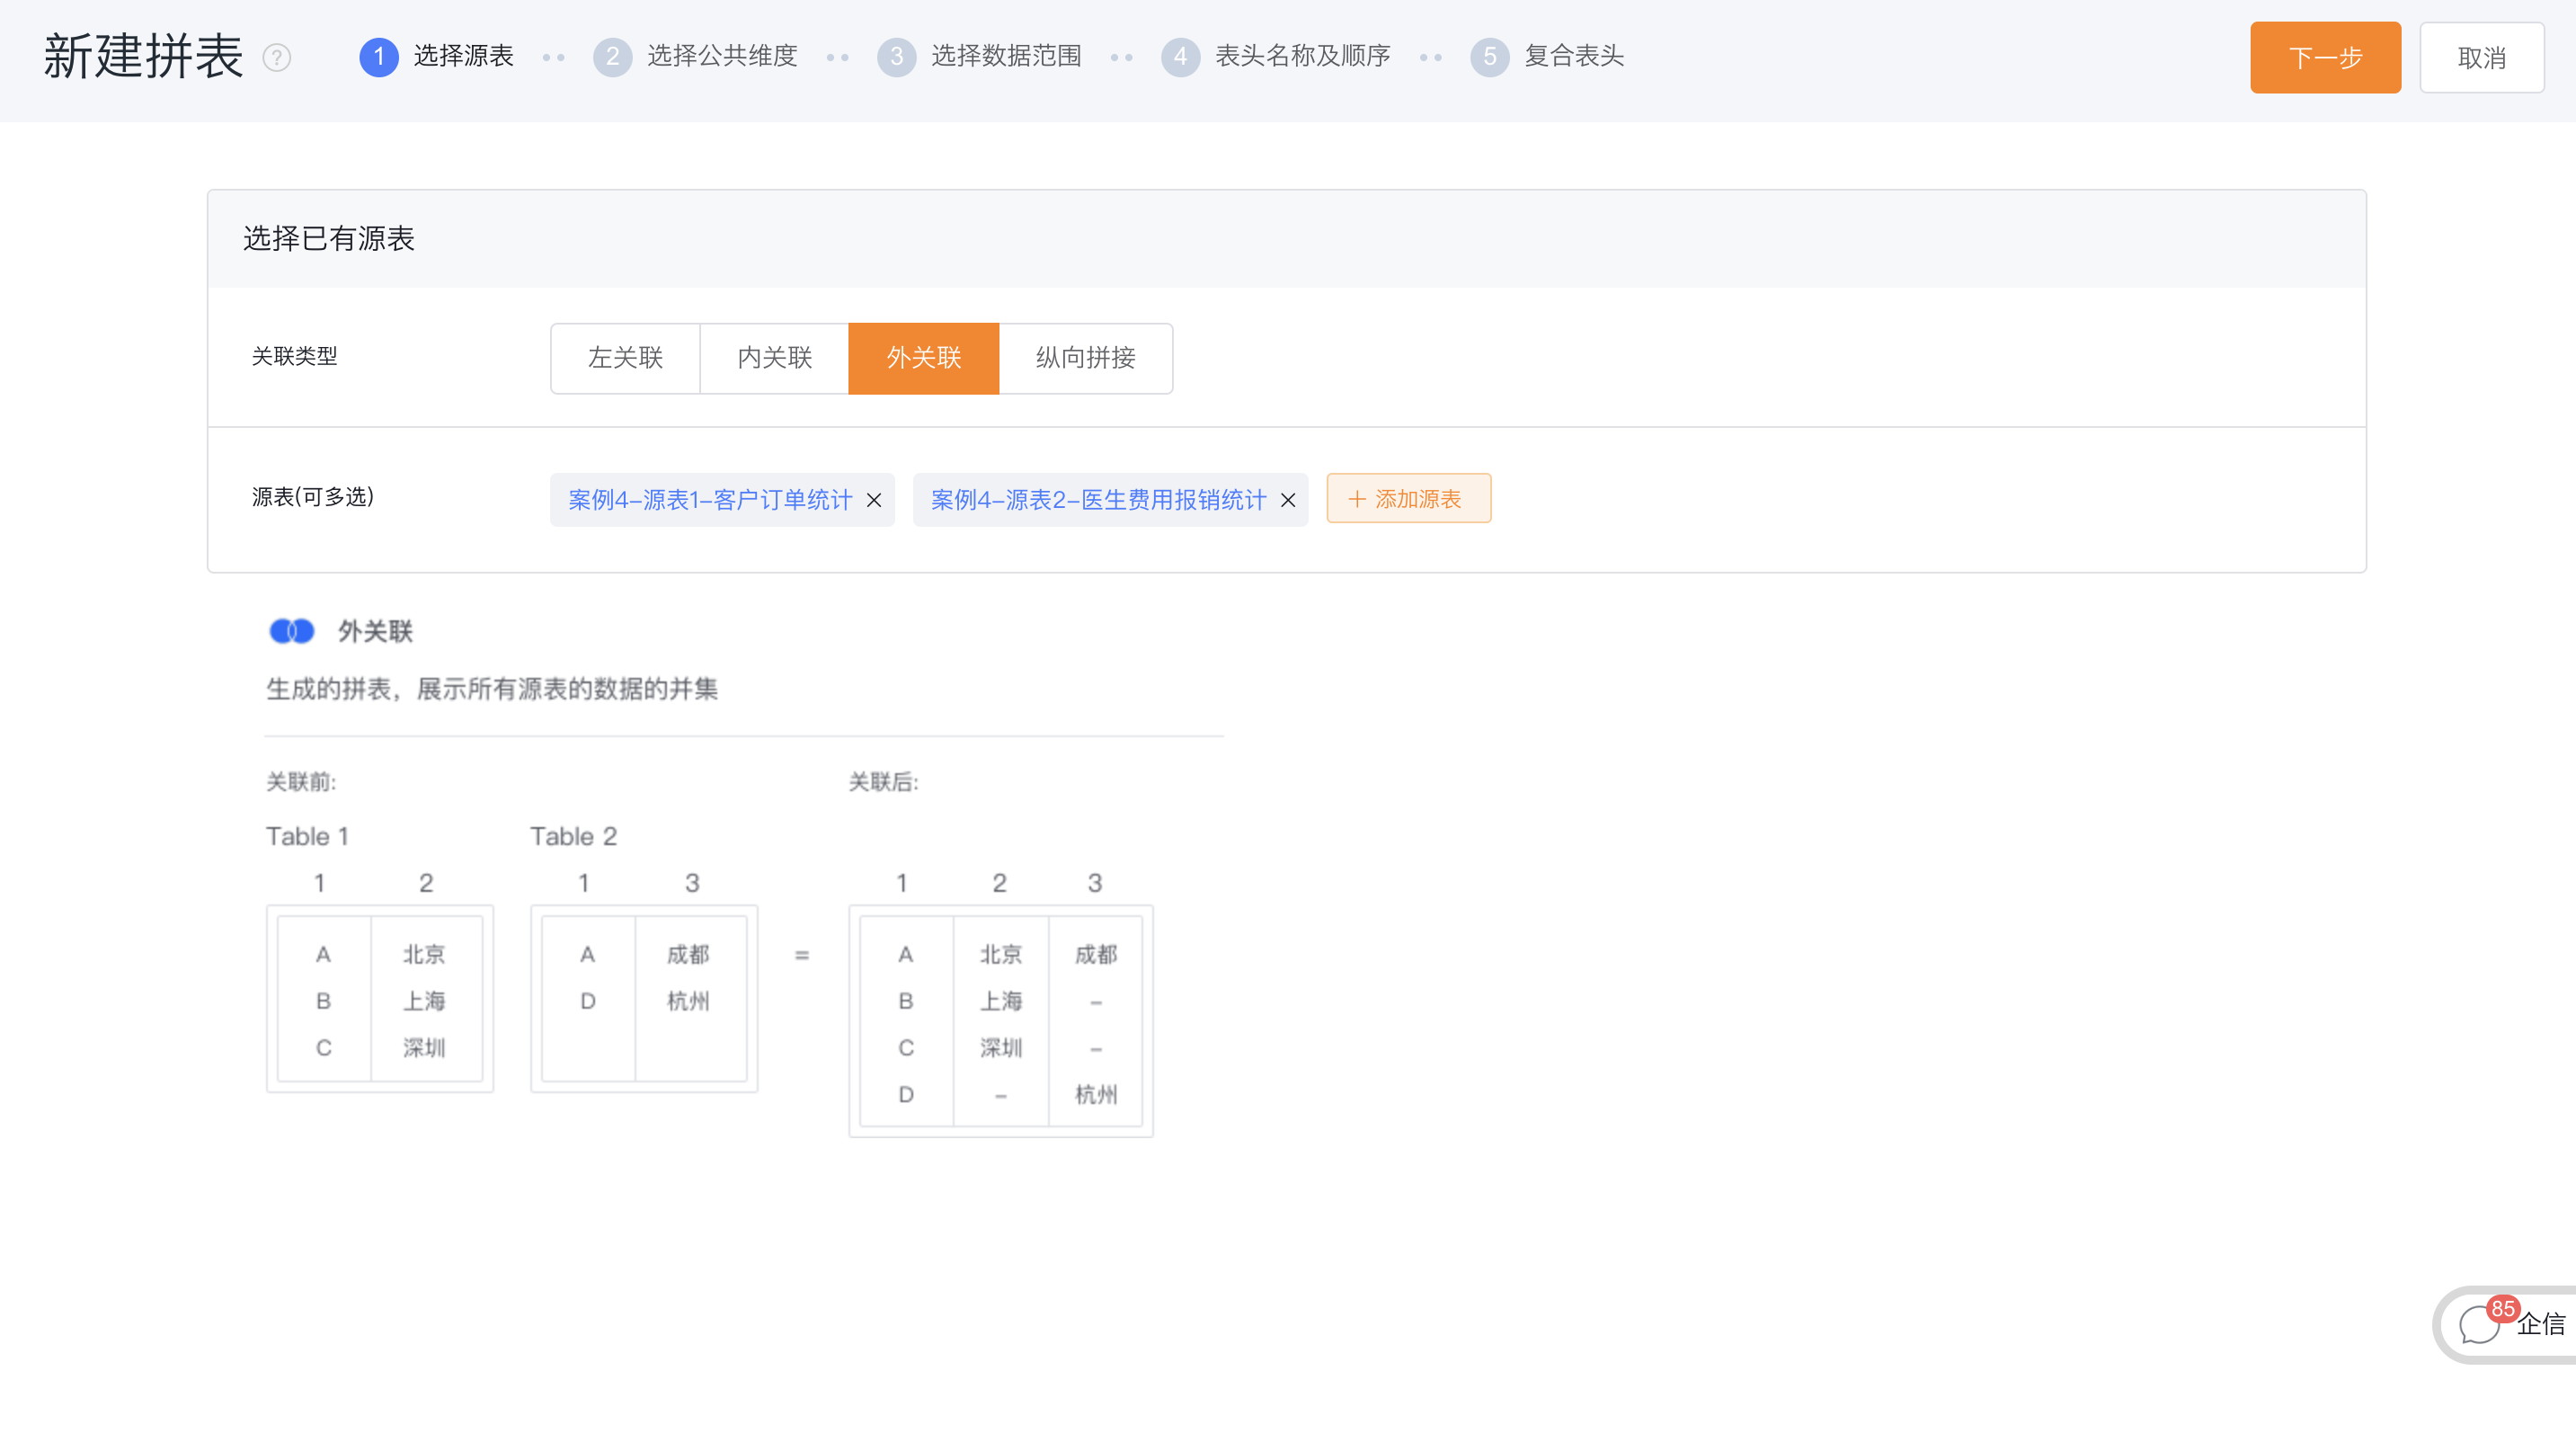
- Source table: the basic table configured based on BI reports and statistical charts, as the source of the combined table;
- Association type: the splicing method of each source table when splicing tables
- 1 Left association: left join, subject to the left source table;
- 2 Inner association: inner join, take intersection;
- 3 Outer association: outer join, take union;
- 4 Vertical splicing: Merge of all data rows;
- Case description: Some doctors (clients) have orders but no reimbursement, some doctors (clients) have reimbursement but no orders, and some have both. These types of scenarios need to be covered in the final spelling table. If a doctor is counted in any source table, it will appear in the final spelling table, that is, the union of all source tables. So choose the association type: external association.
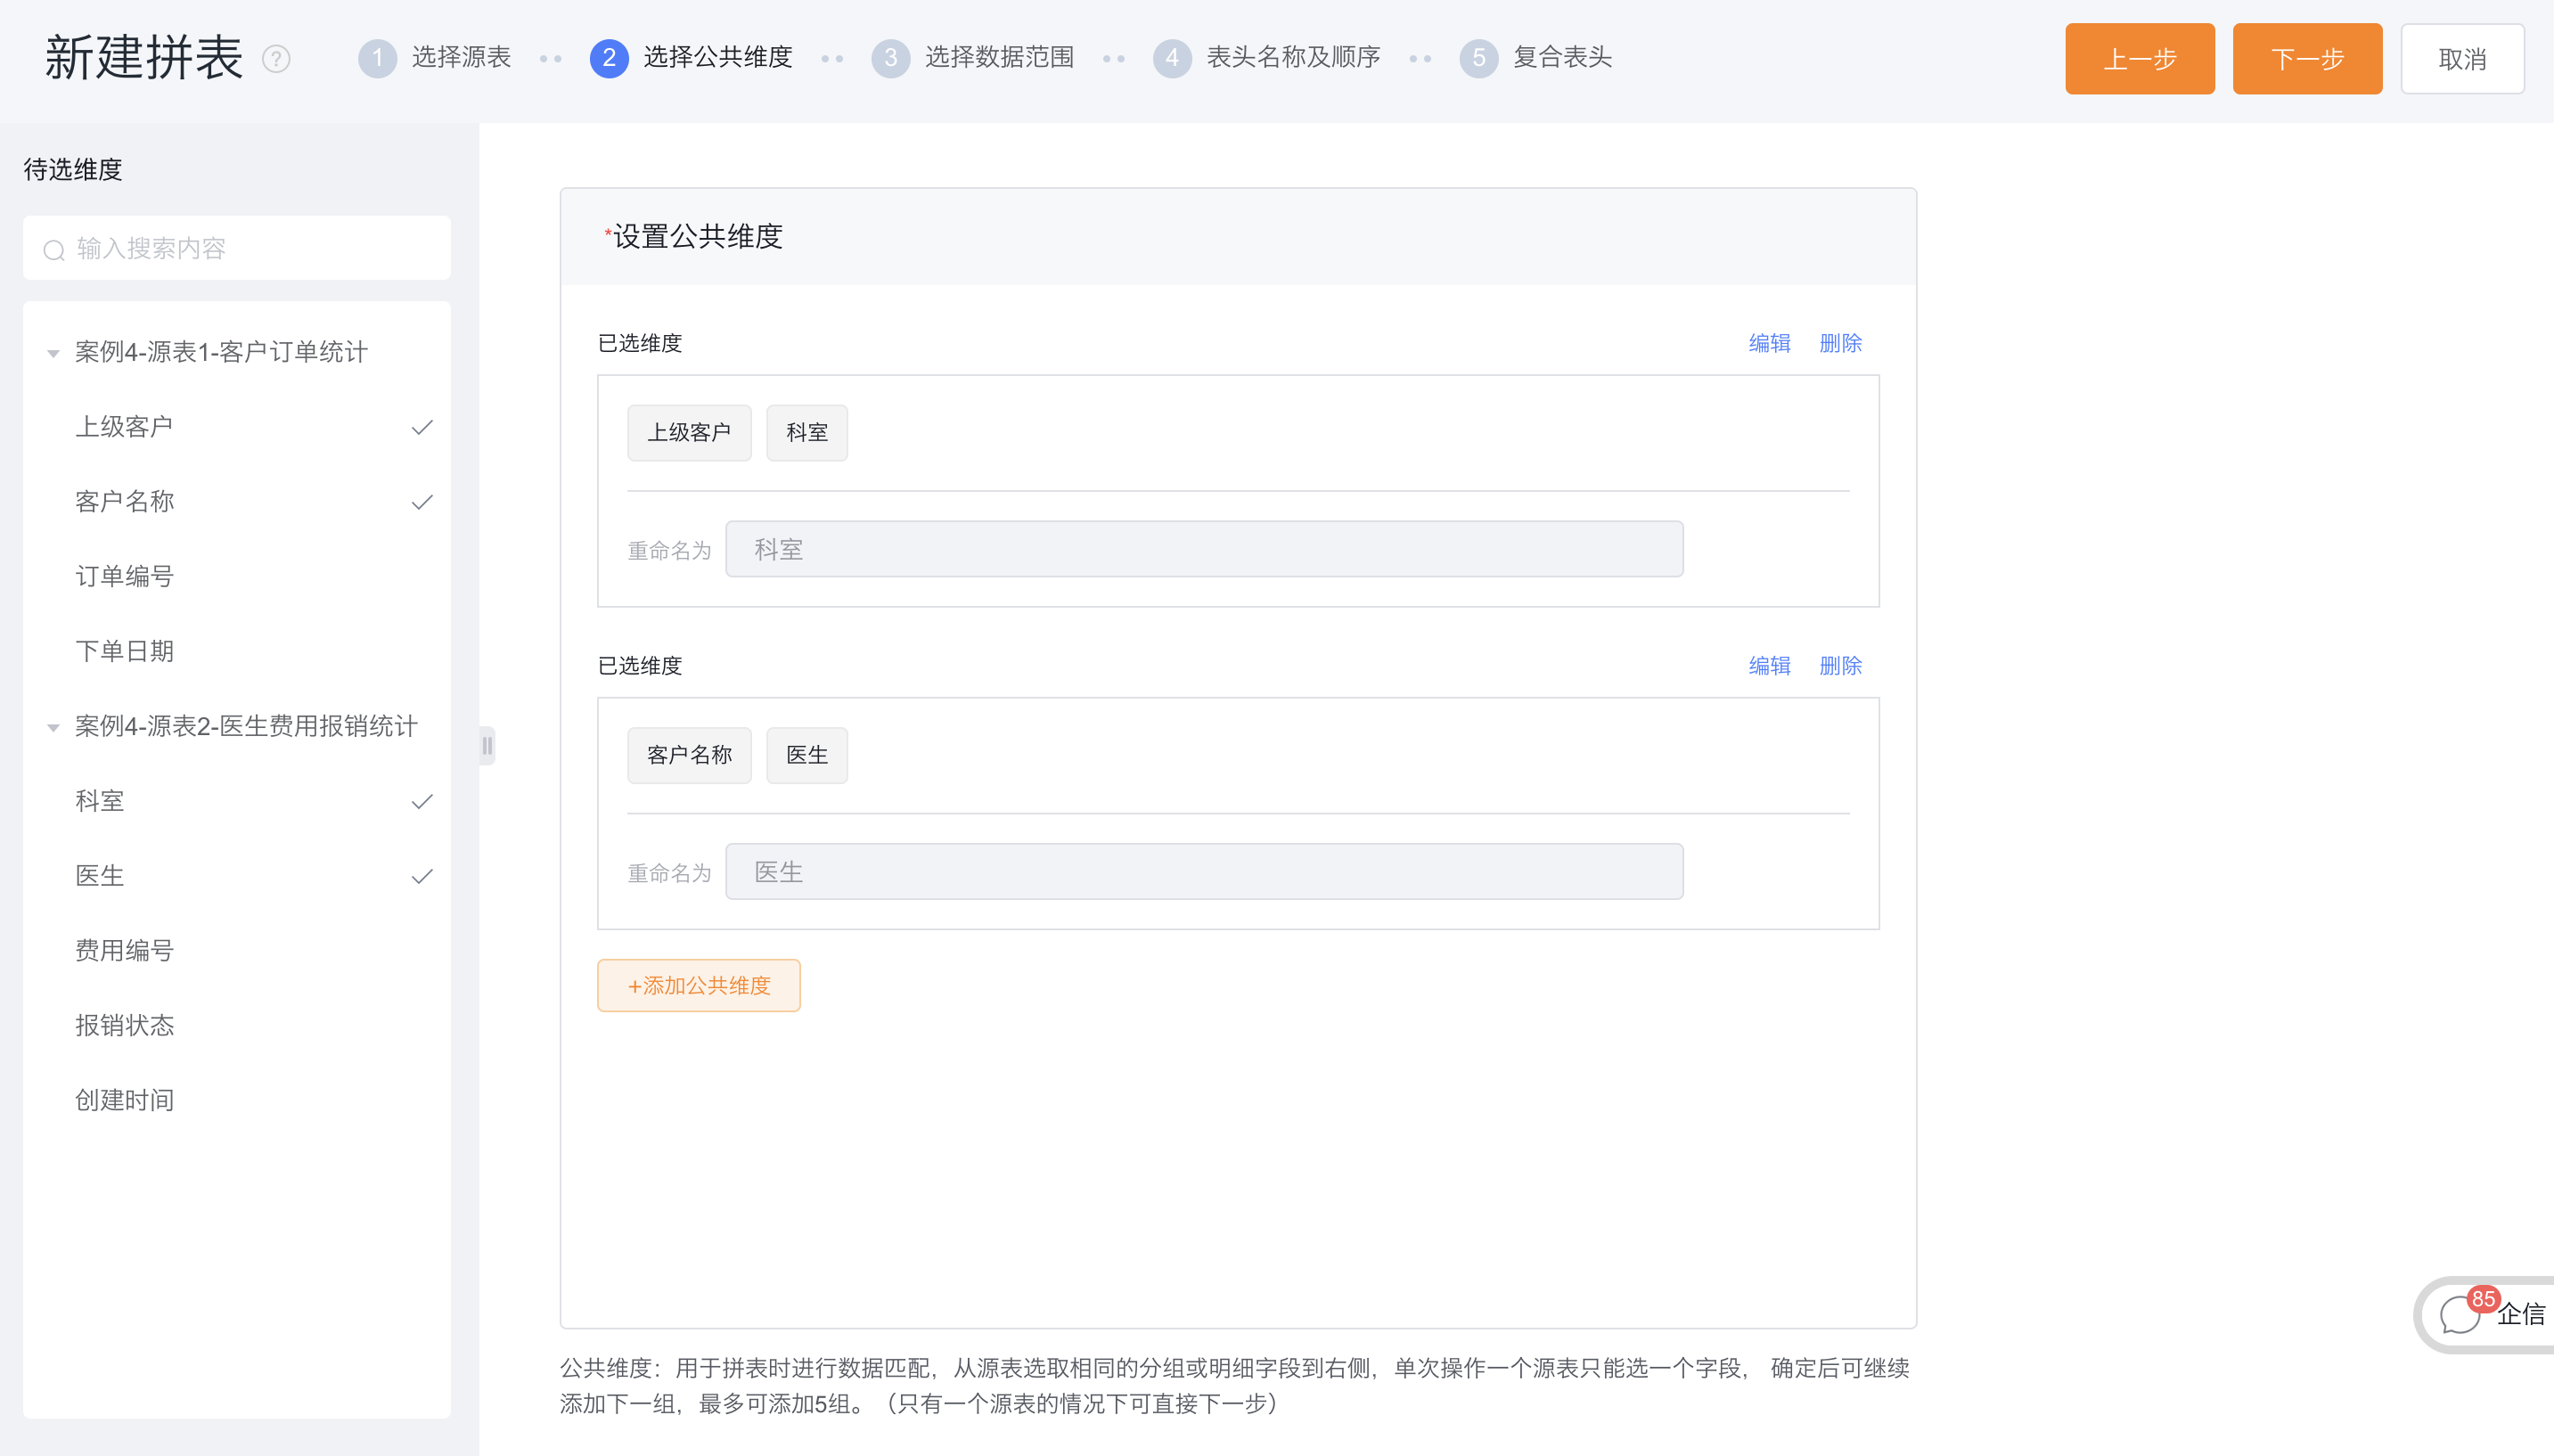
2.2.1.2 Select public dimension
- Common dimension: As the basis for splicing multiple source tables, generally the grouping/dimension fields with the same meaning in each source table click on the fields with the same meaning in each source table and add them to the right to form a set of common dimensions, which will be used as the splicing table Grouping/dimension fields, displayed by renamed field names.
- Case Description: Add two sets of common dimensions in sequence
- The first group of public dimensions: "superior customer" and "department" are finally displayed as "department";
- The second set of public dimensions: "Customer Name" and "Doctor" is finally displayed as "Doctor".
2.2.1.3 Select data range
- Add merged data range: the common data range of each source table is similar to the common dimension, click on the left to add to the right as a group. Clicking "Merge" means that it will eventually be merged into one filter condition to be used in the data range of the stitching table, and displayed according to the renamed field name. The default values for the filter can also be modified here.
- Add data range: In addition to the public data range, other filter conditions, which need to be exposed in the data range after the table is assembled. Filter conditions that have not been added will not be displayed in the data range of the combined table, and will work according to the default configuration of the source table.
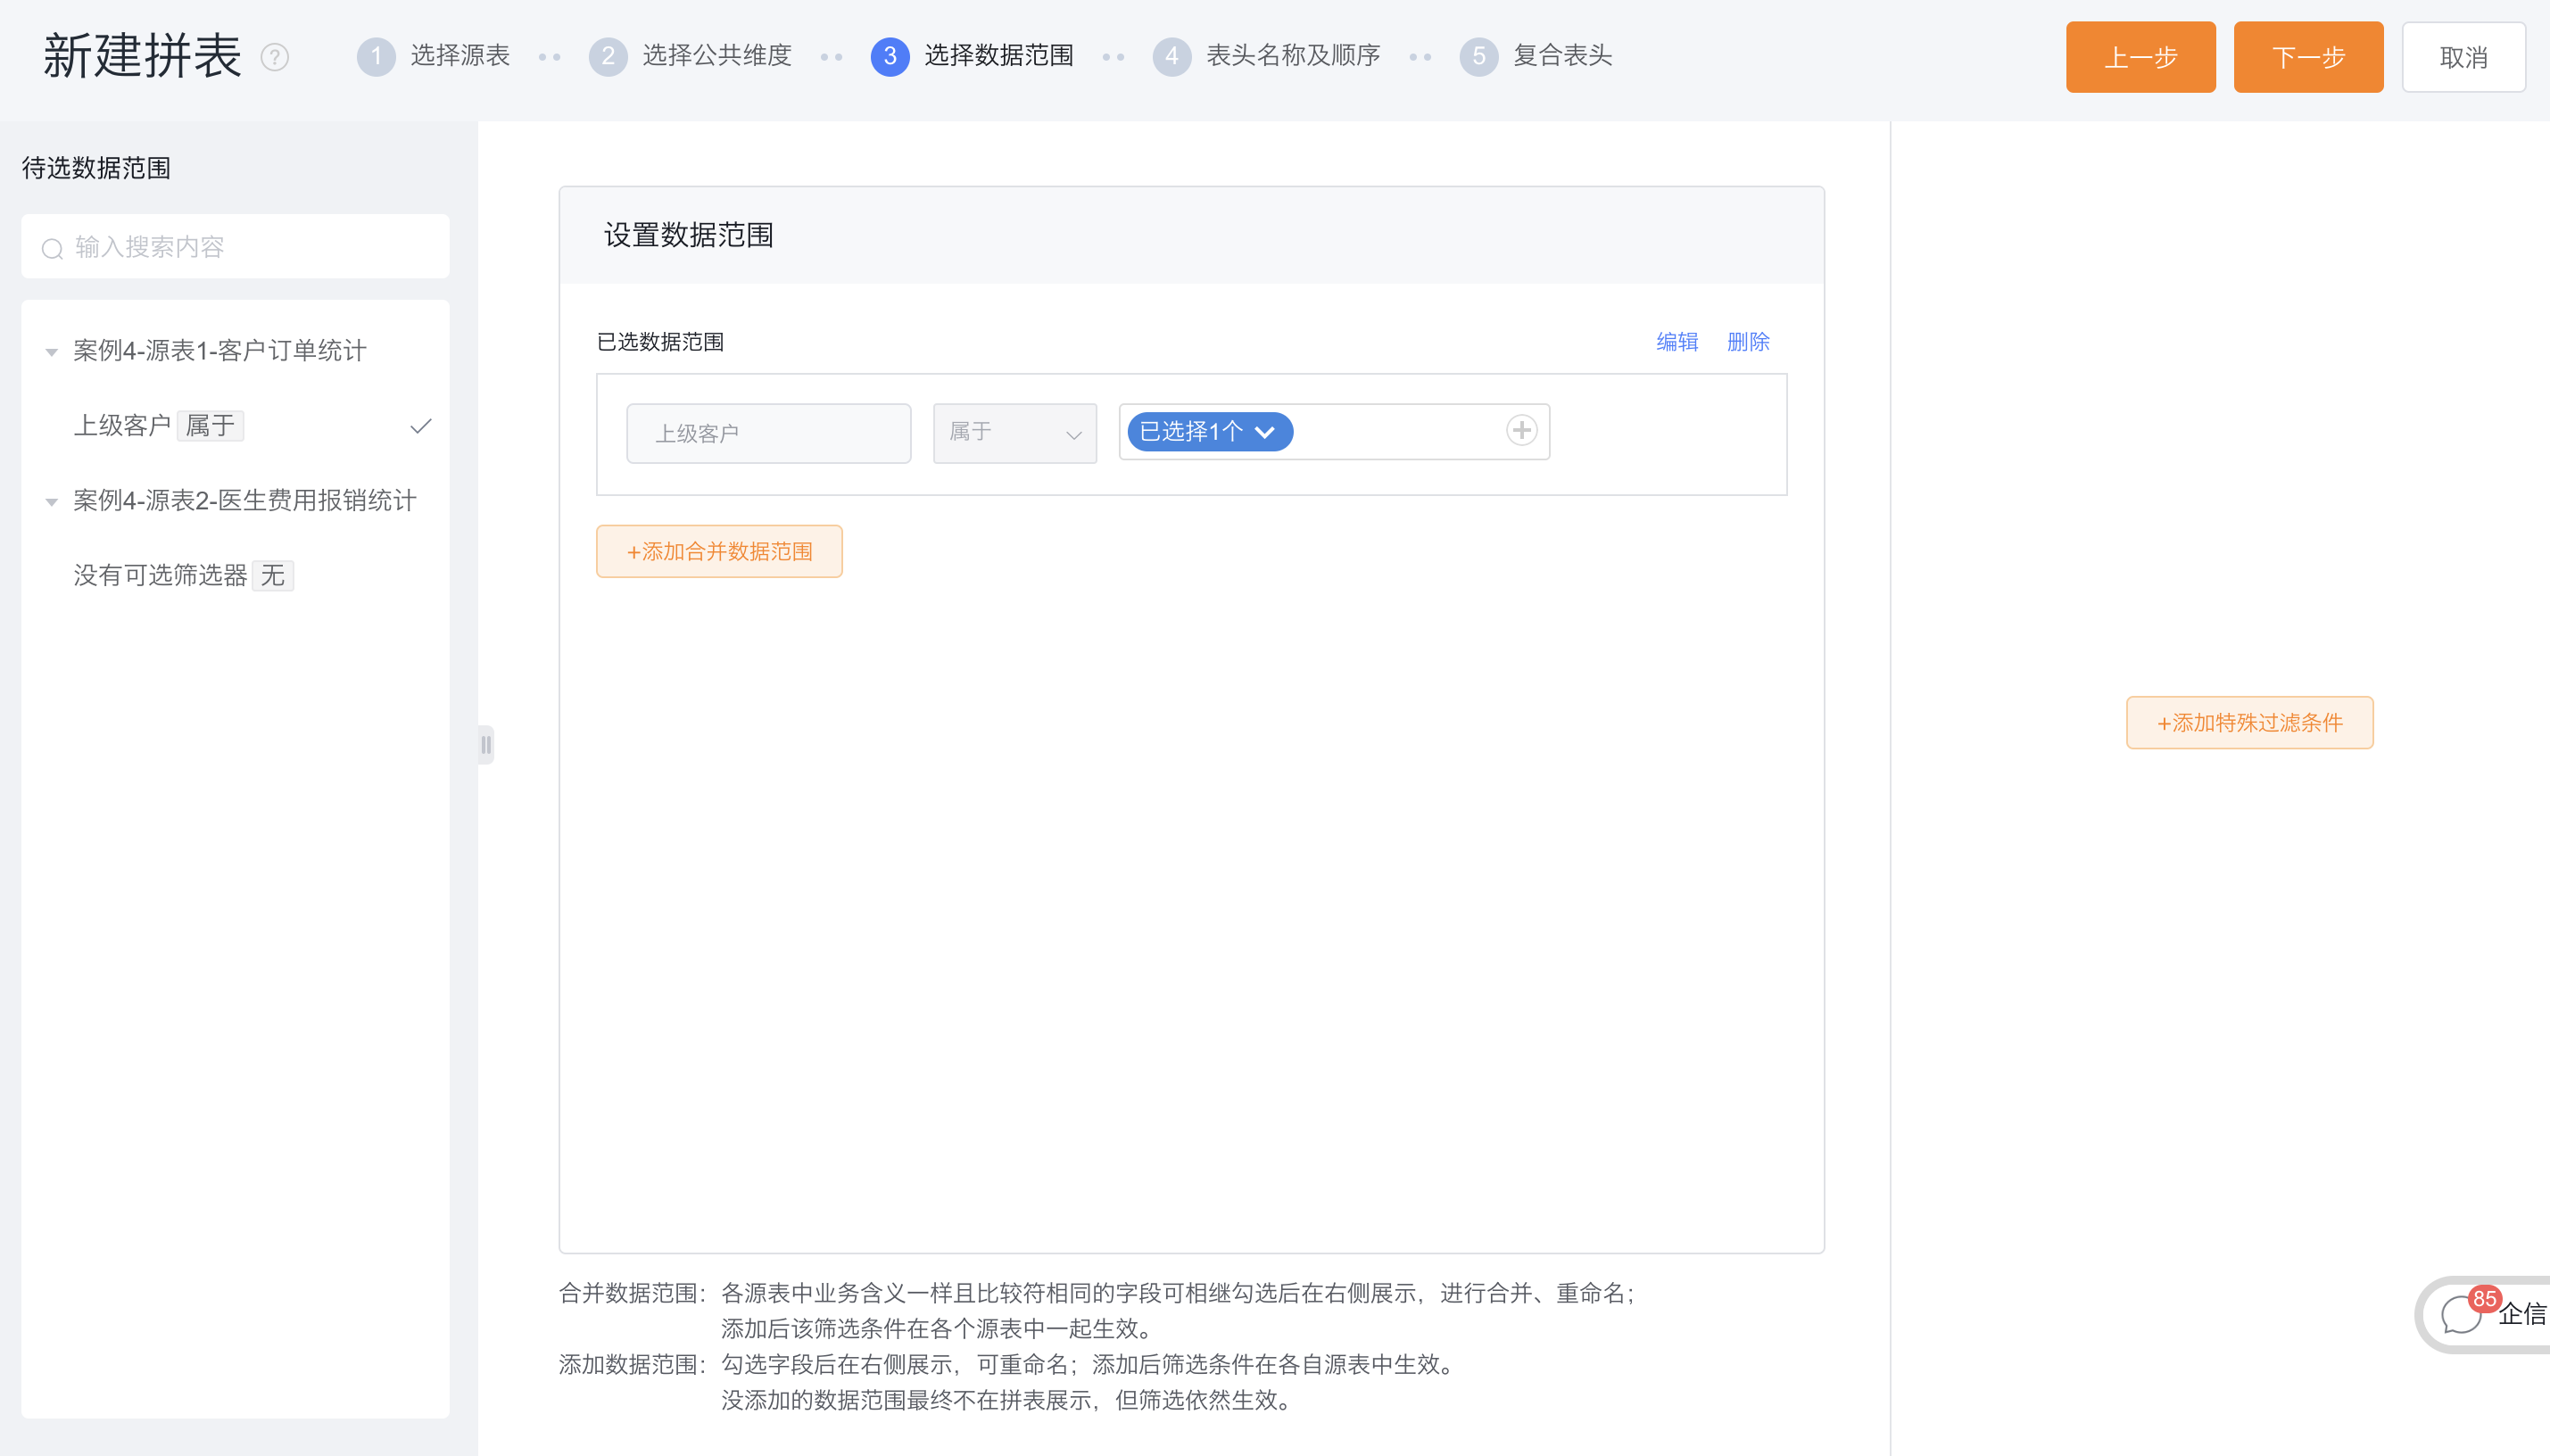
- Case description: In this case, there is no public data range, so there is no need to add a merged data range. There is a filter for superior customers in source table 1. If you want to keep this filter after the table is merged, click Add Data Range directly. Select the filter criteria and click OK. Finally, in the spelling table, the filter of this condition will only be applied to the source table 1.
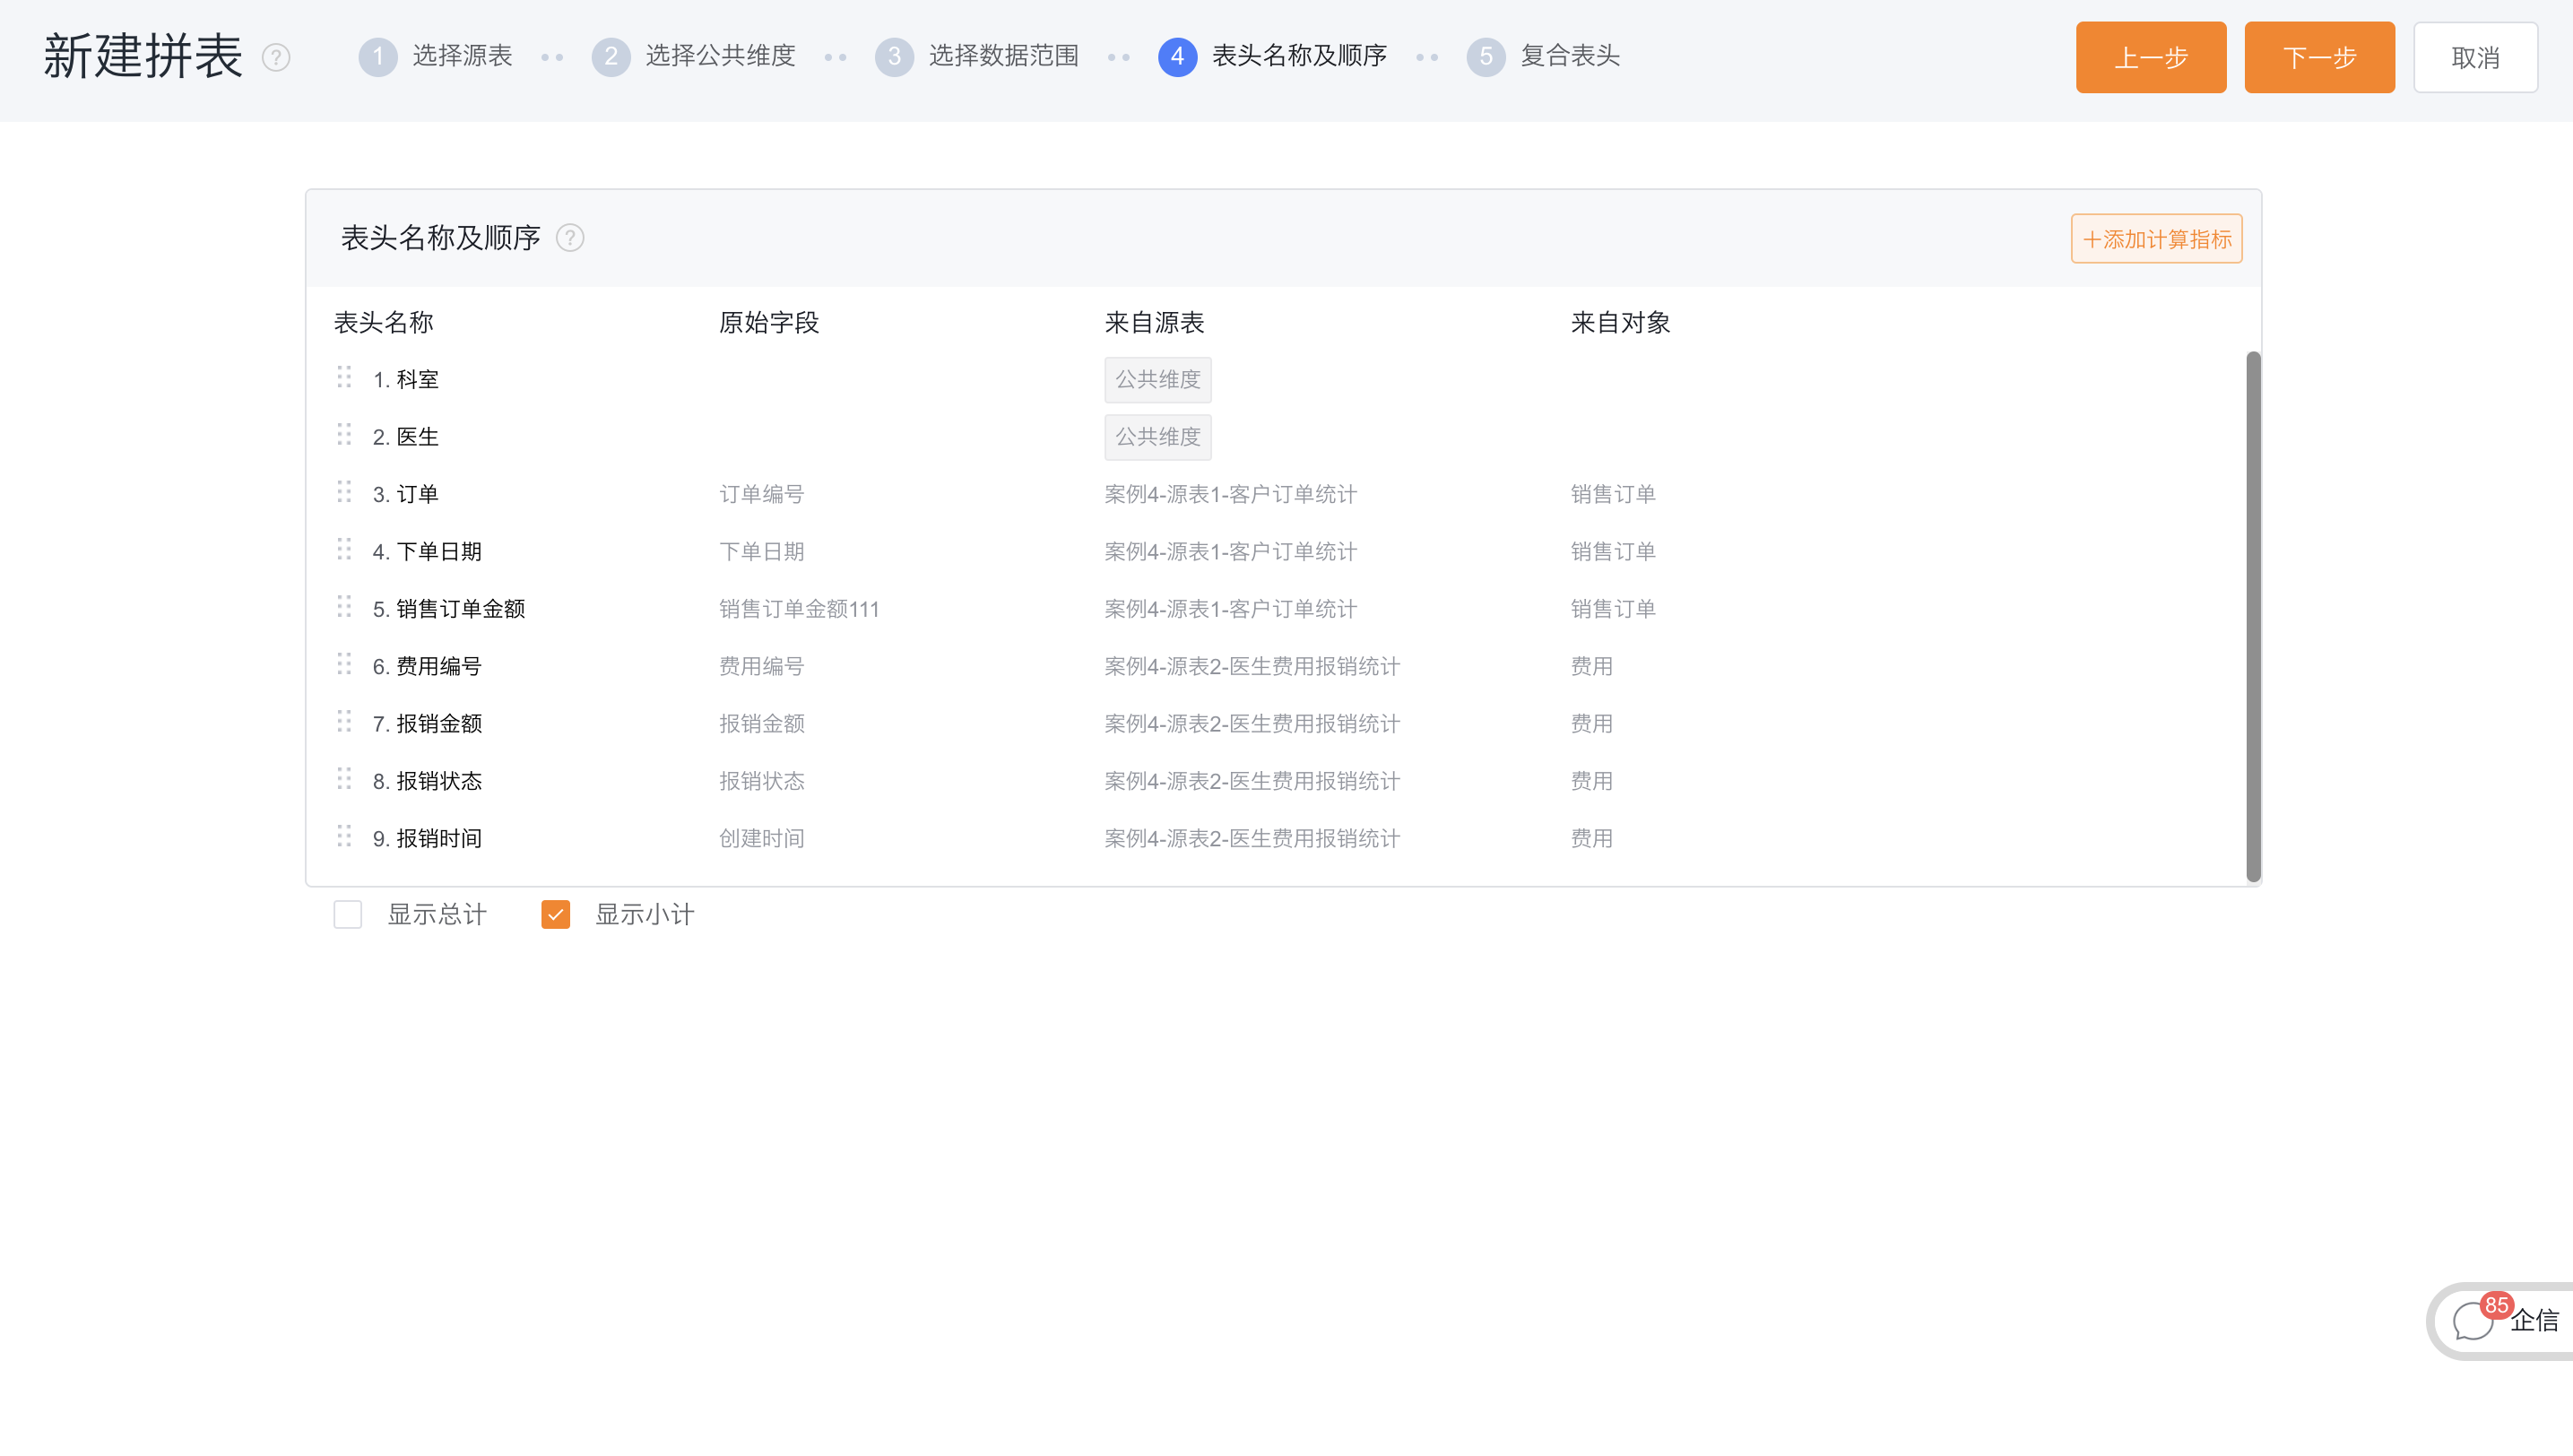
2.2.1.4 Header name and sequence
- Header name: The field name of the public dimension is displayed according to the setting in the second step, which cannot be modified here, and other field names can be modified as required.
- Adjust the order: Drag and drop to adjust the order of the columns, where the common dimension must be at the front and cannot be adjusted.
- Add and hide columns: You can add calculated indicators as new columns; you can hide columns that don't need to be displayed in the spelling table.
- Case description: When there are multiple sets of common dimensions, all common dimensions will be ranked first. The rest of the columns can be dragged and reordered and renamed. Check Show Total and Show Subtotal, which means that after the table is assembled, the corresponding subtotal value needs to be displayed under each department and each doctor group, and there is a row of total value at the end.
2.2.1.5 Composite header
-
Composite header: Display the title and order of the headers adjusted in the previous step, and add multiple layers of composite headers to the top.
-
operate:
Add row: add a new row above; Delete row: delete the selected row; Merge cells: Merge multiple cells in the mouse circle; Split cell: split the merged cell back to the original cell; Compact mode: compact mode can be set; Back: Go back to the previous step; Modify column width: Click the original header to modify the column width; Modify the display name: Click the added grid to modify the display name; -
Case Description: Adjust the width of each column to 100 pixels, and set the compact mode to facilitate one-screen viewing.
2.2.2 Table spelling results
3. Vertical splicing
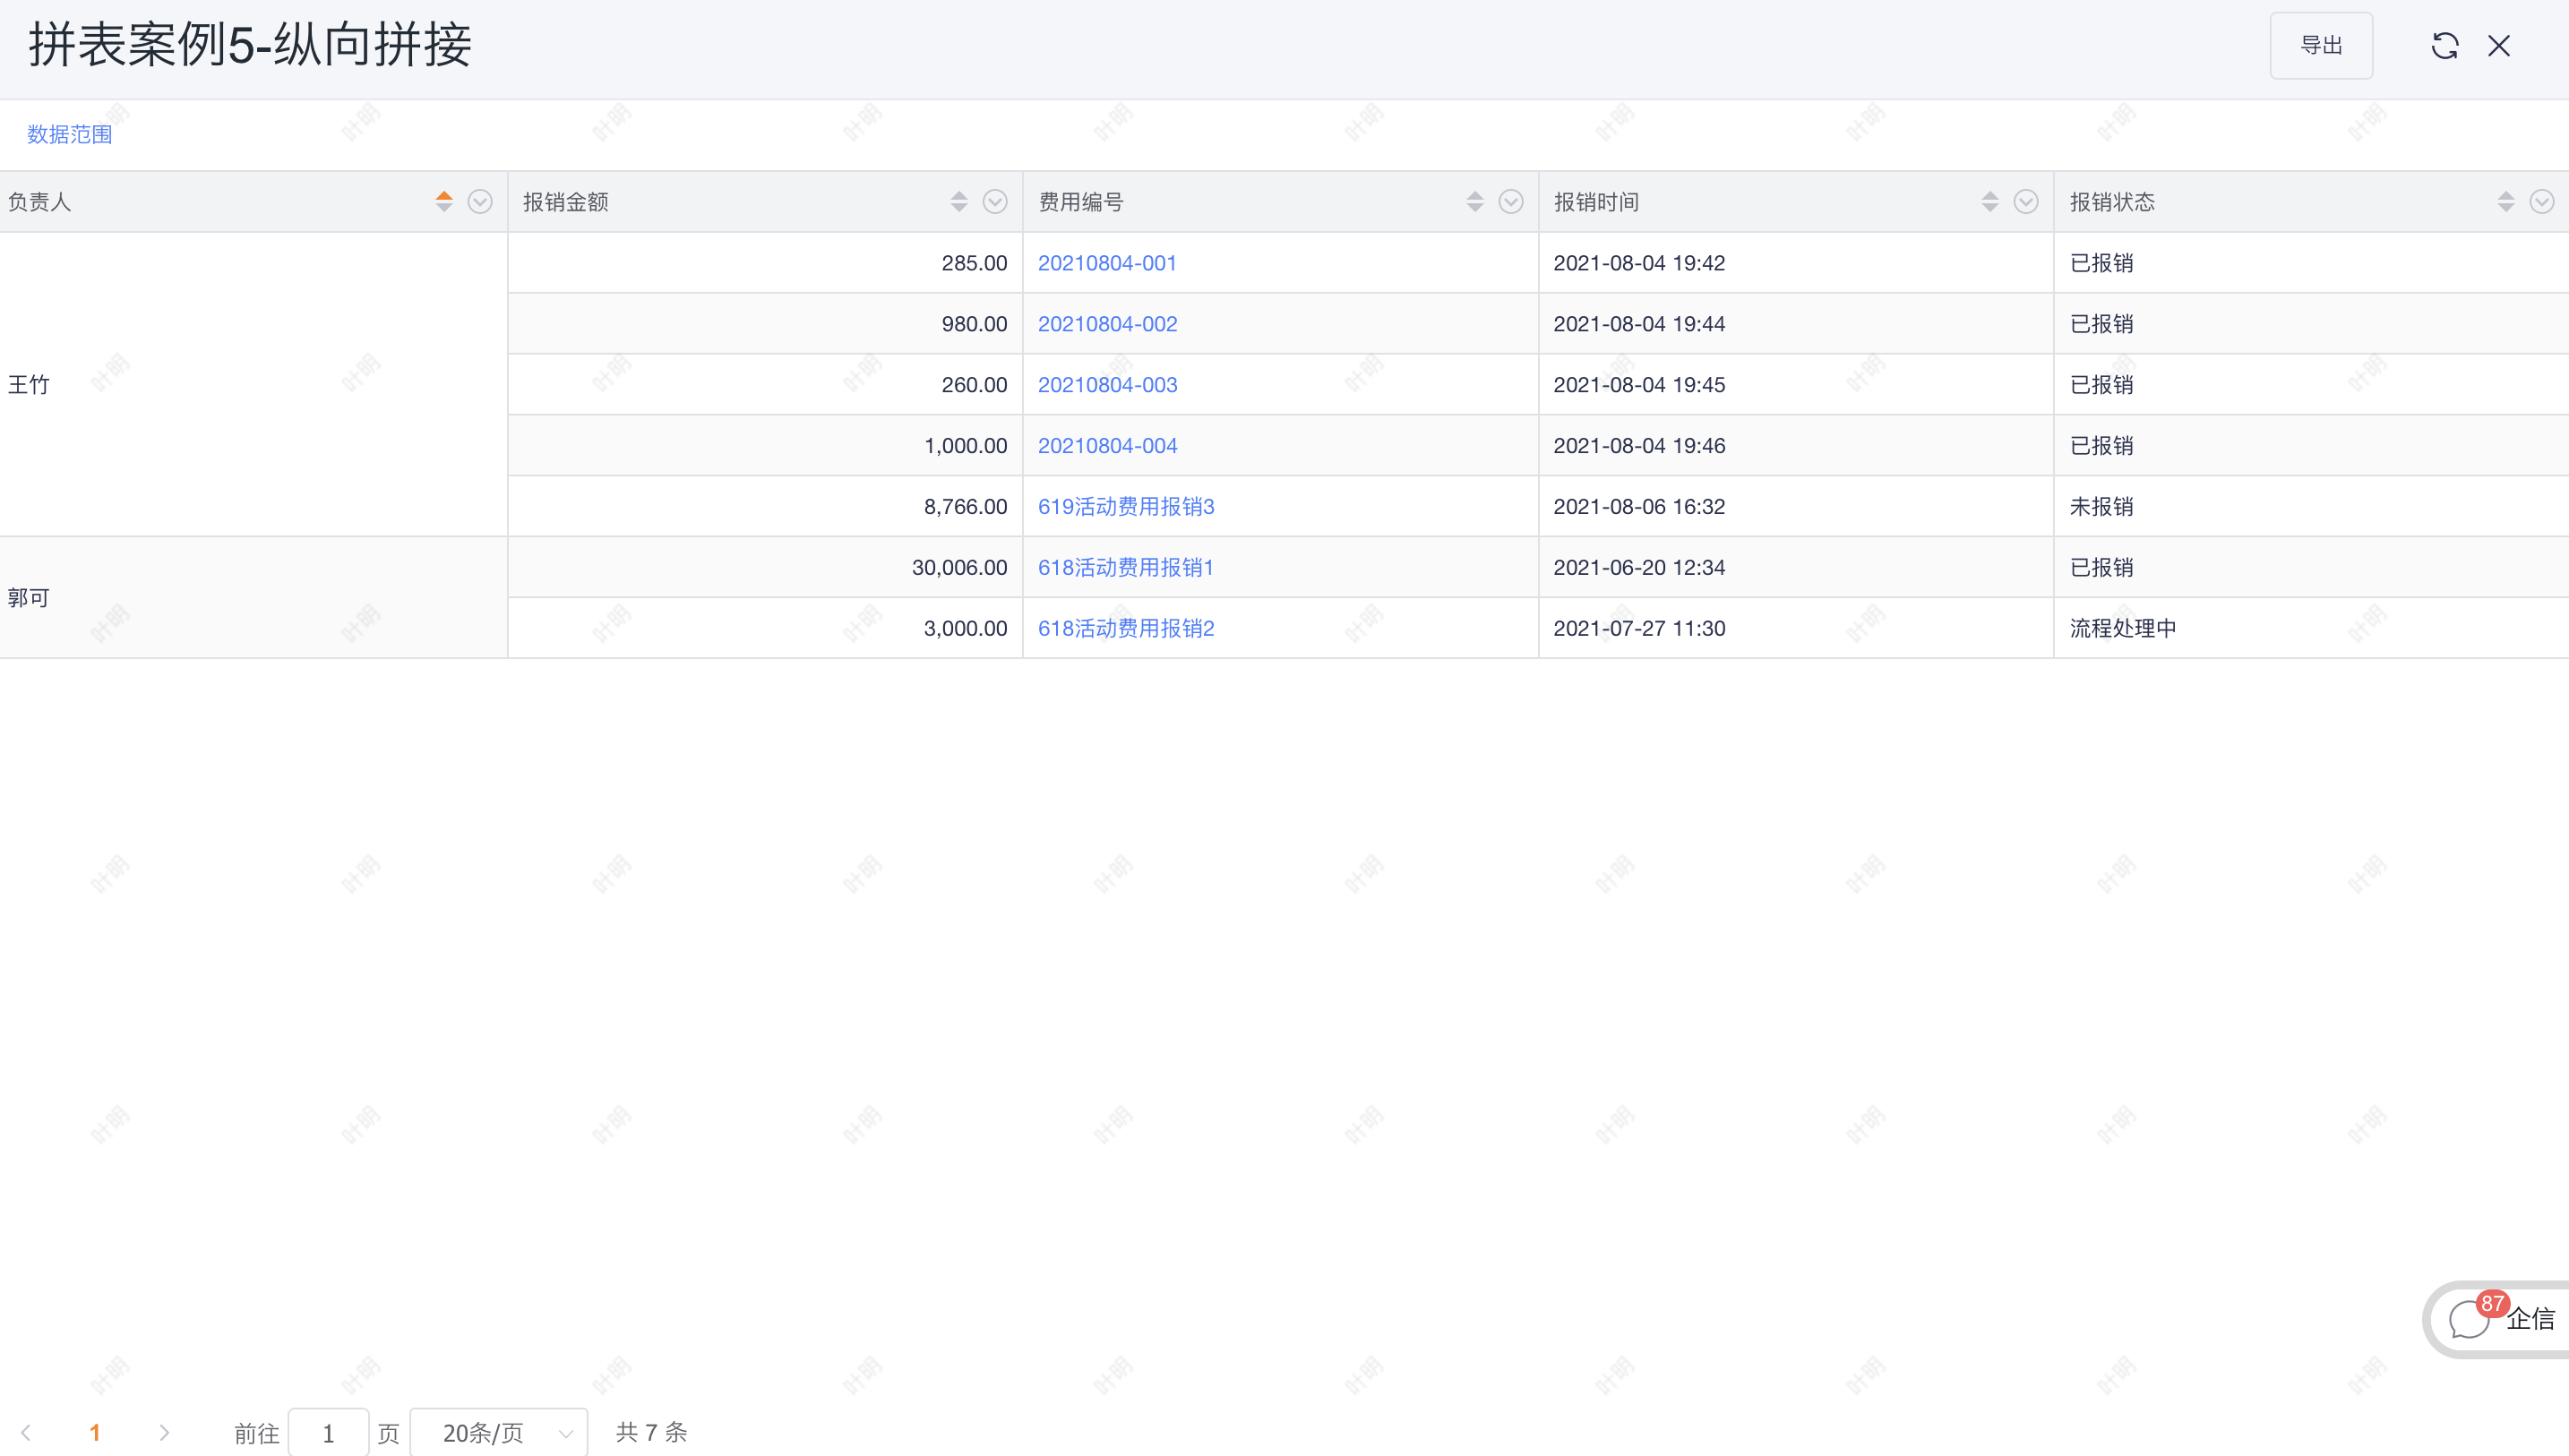
3.1 Case 5: Vertical splicing
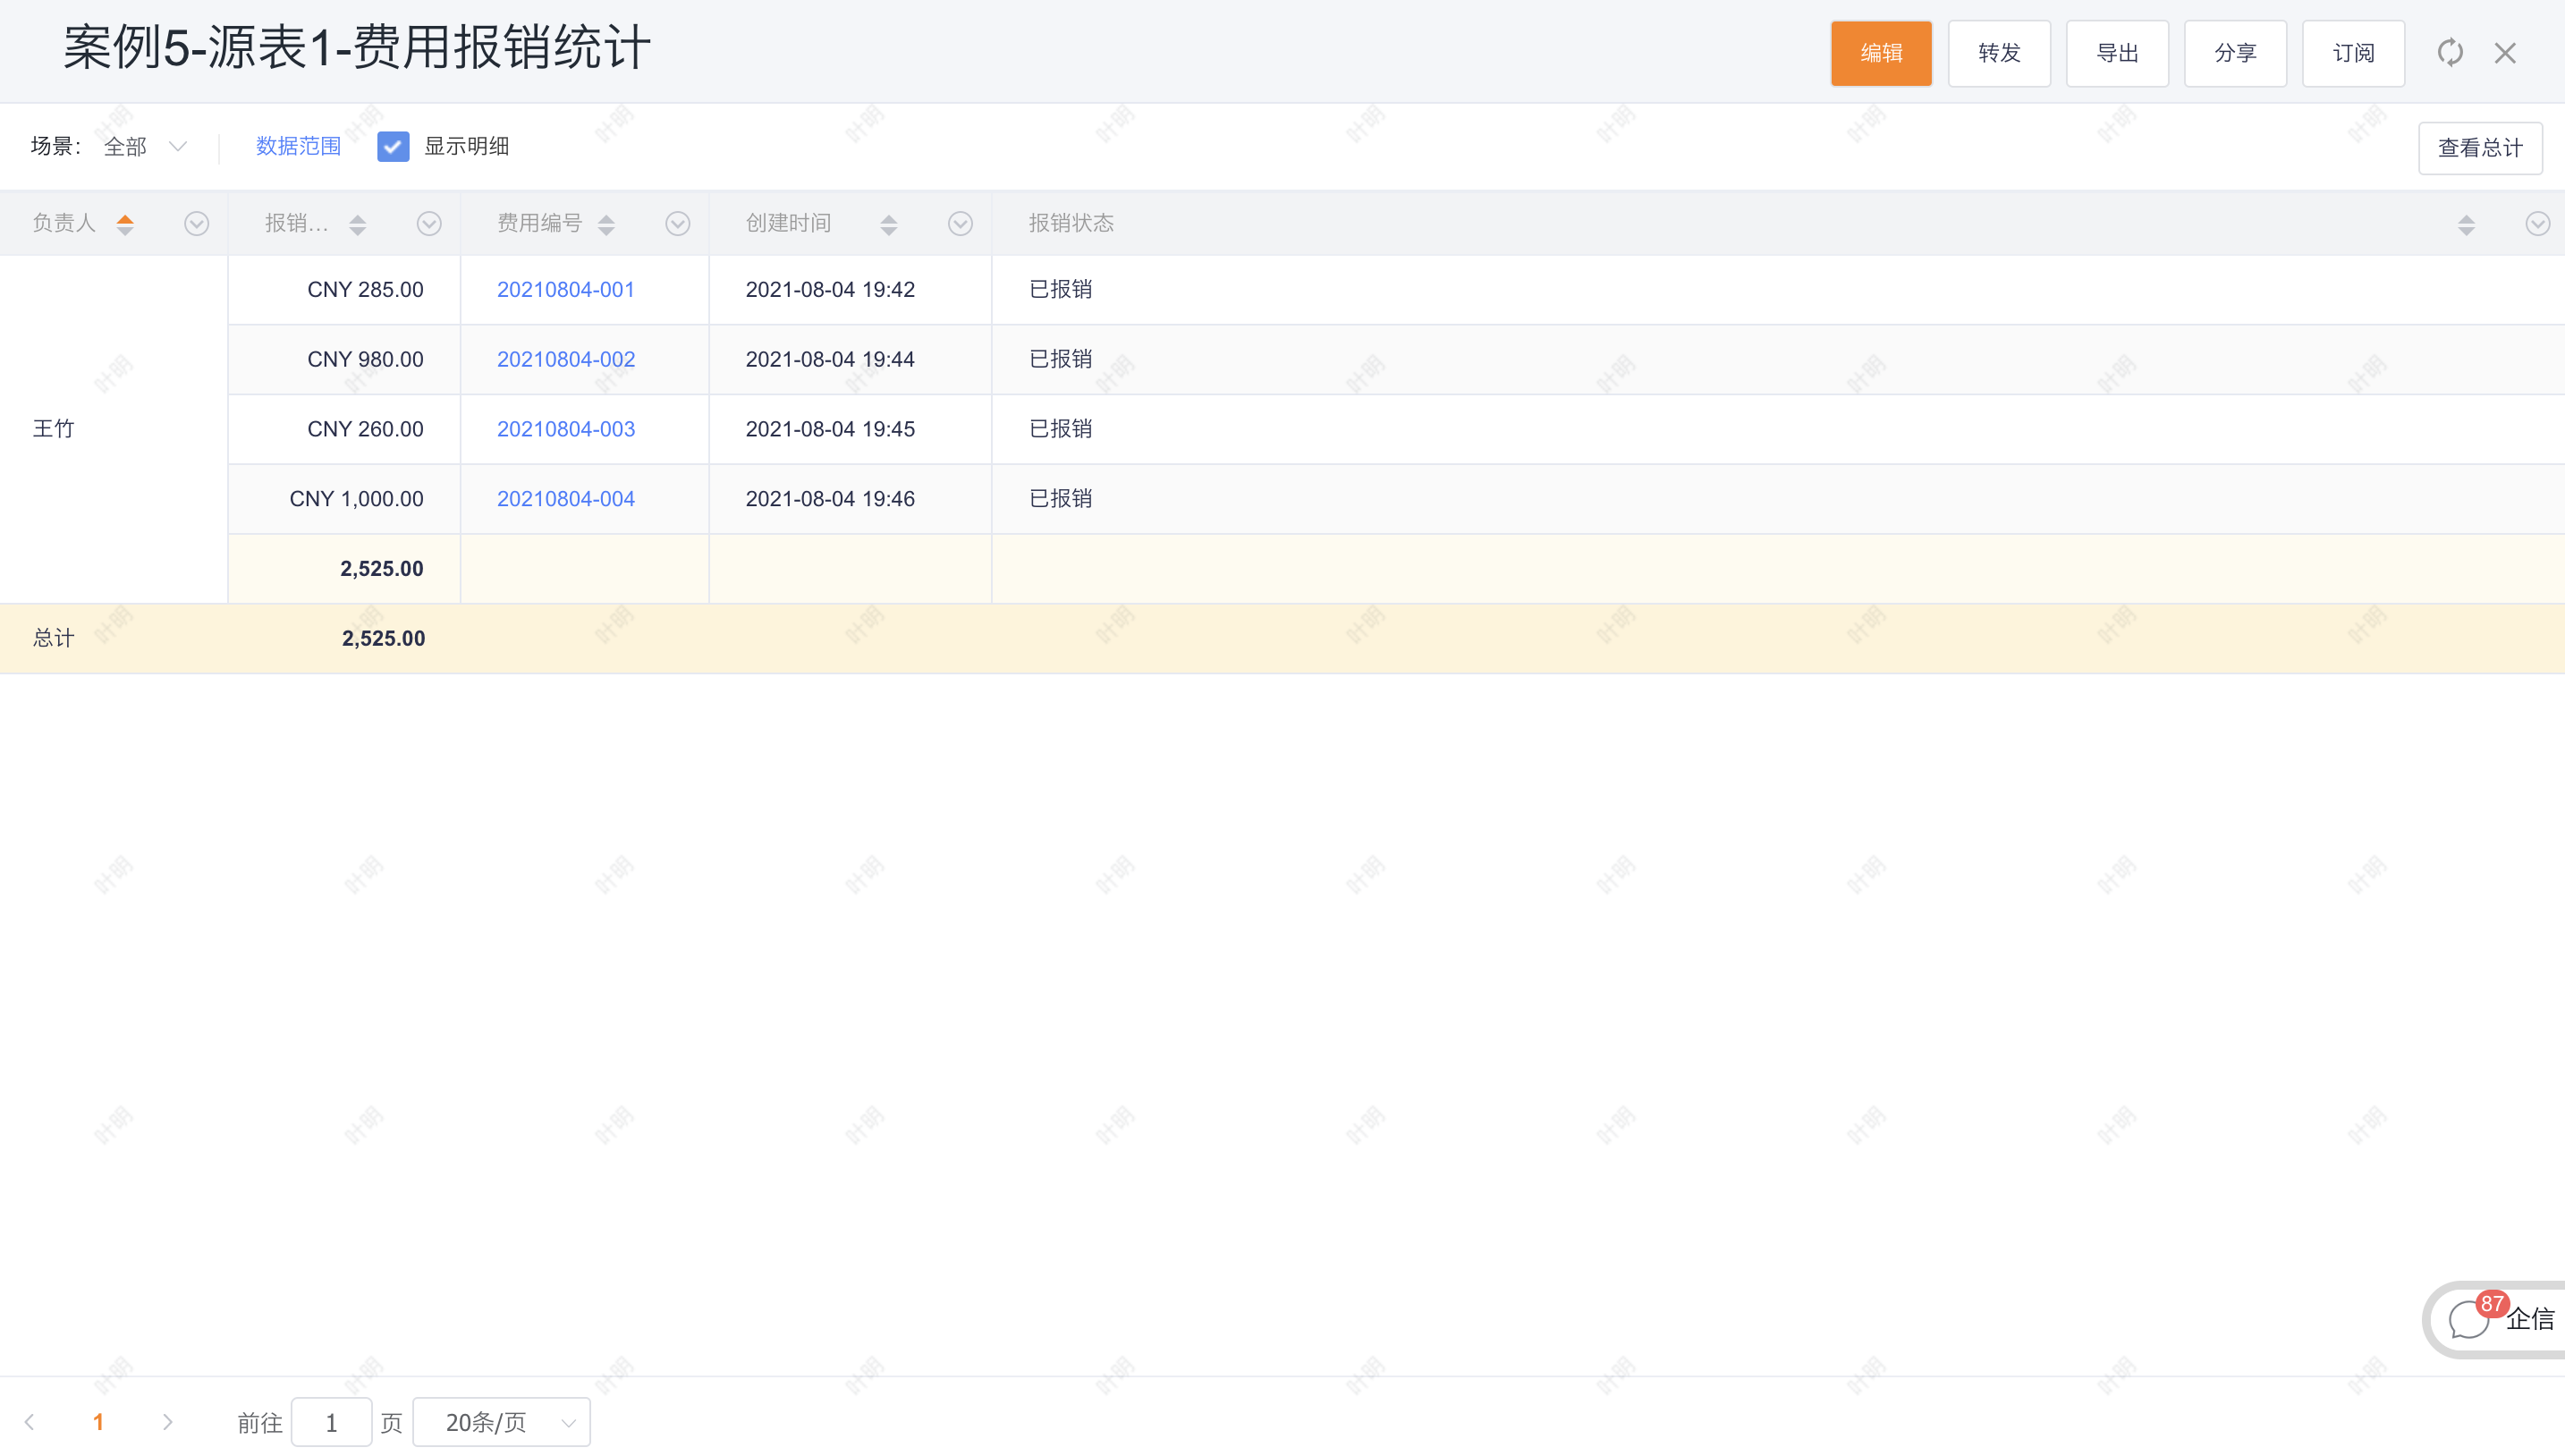
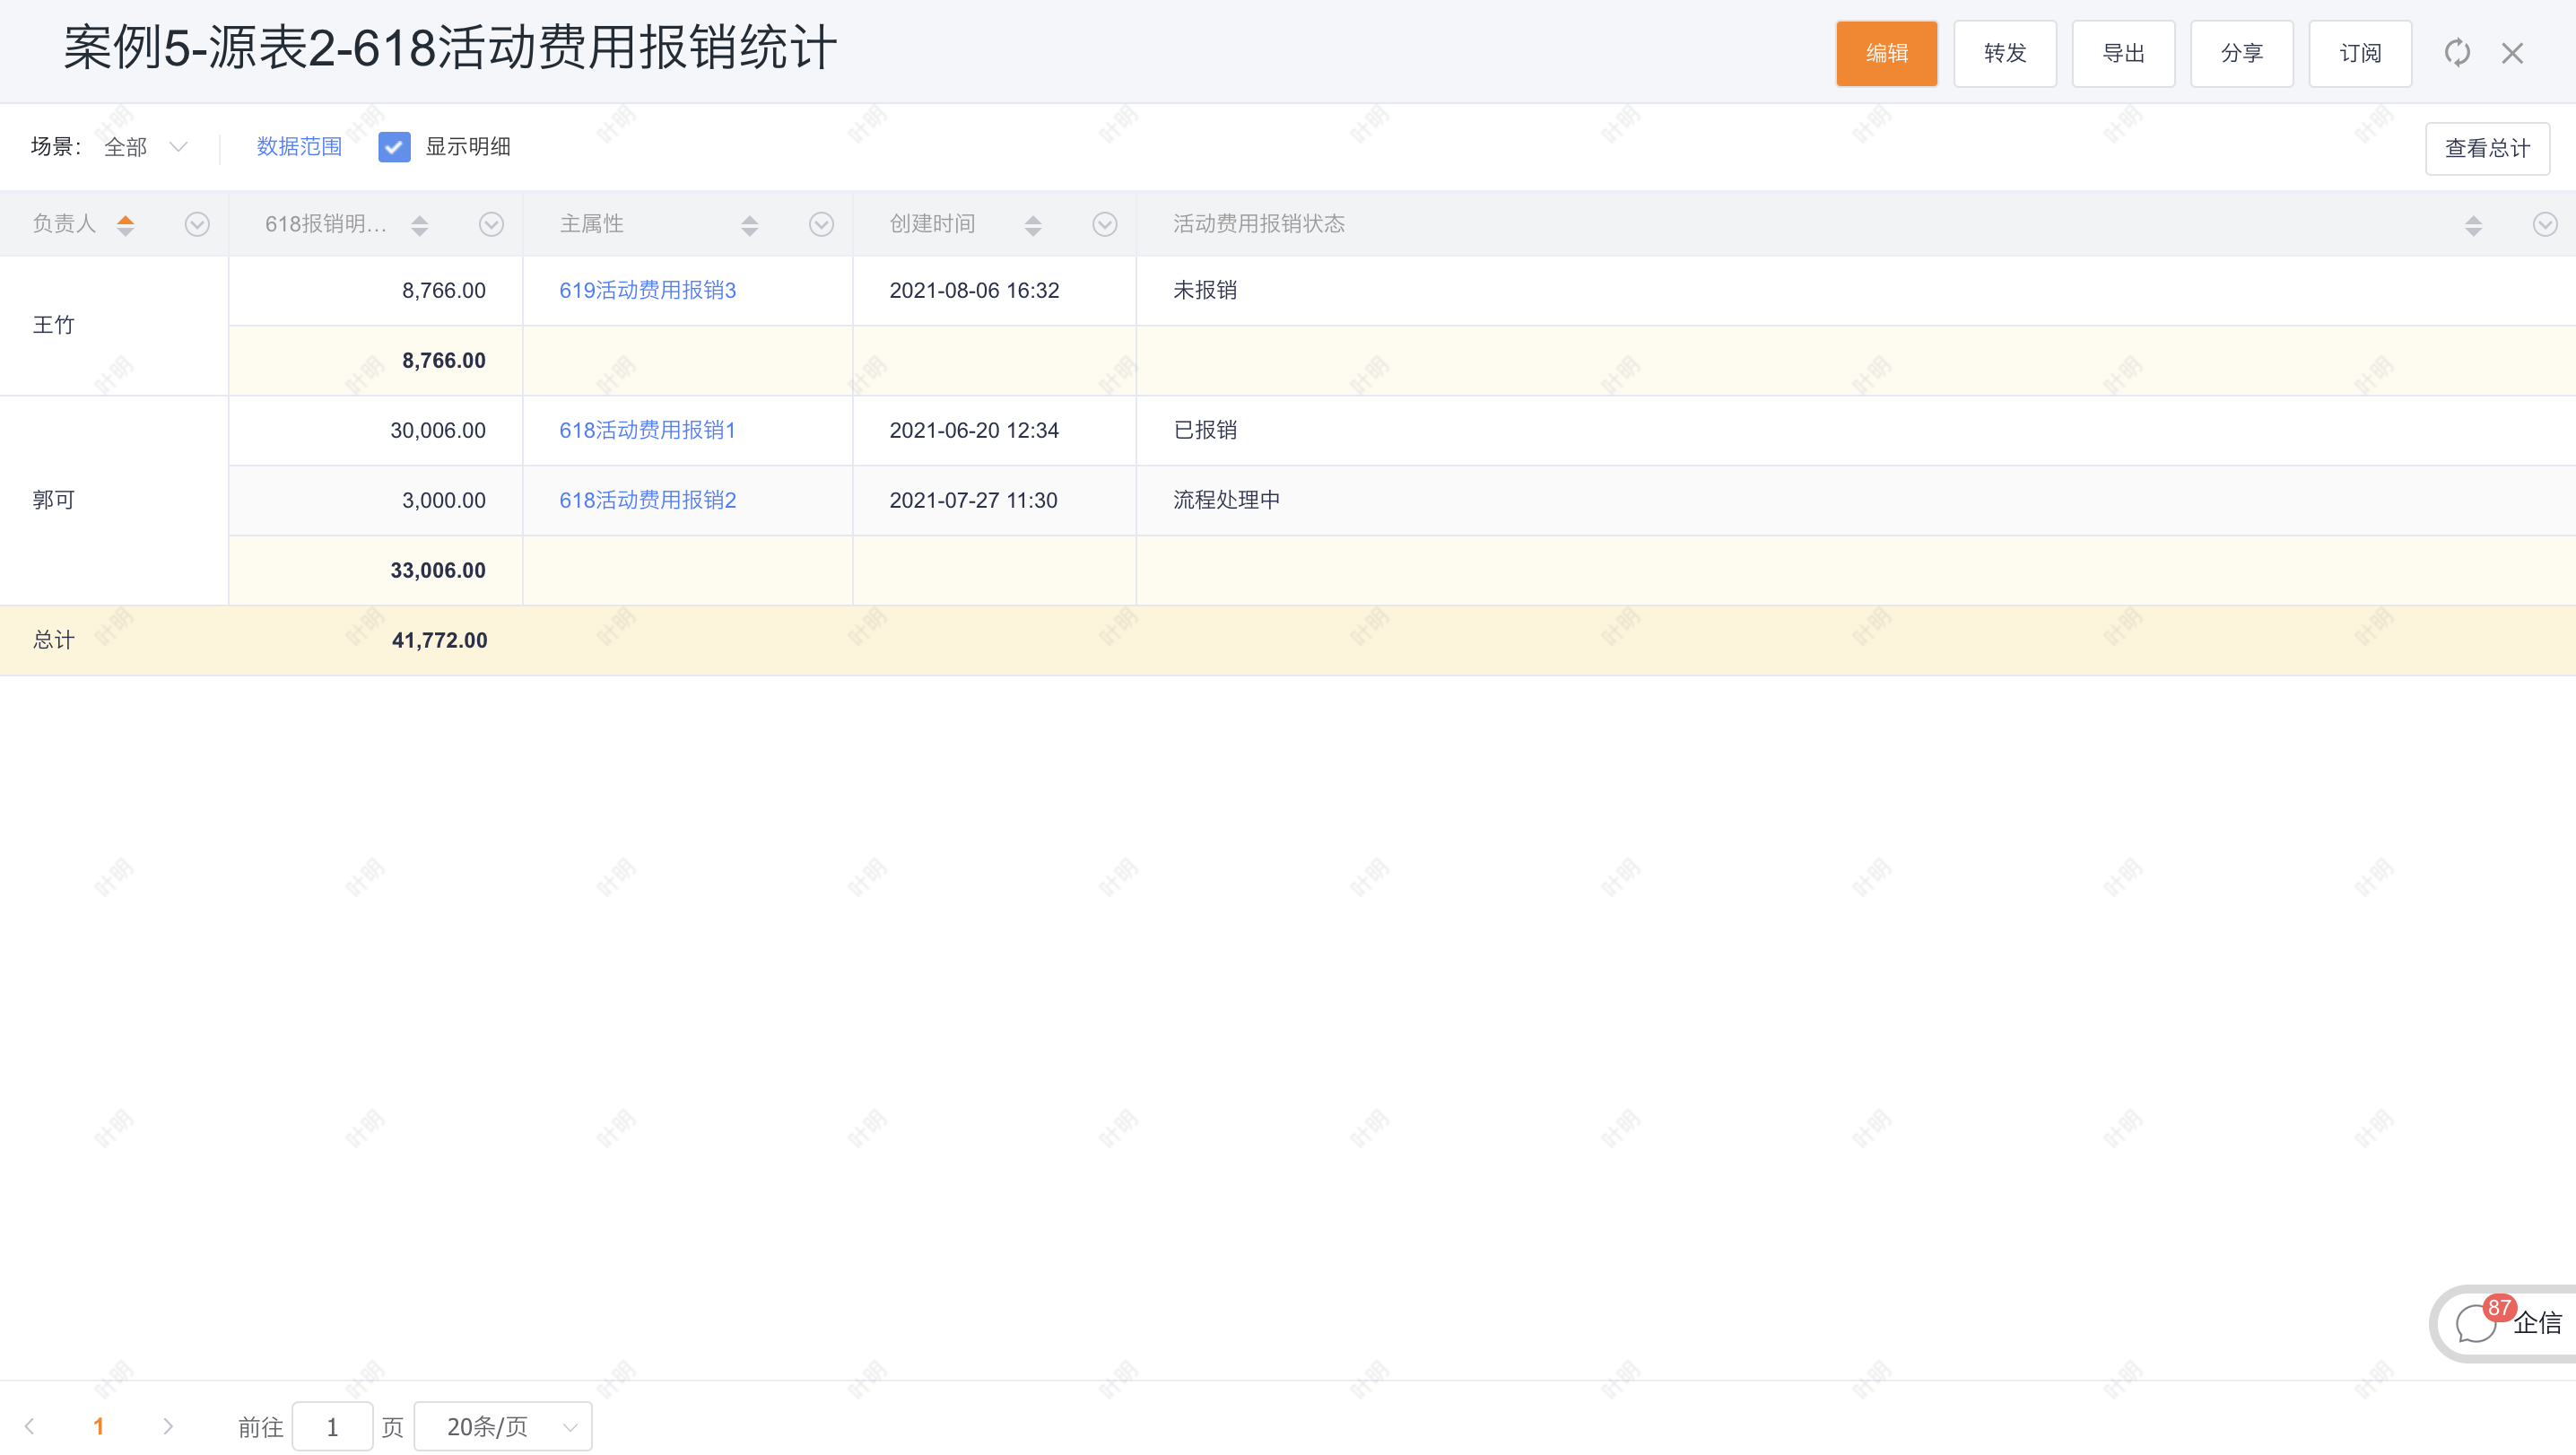
- Core appeal: The expense reimbursement object is used to submit daily expense documents. During the 618 special event, a new independent object for 618 activity reimbursement was created for business convenience. The field configuration is the same as the expense reimbursement object. When calculating the overall cost data at the end of the year, it is hoped that the two types of costs will be counted together.
- Source table configuration:
3.1.1 Configuration process
3.1.1.1 Select source table and association type
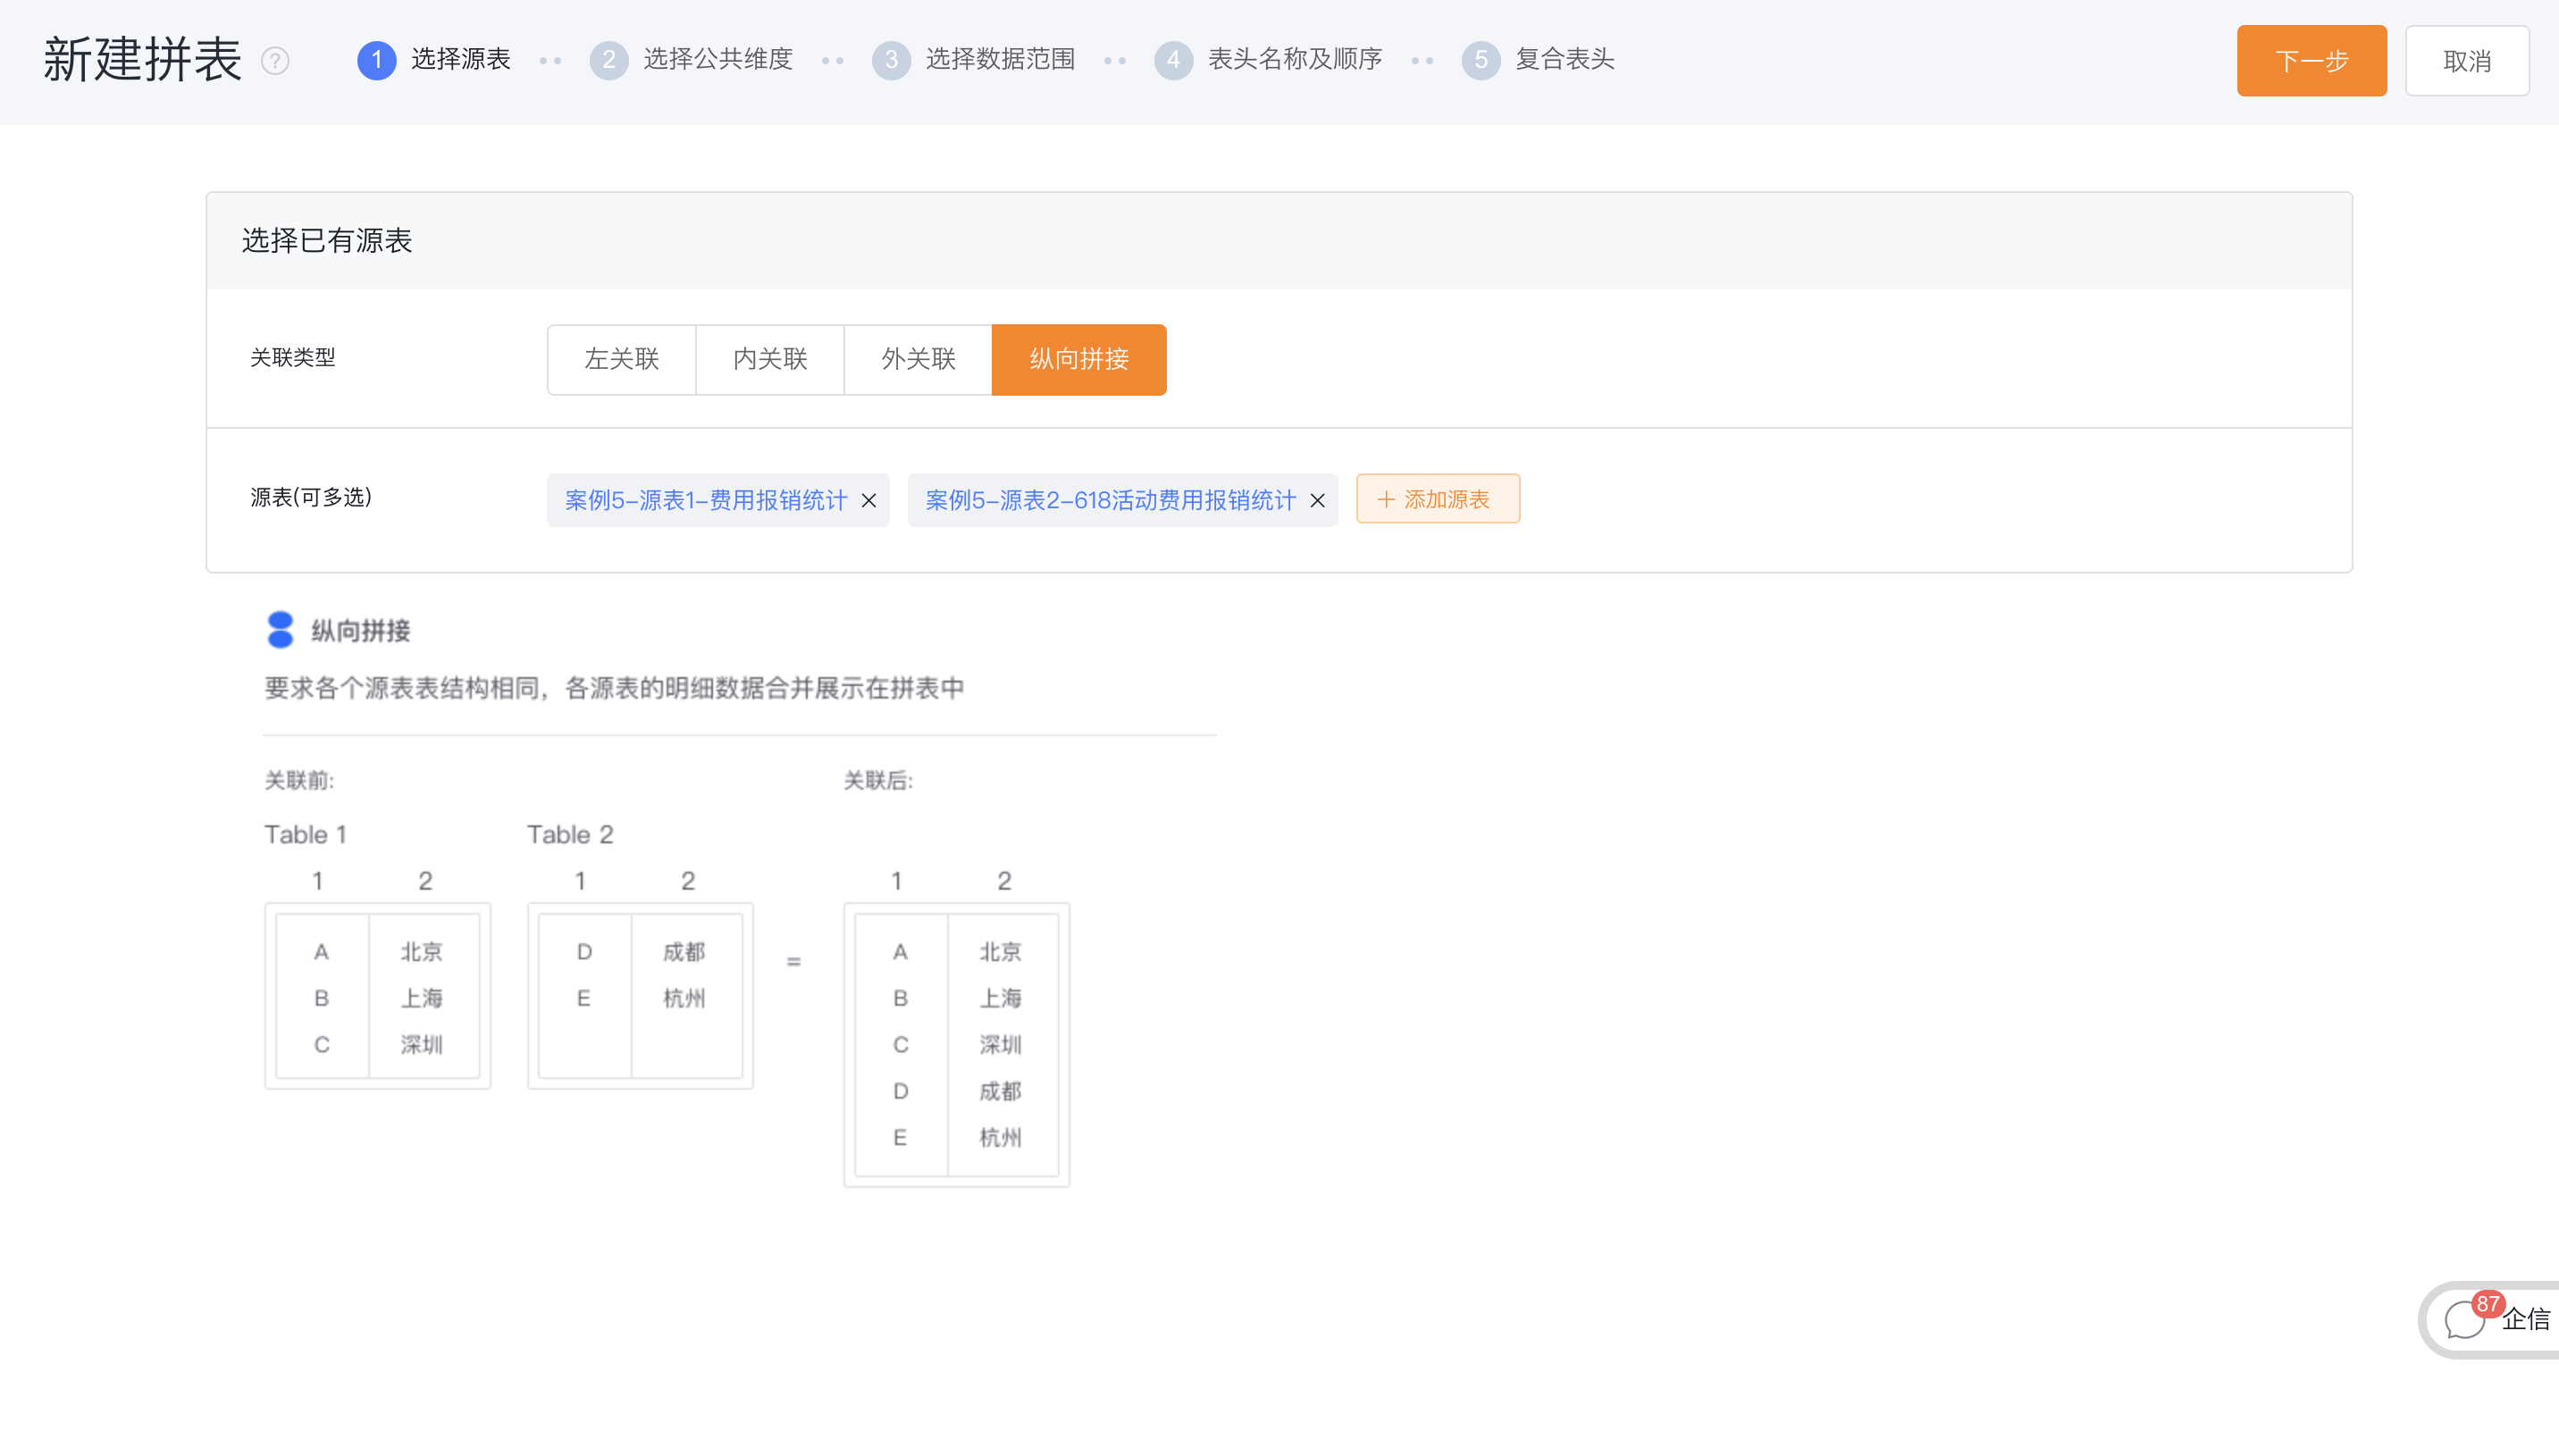
- Source table: the basic table configured based on BI reports and statistical charts, as the source of the combined table;
- Association type: the splicing method of each source table when splicing tables
- 1 Left association: left join, subject to the left source table;
- 2 Inner association: inner join, take intersection;
- 3 Outer association: outer join, take union;
- 4 Vertical splicing: Merge of all data rows;
- Case description: The configuration methods (the number of header fields and the order of grouping fields) of the two source tables need to be the same, but they are taken from different objects. At this time, the association type needs to be selected: vertical splicing, and the data of the two source tables Accumulate according to the unified configuration.
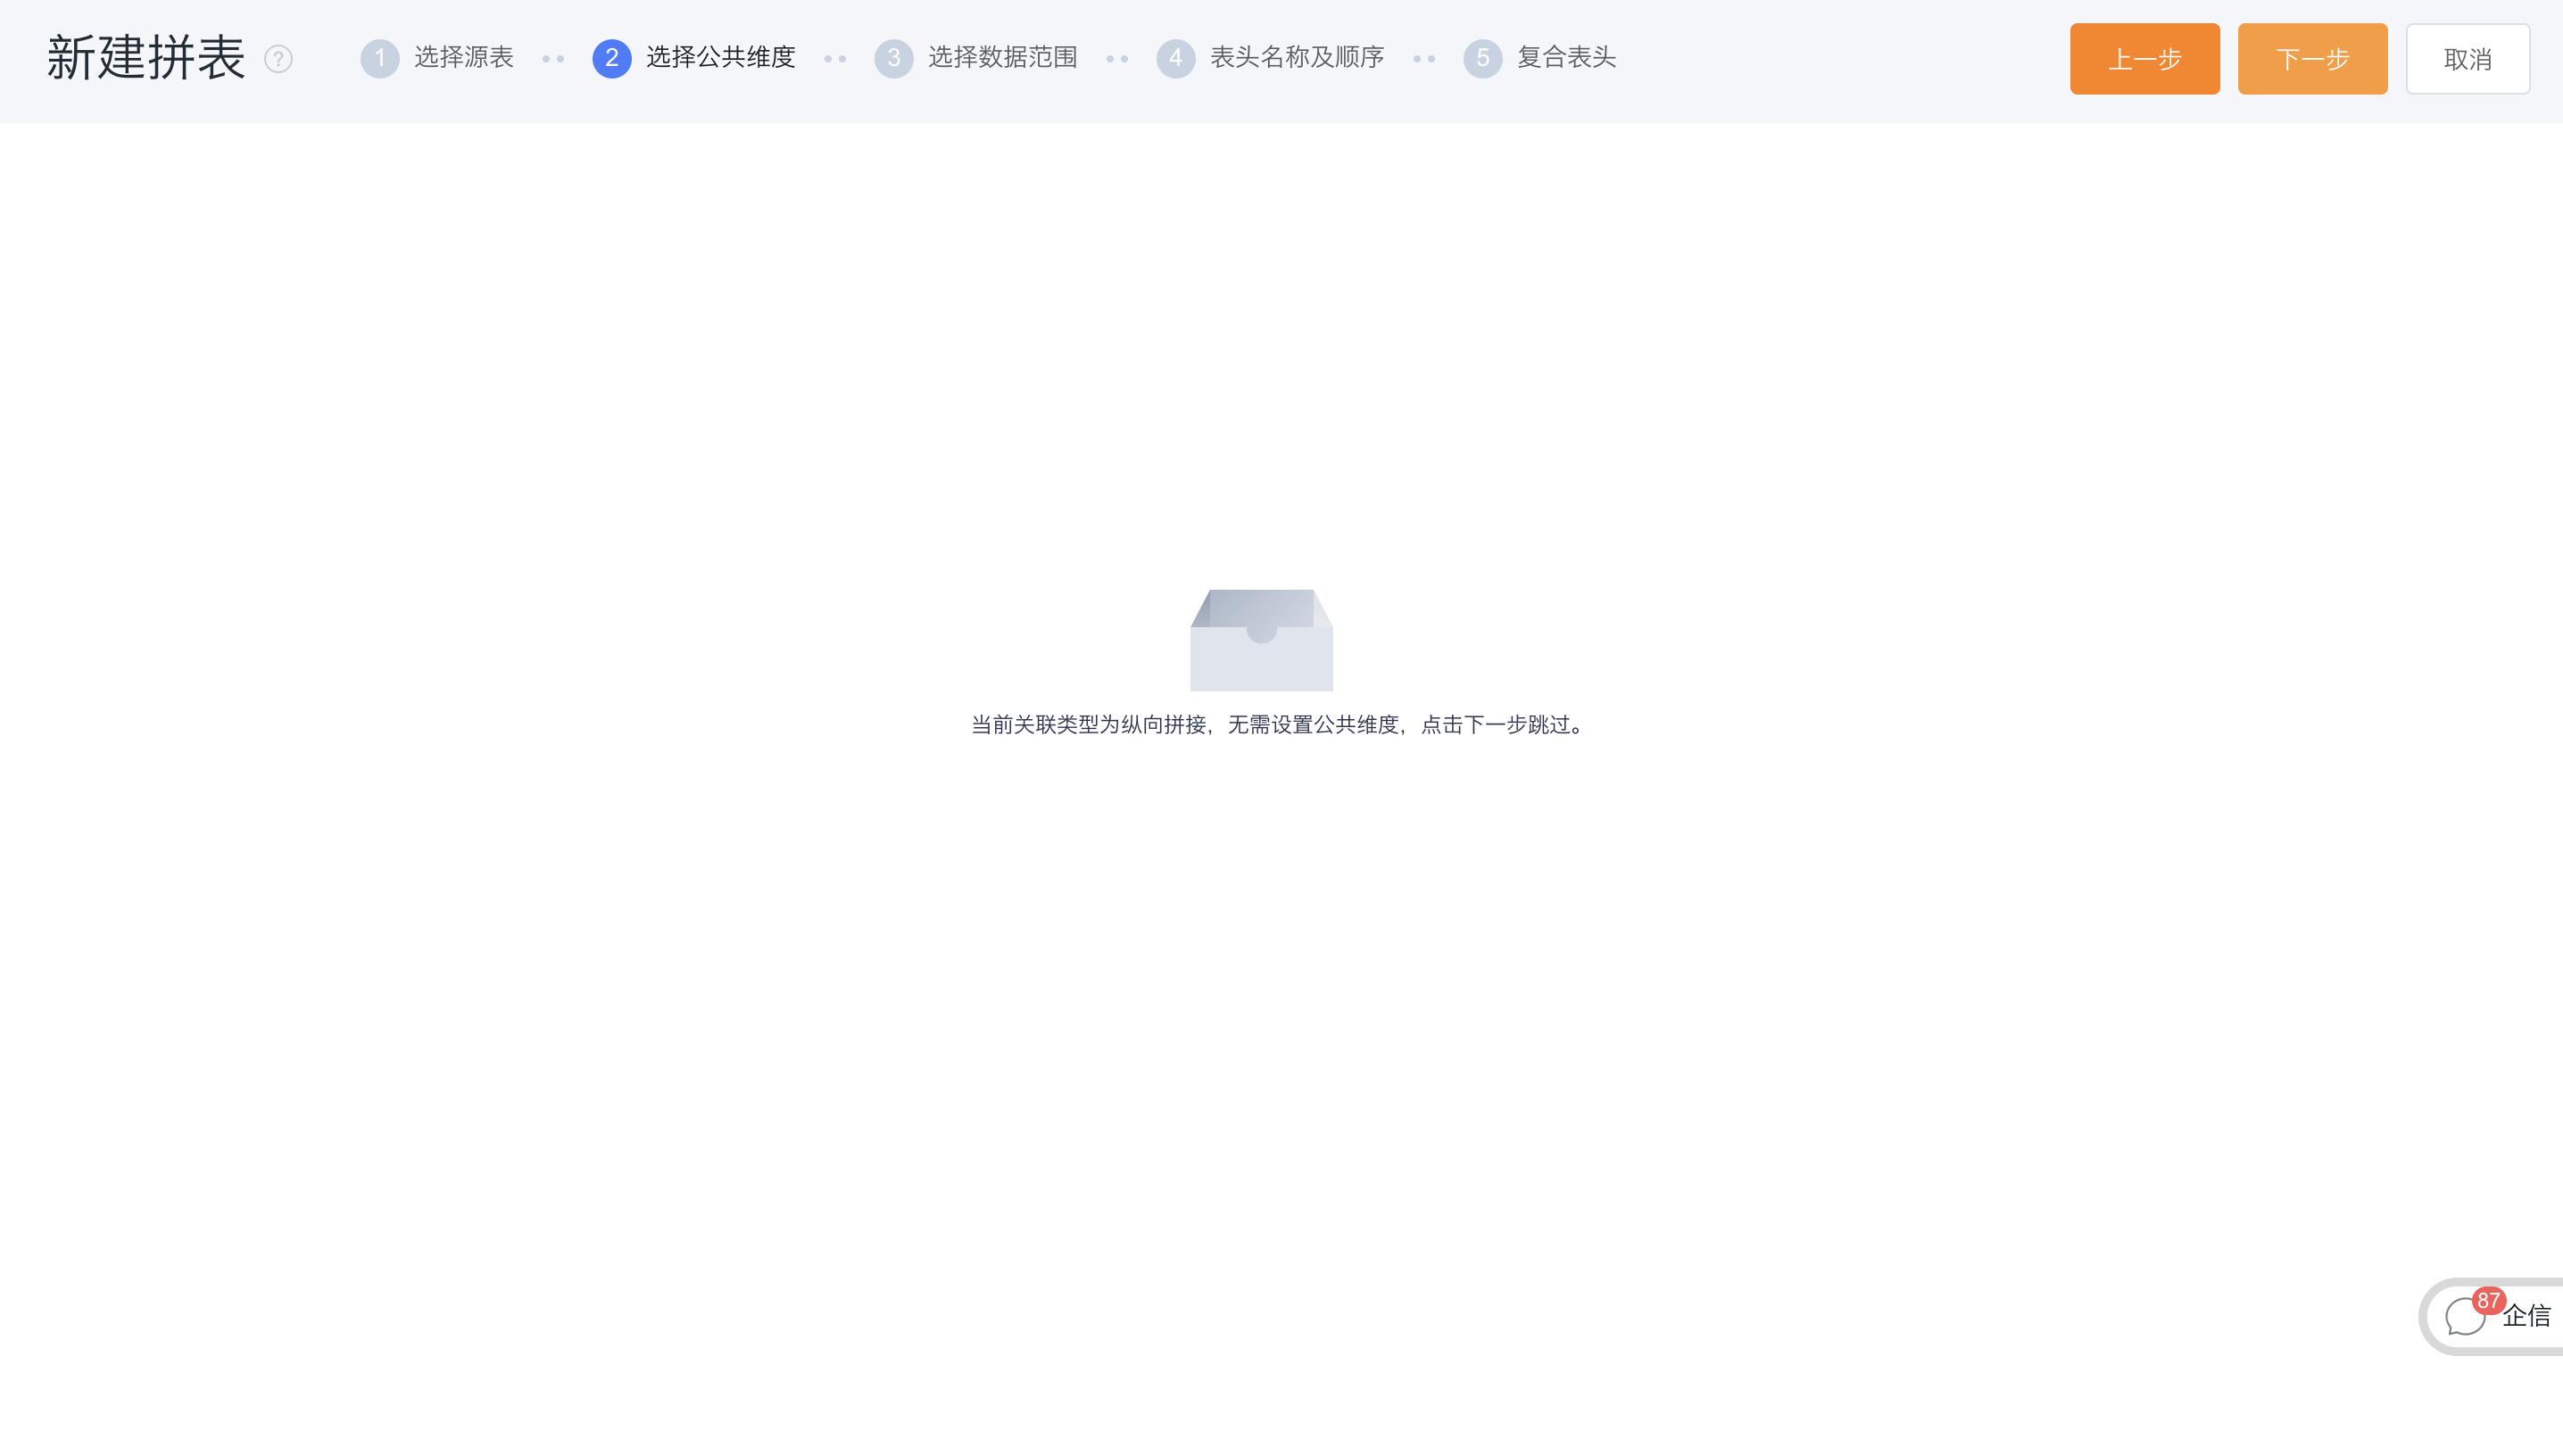
3.1.1.2 Select public dimension
- Common dimension: As the basis for splicing multiple source tables, generally the grouping/dimension fields with the same meaning in each source table click on the fields with the same meaning in each source table and add them to the right to form a set of common dimensions, which will be used as the splicing table Grouping/dimension fields, displayed by renamed field names.
- Case description: When the association type is vertical splicing, there is no need to specify a common dimension and go directly to the next step.
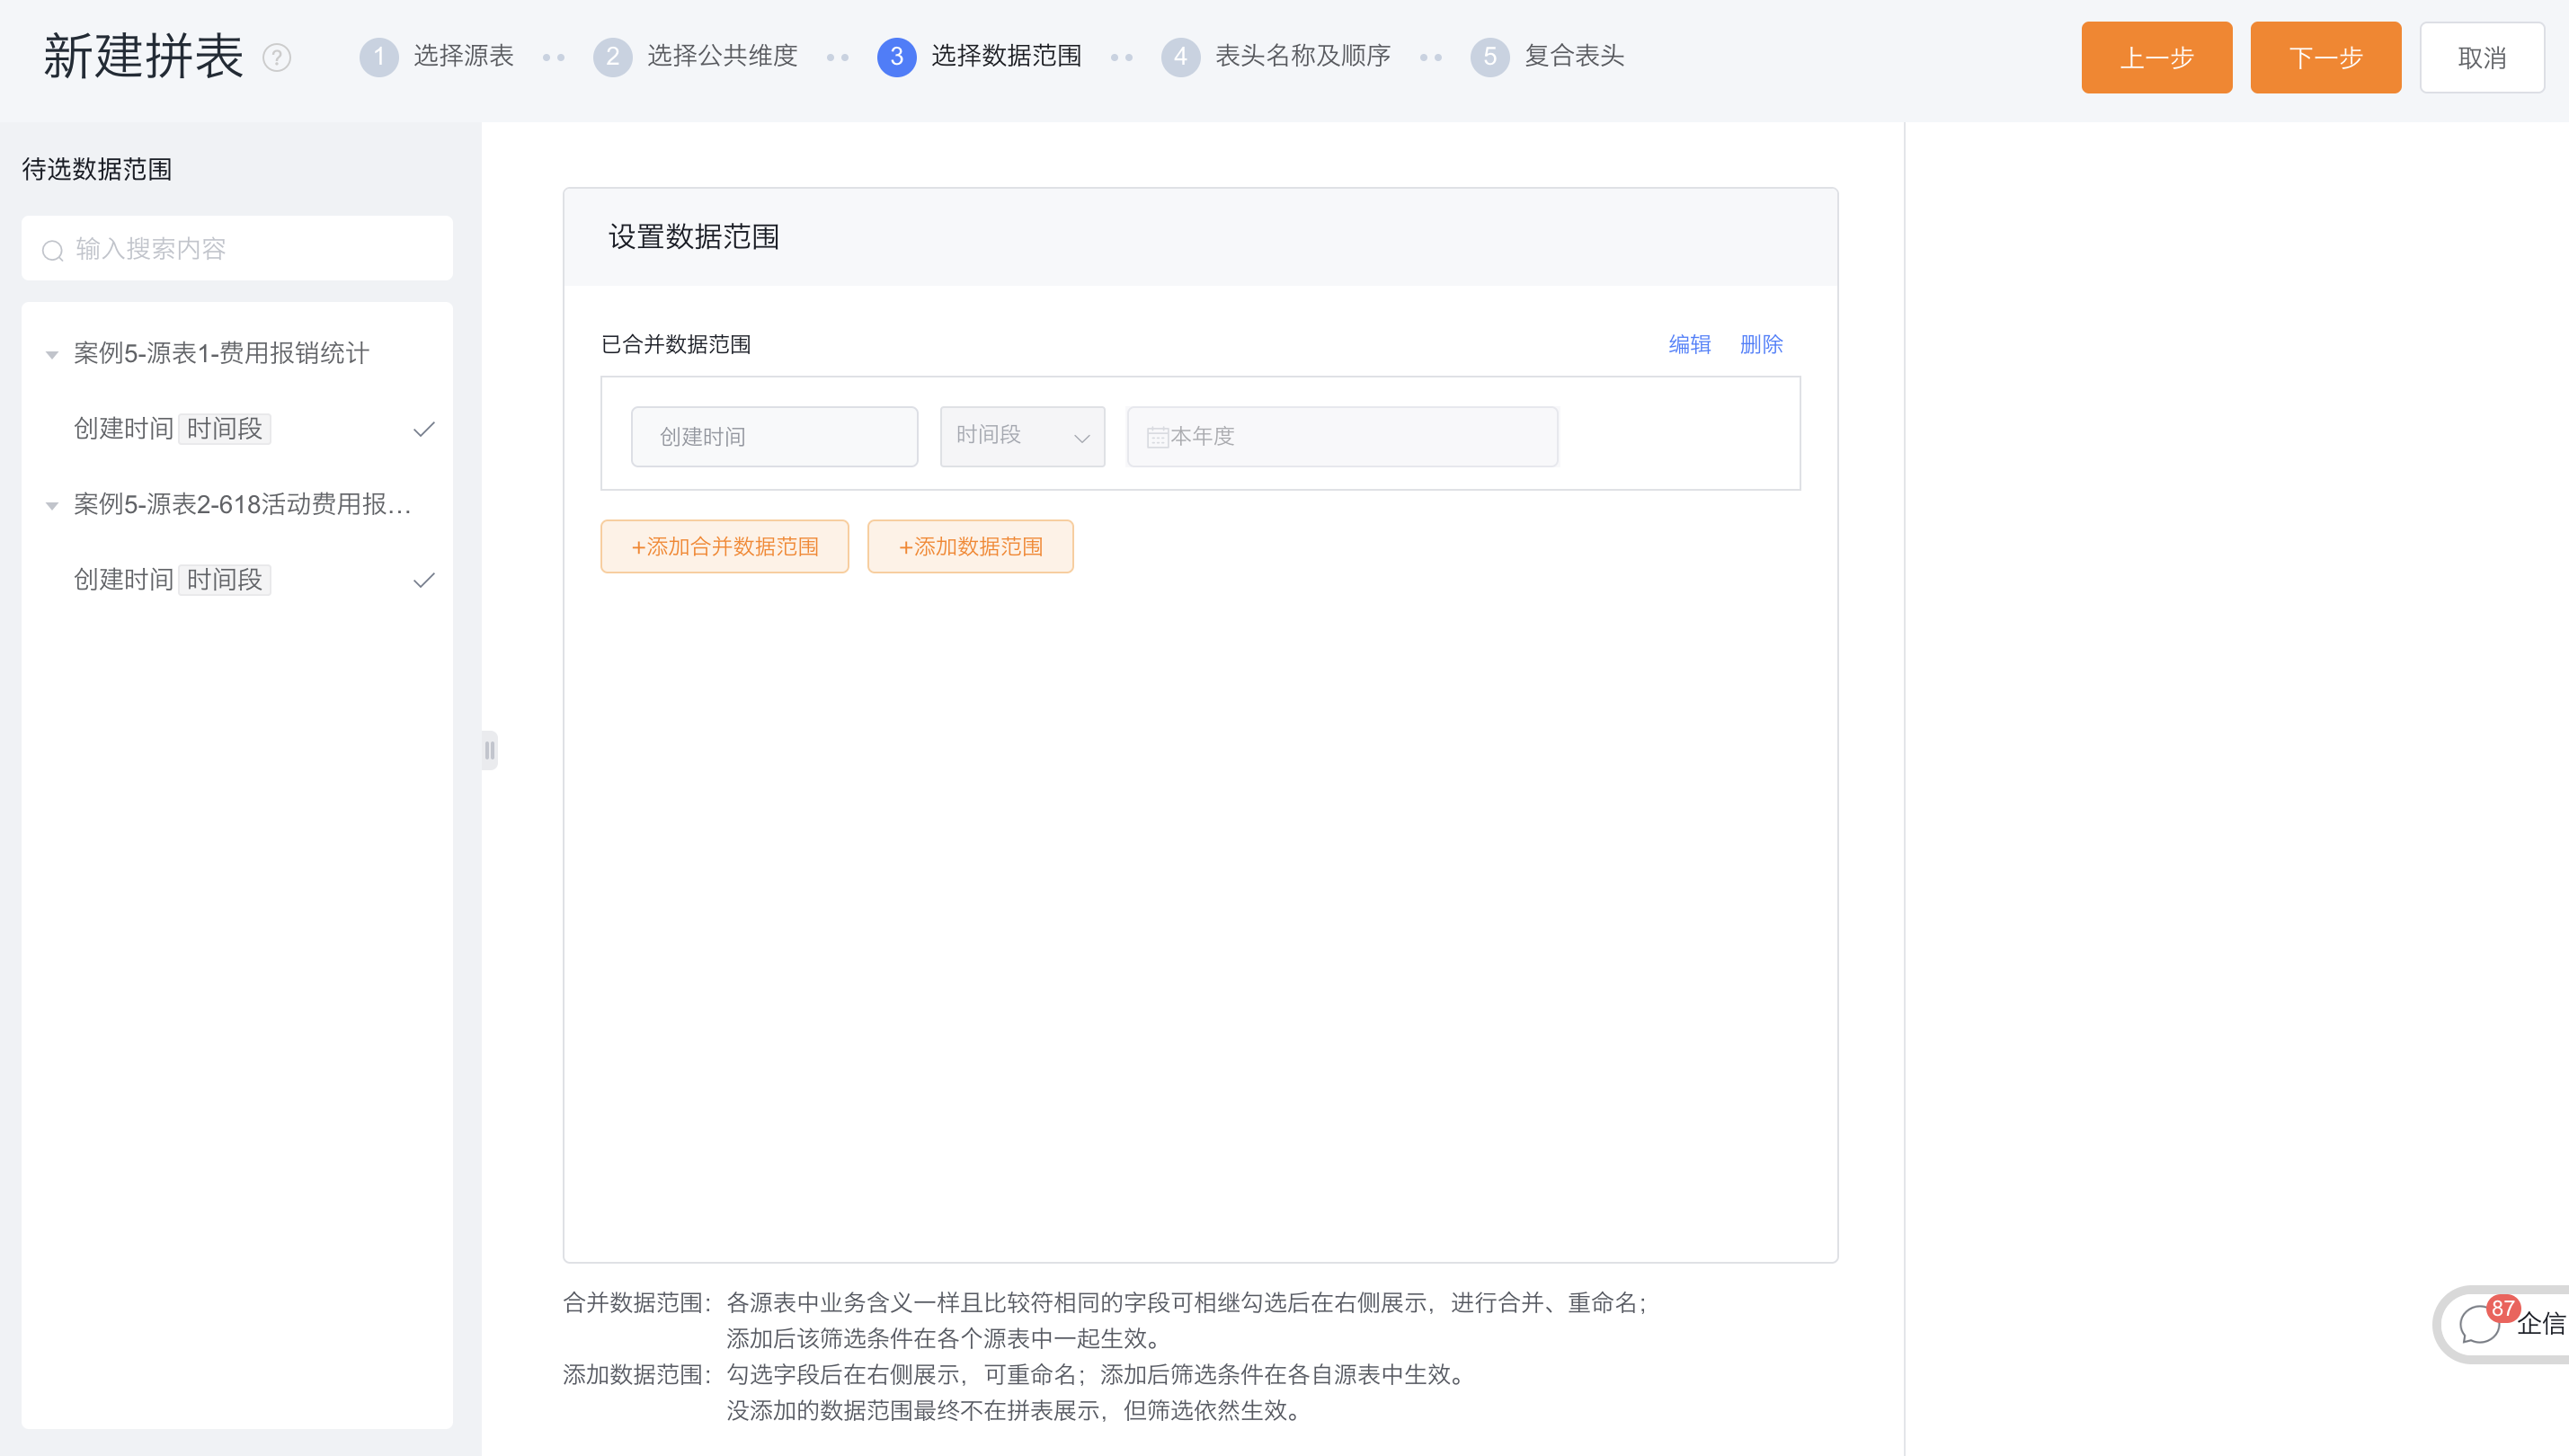
3.1.1.3 Select data range
- Add merged data range: the common data range of each source table is similar to the common dimension, click on the left to add to the right as a group. Clicking "Merge" means that it will eventually be merged into one filter condition to be used in the data range of the stitching table, and displayed according to the renamed field name. The default values for the filter can also be modified here.
- Add data range: In addition to the public data range, other filter conditions, which need to be exposed in the data range after the table is assembled. Filter conditions that have not been added will not be displayed in the data range of the combined table, and will work according to the default configuration of the source table.
- Case Description: When splicing vertically, the method of adding data ranges is similar to other association methods. In this example, the creation time is used as the public data range.
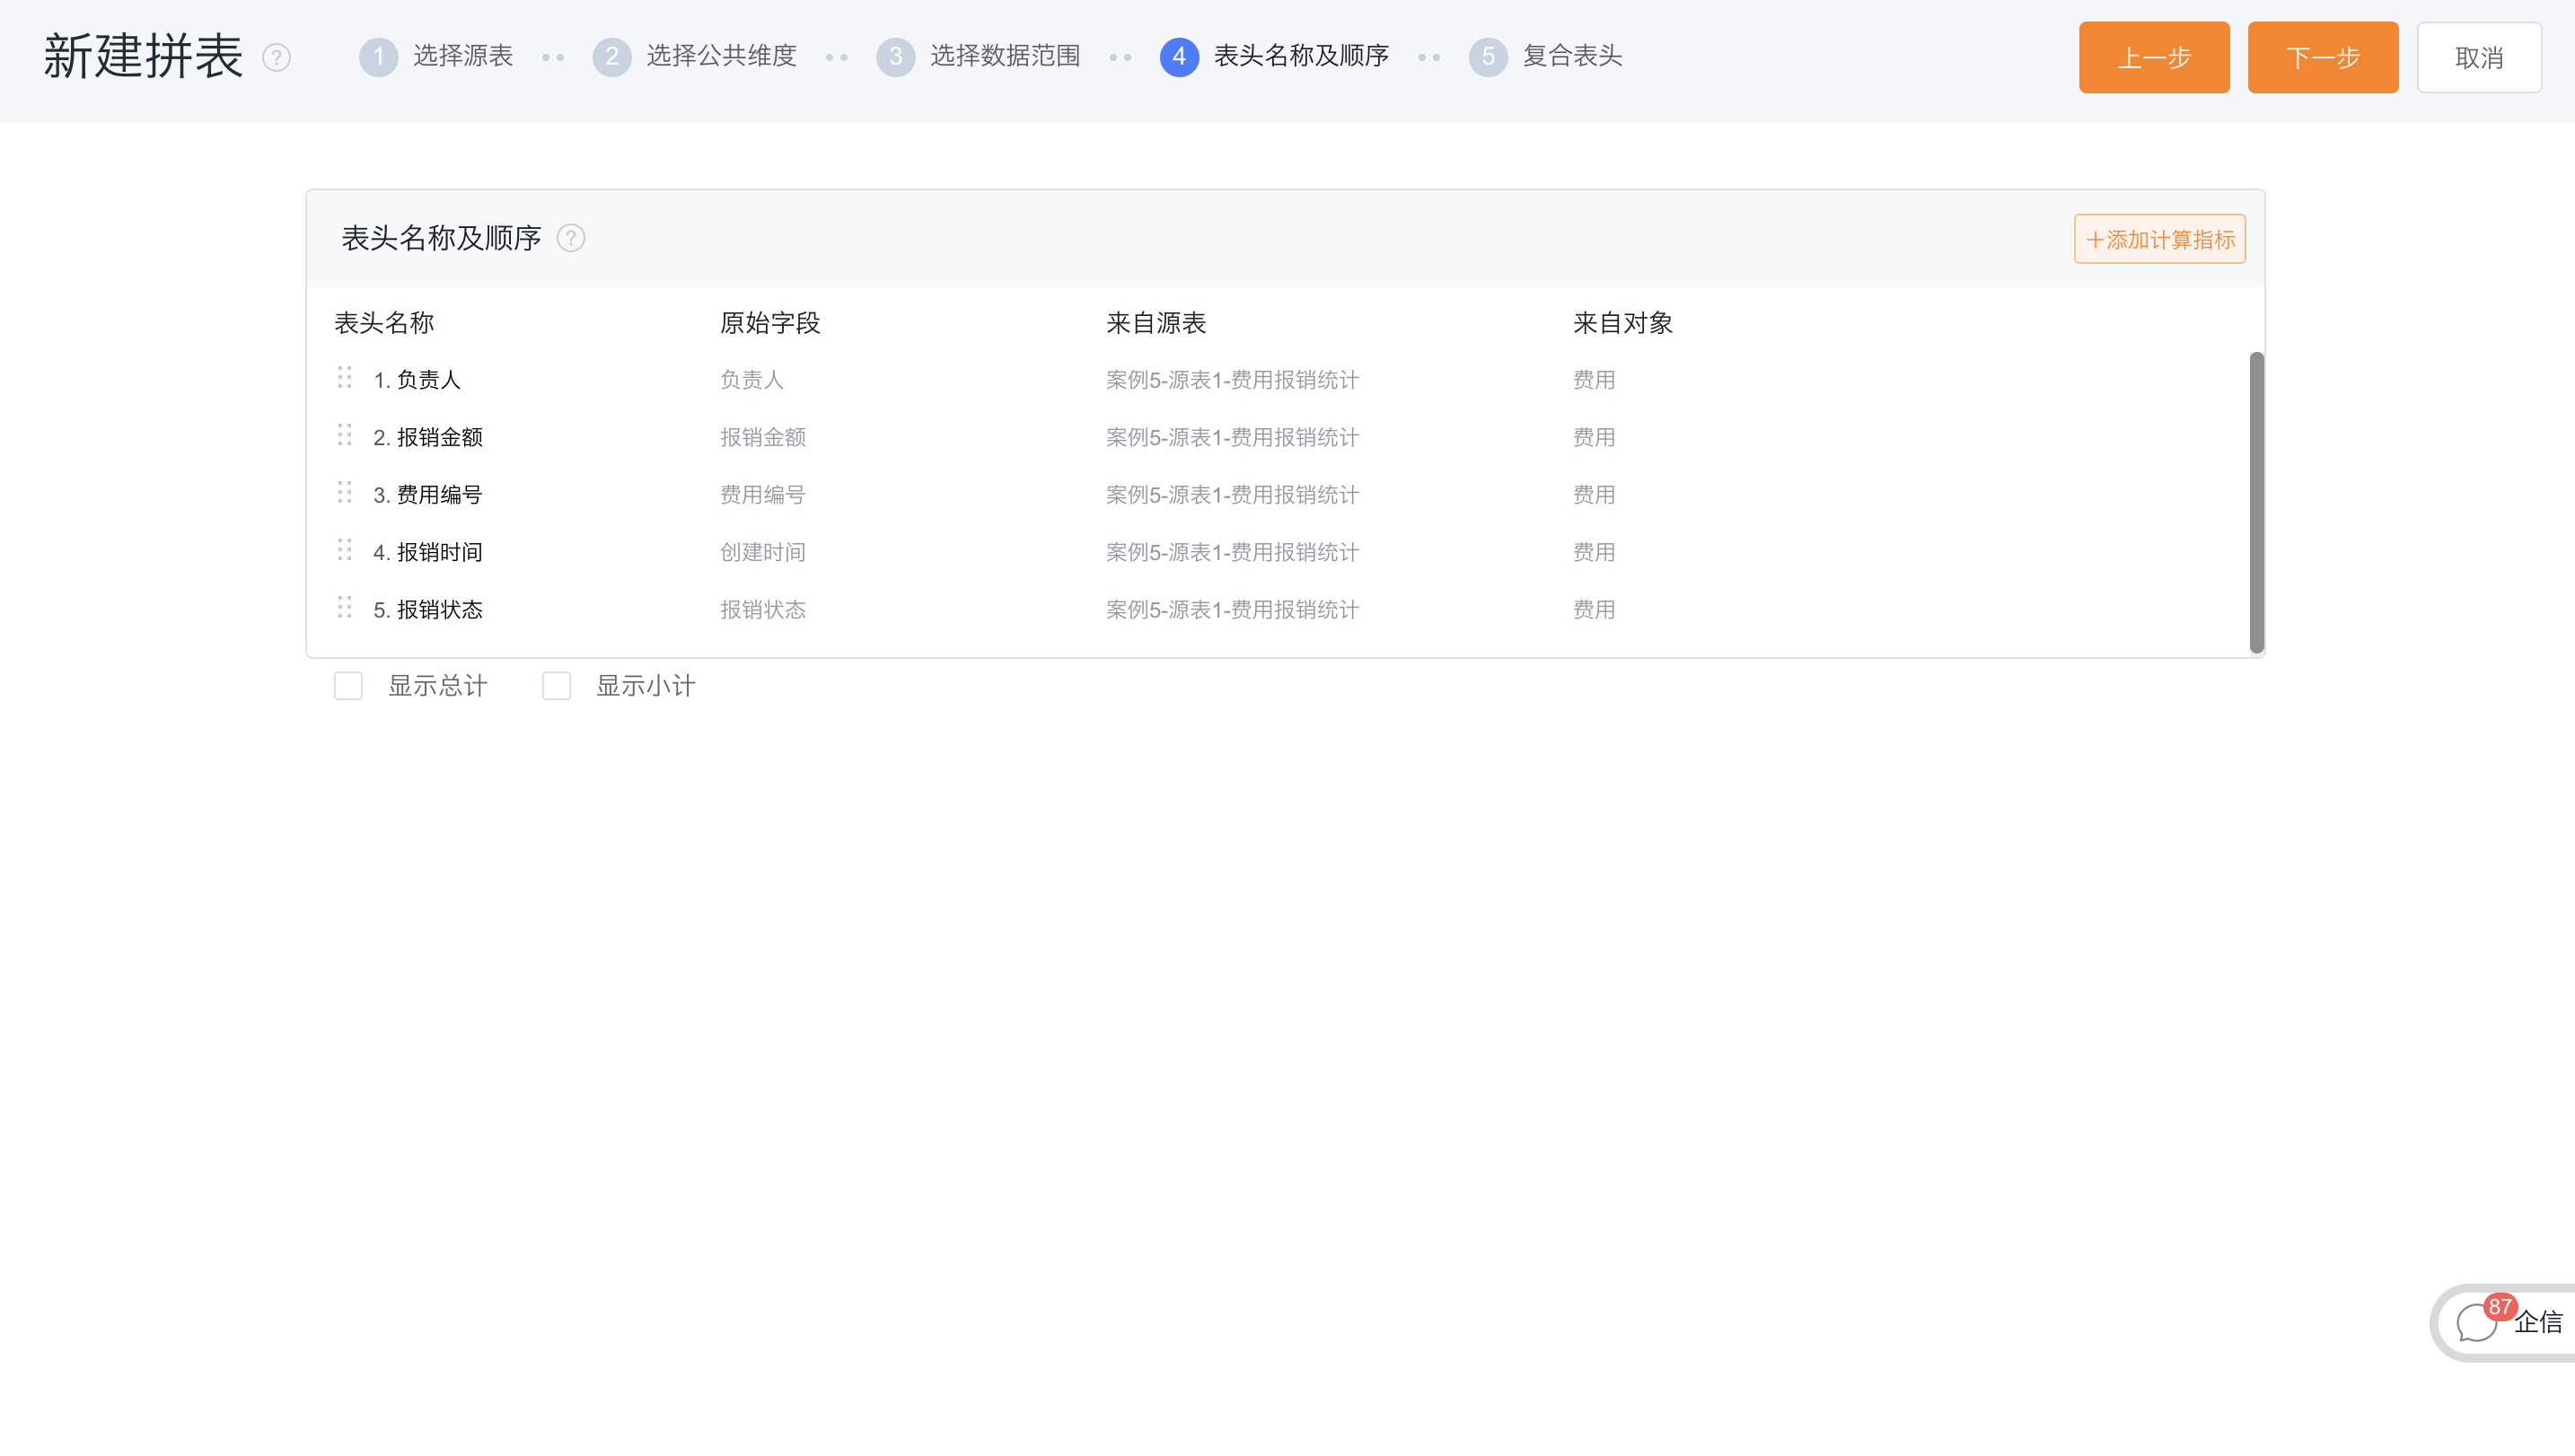
3.1.1.4 Header name and sequence
- Header name: The field name of the public dimension is displayed according to the setting in the second step, which cannot be modified here, and other field names can be modified as required.
- Adjust the order: Drag and drop to adjust the order of the columns, where the common dimension must be at the front and cannot be adjusted.
- Add and hide columns: You can add calculated indicators as new columns; you can hide columns that don't need to be displayed in the spelling table.
- Case description: When splicing vertically, the column order is strictly arranged in the order of the source table, and modification is not allowed. By default, the column name will be the header name of the first source table, and it can be changed to the final name to be displayed as needed.
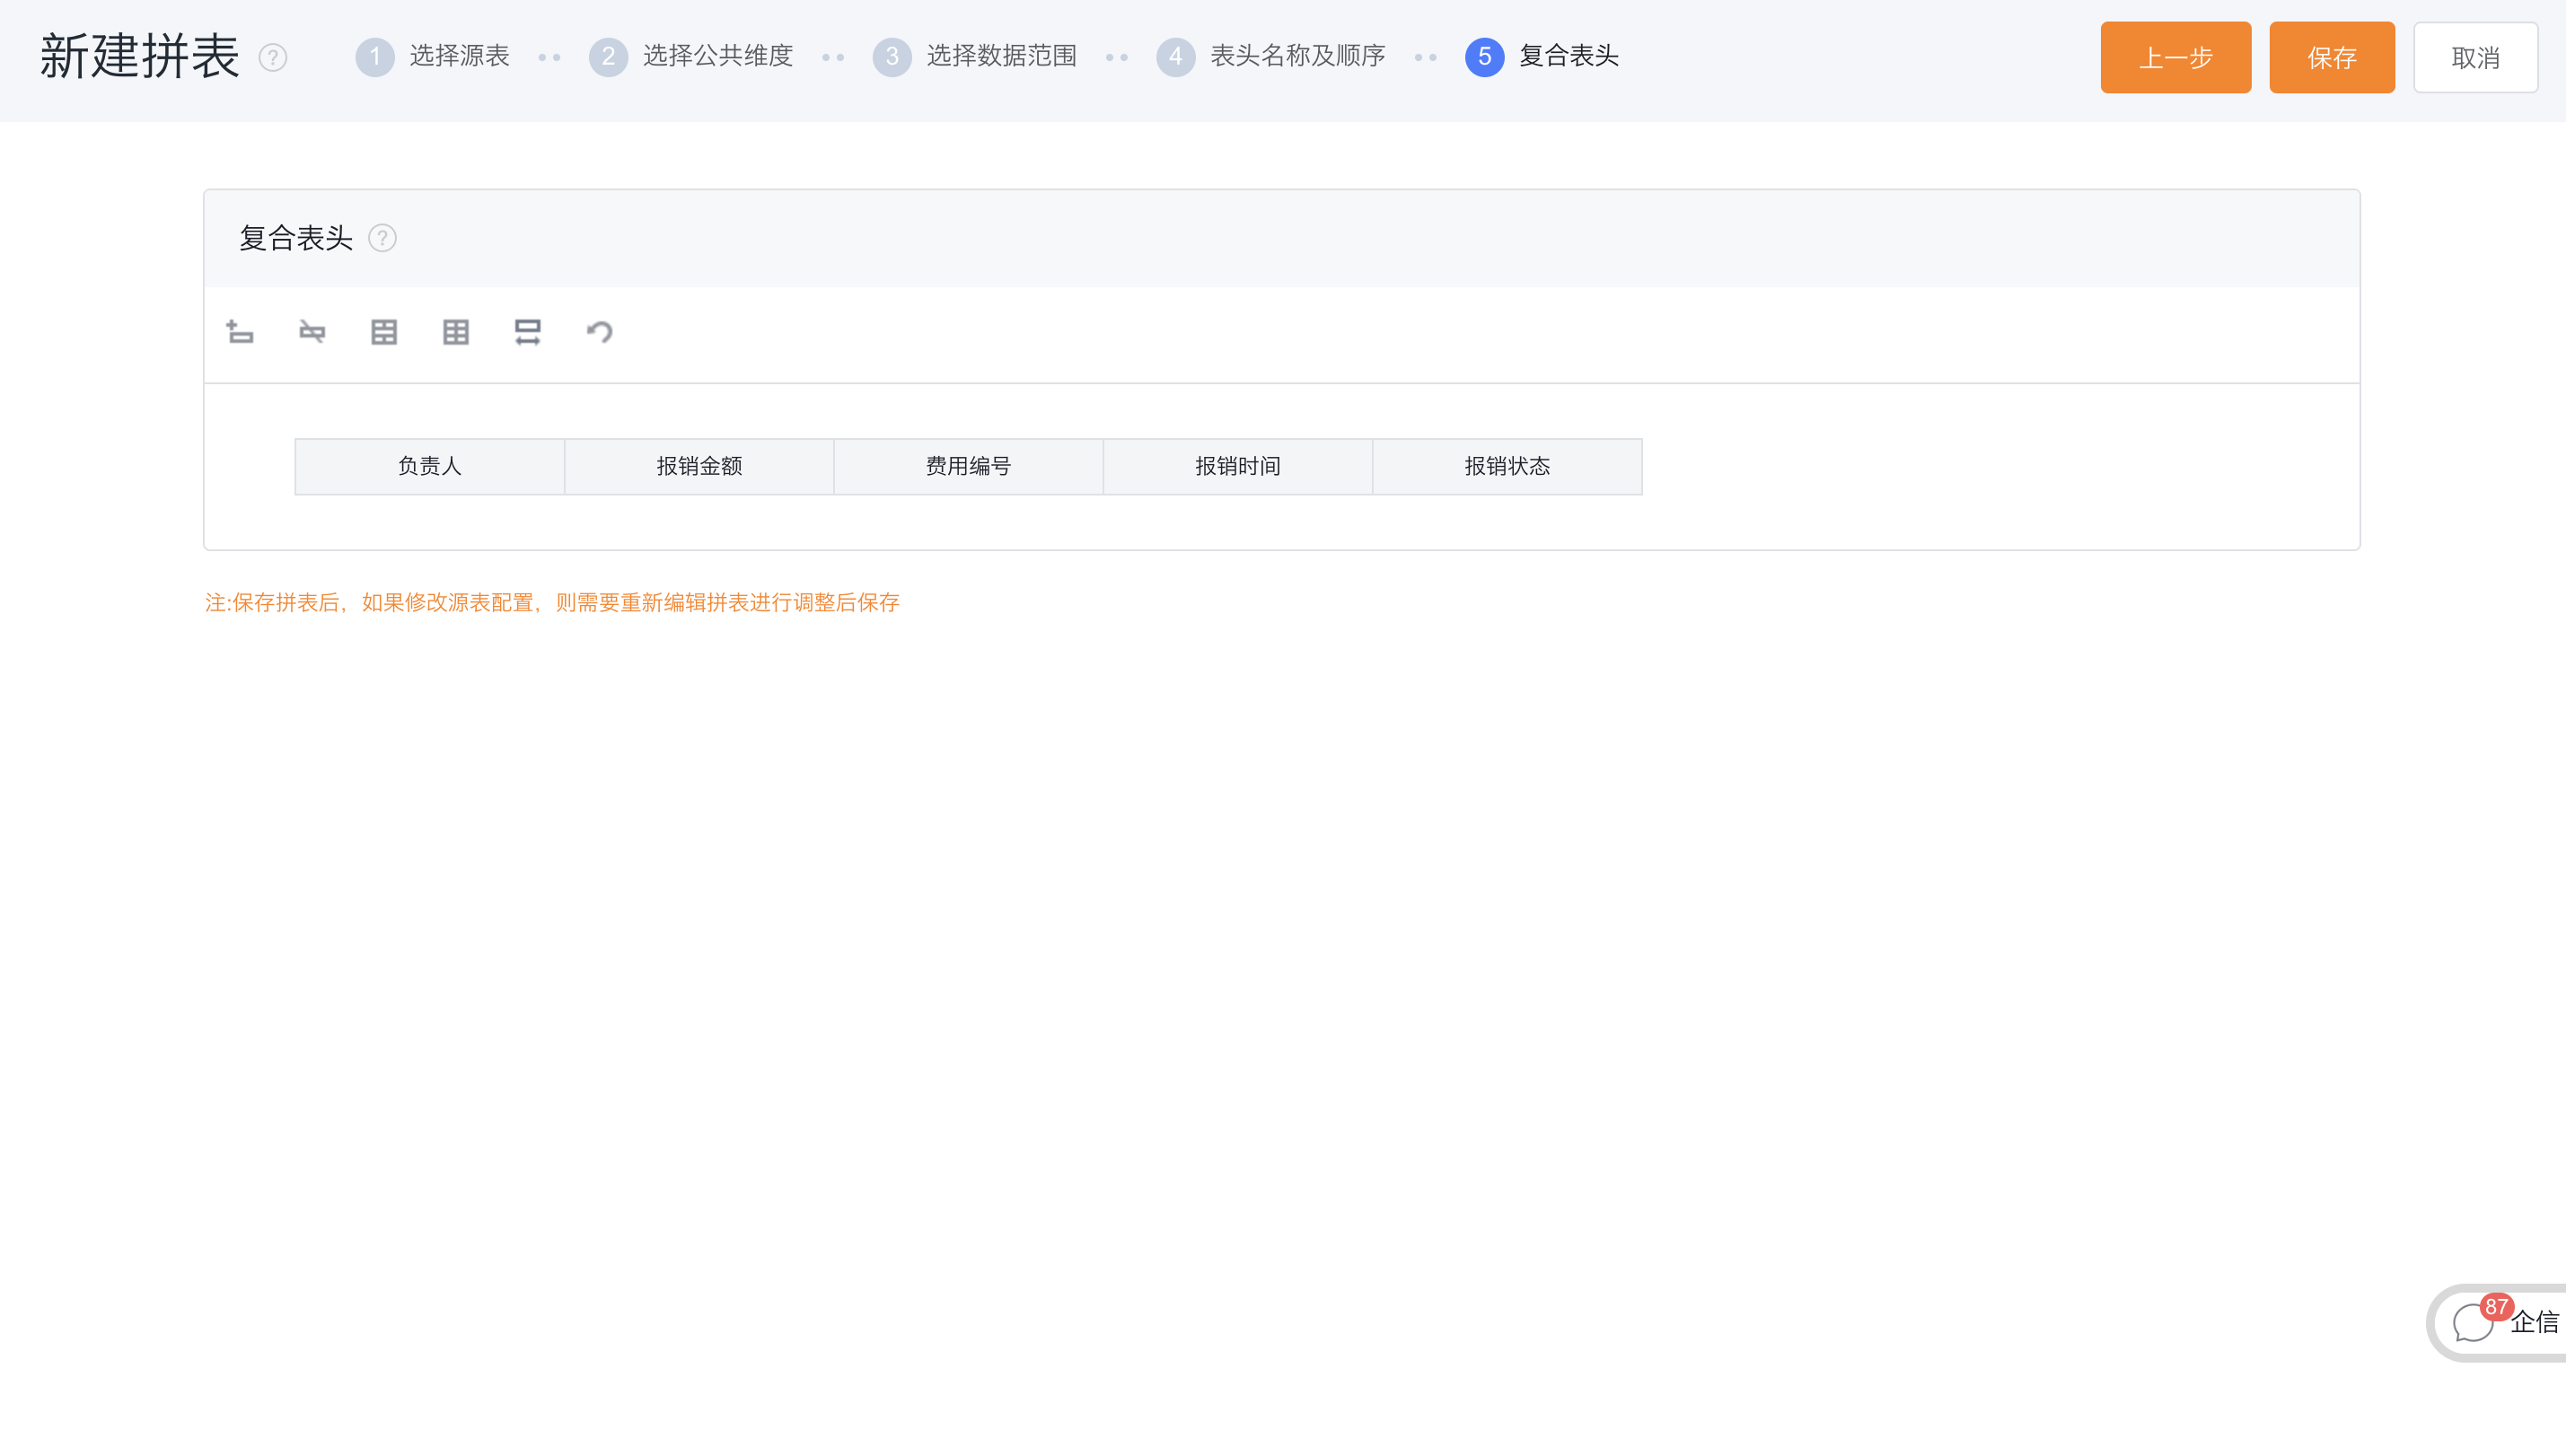
3.1.1.5 Composite header
-
Composite header: Display the title and order of the headers adjusted in the previous step, and add multiple layers of composite headers to the top.
-
operate:
Add row: add a new row above; Delete row: delete the selected row; Merge cells: Merge multiple cells in the mouse circle; Split cell: split the merged cell back to the original cell; Compact mode: compact mode can be set; Back: Go back to the previous step; Modify column width: Click the original header to modify the column width; Modify the display name: Click the added grid to modify the display name; -
Case Description: This case does not need to add a composite header, just save it directly.
3.1.2 Table spelling results
4. Splicing of special filter conditions
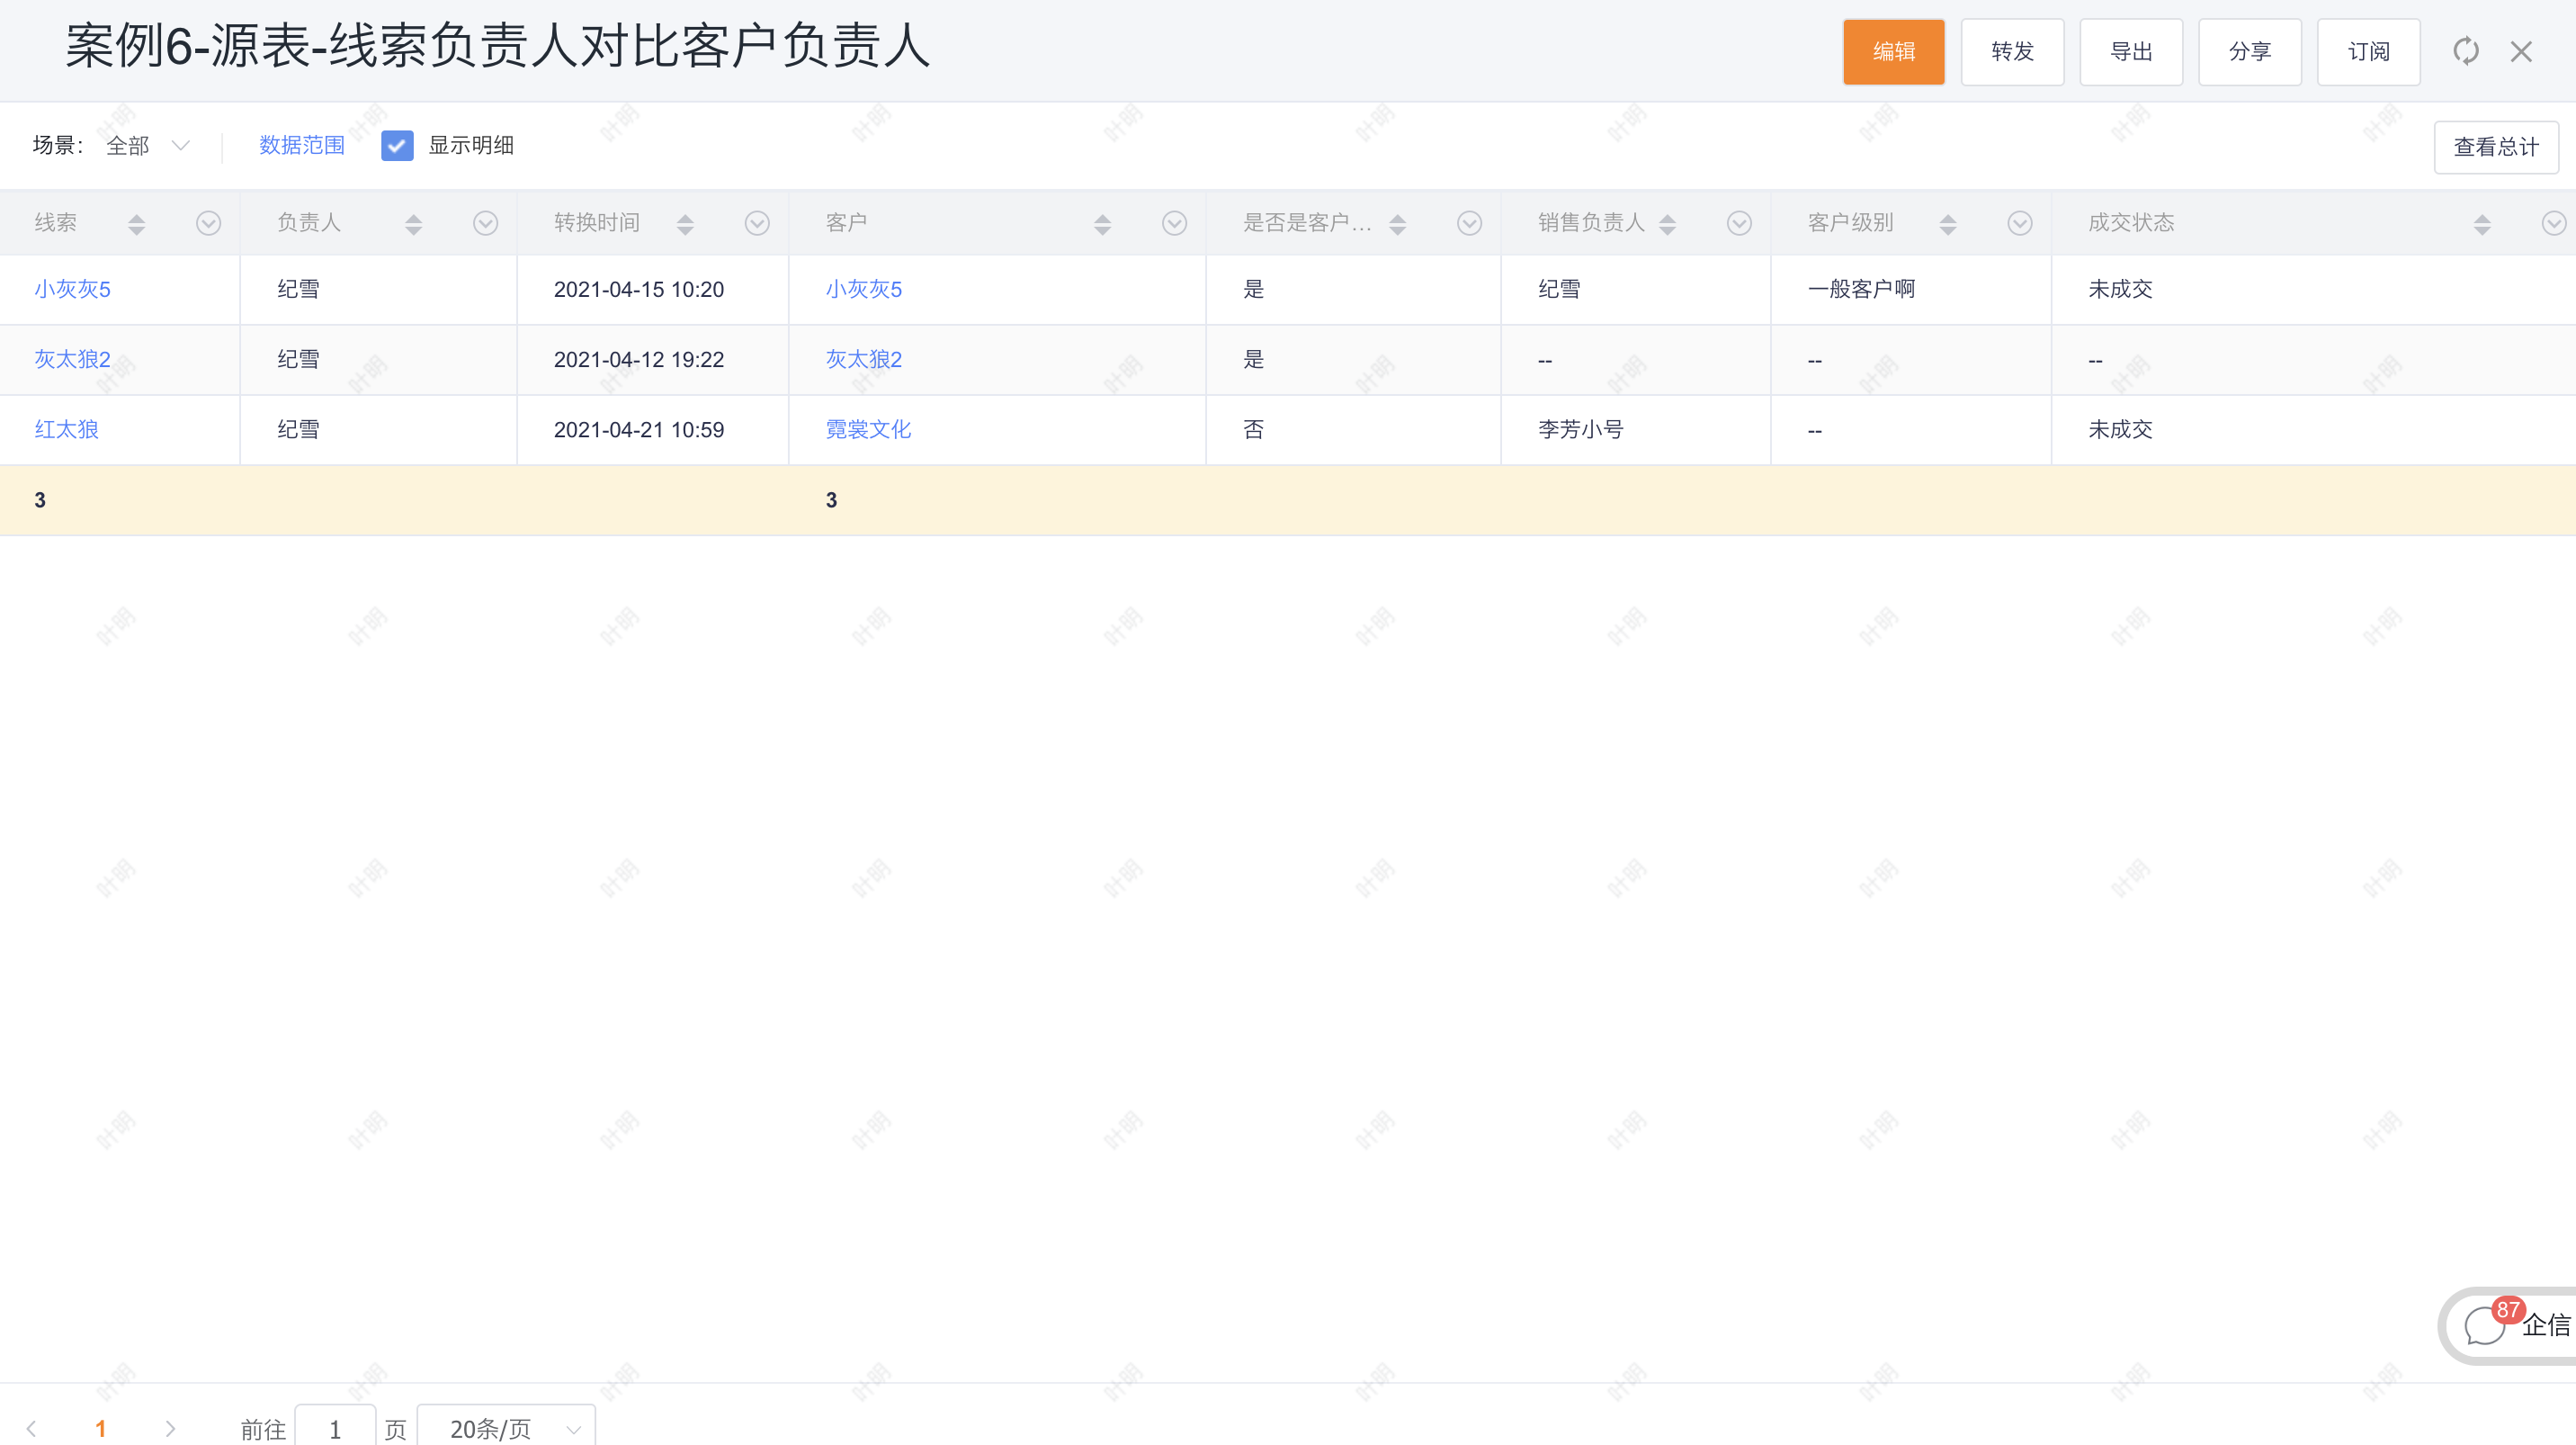
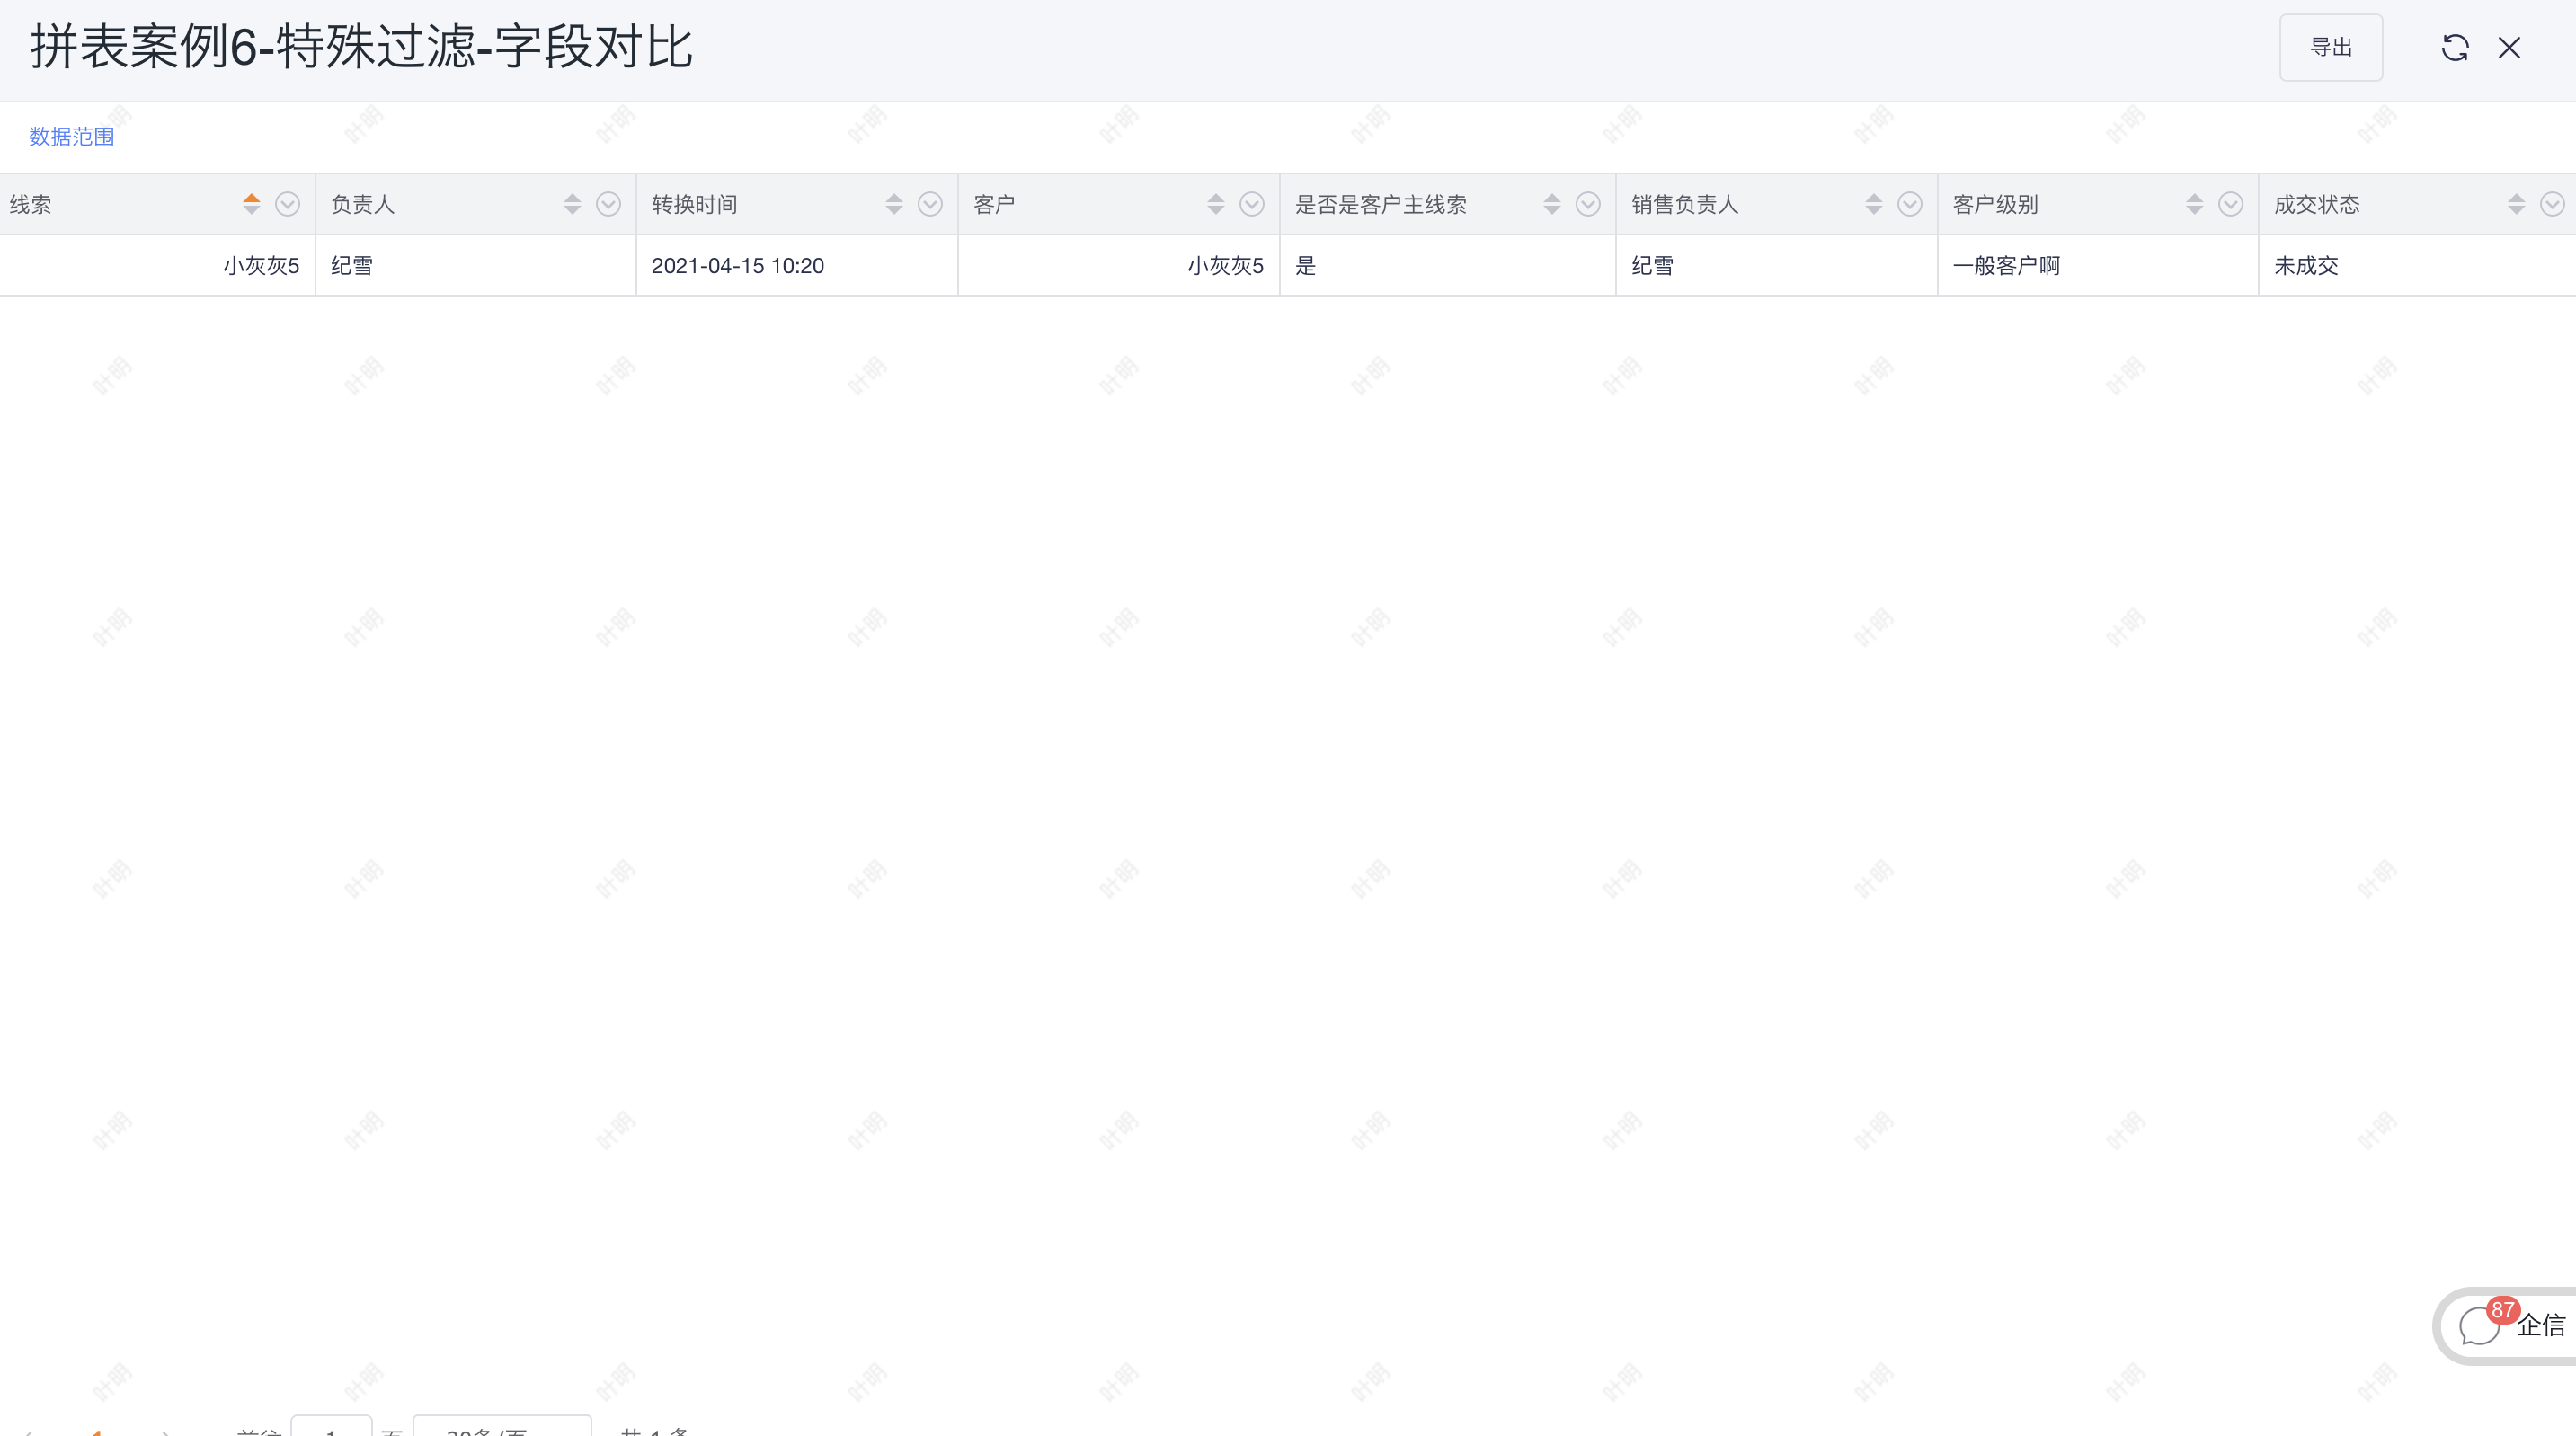
4.1 Case 6: Special Filter - Field Comparison
- Core appeal: Sometimes we need to do some special filter conditions, not to filter the value of a certain field, but to compare whether the values of two fields are the same. In this case, in the report of existing lead conversion, it is hoped to add a comparison of whether the person in charge of the lead and the person in charge of the customer are the same person;
- Source table configuration:
4.1.1 Configuration process
4.1.1.1 Select source table and association type
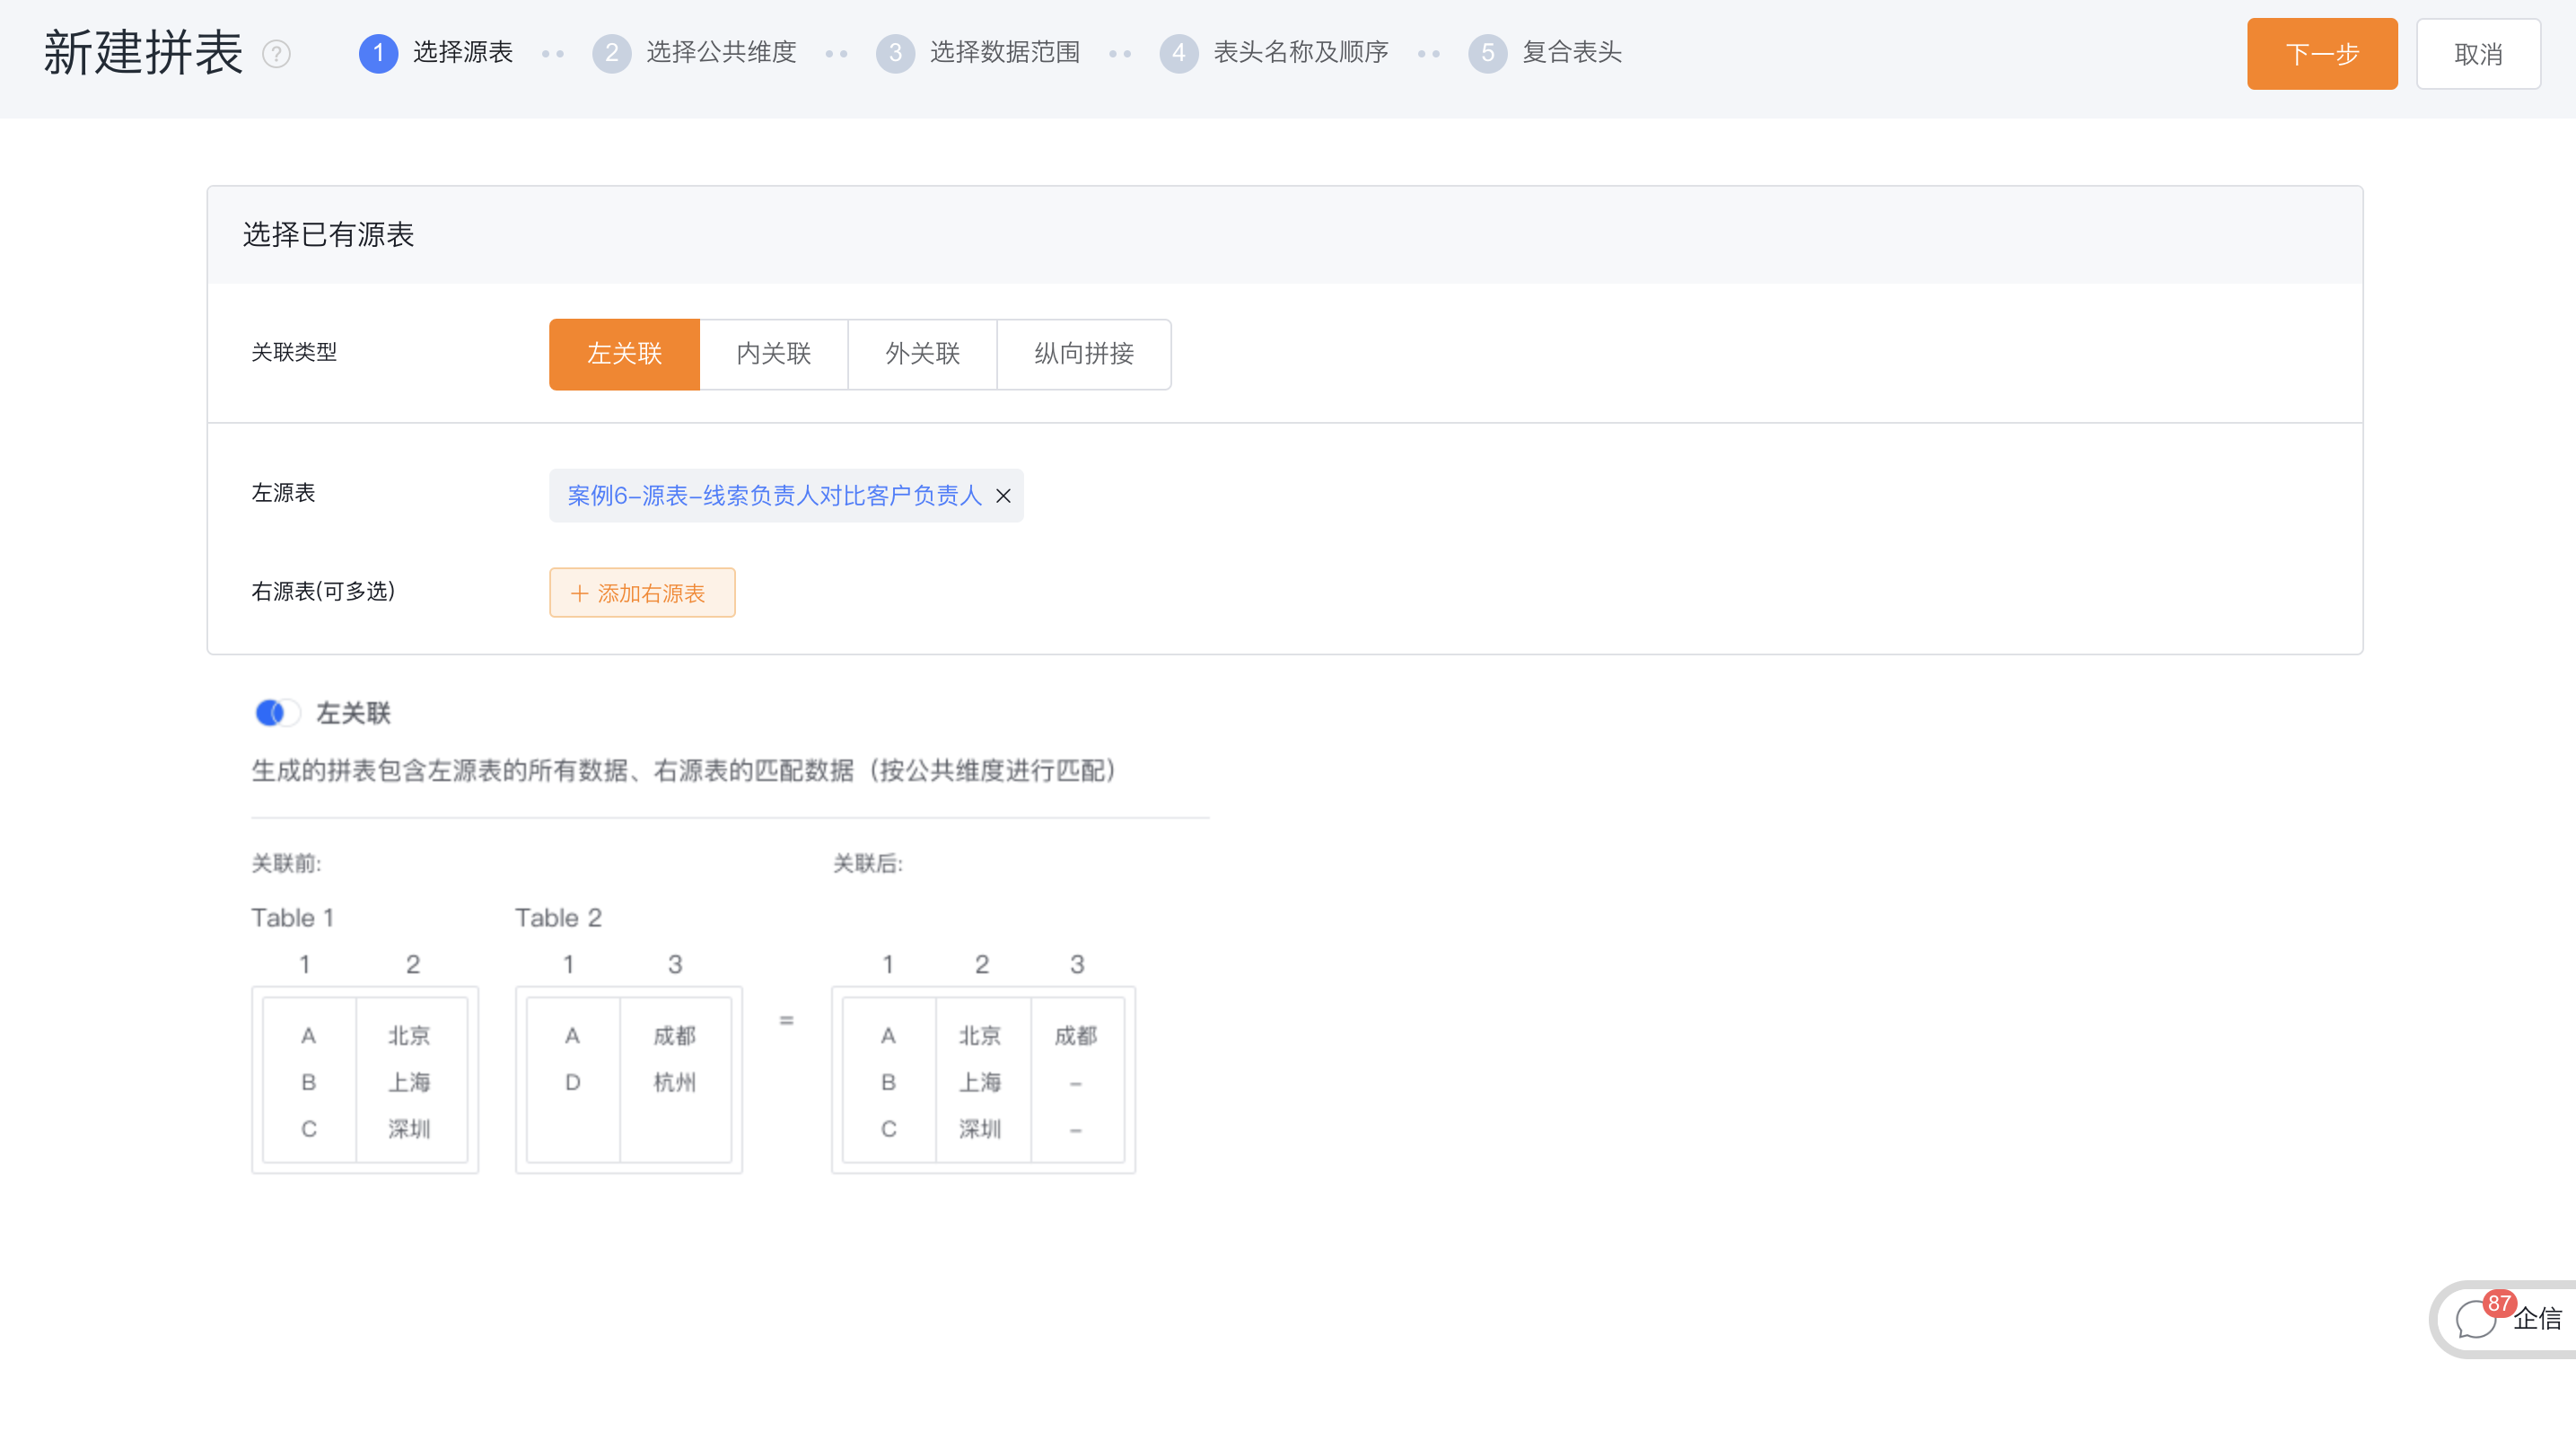
- Source table: the basic table configured based on BI reports and statistical charts, as the source of the combined table;
- Association type: the splicing method of each source table when splicing tables
- 1 Left association: left join, subject to the left source table;
- 2 Inner association: inner join, take intersection;
- 3 Outer association: outer join, take union;
- 4 Vertical splicing: Merge of all data rows;
- Case description: When there is only one source table, there is no need to specifically select the association type, just use the default left association.
4.1.1.2 Select public dimension
- Common dimension: As the basis for splicing multiple source tables, generally the grouping/dimension fields with the same meaning in each source table click on the fields with the same meaning in each source table and add them to the right to form a set of common dimensions, which will be used as the splicing table Grouping/dimension fields, displayed by renamed field names.
- Case description: When the association type is vertical splicing, there is no need to specify a common dimension and go directly to the next step.

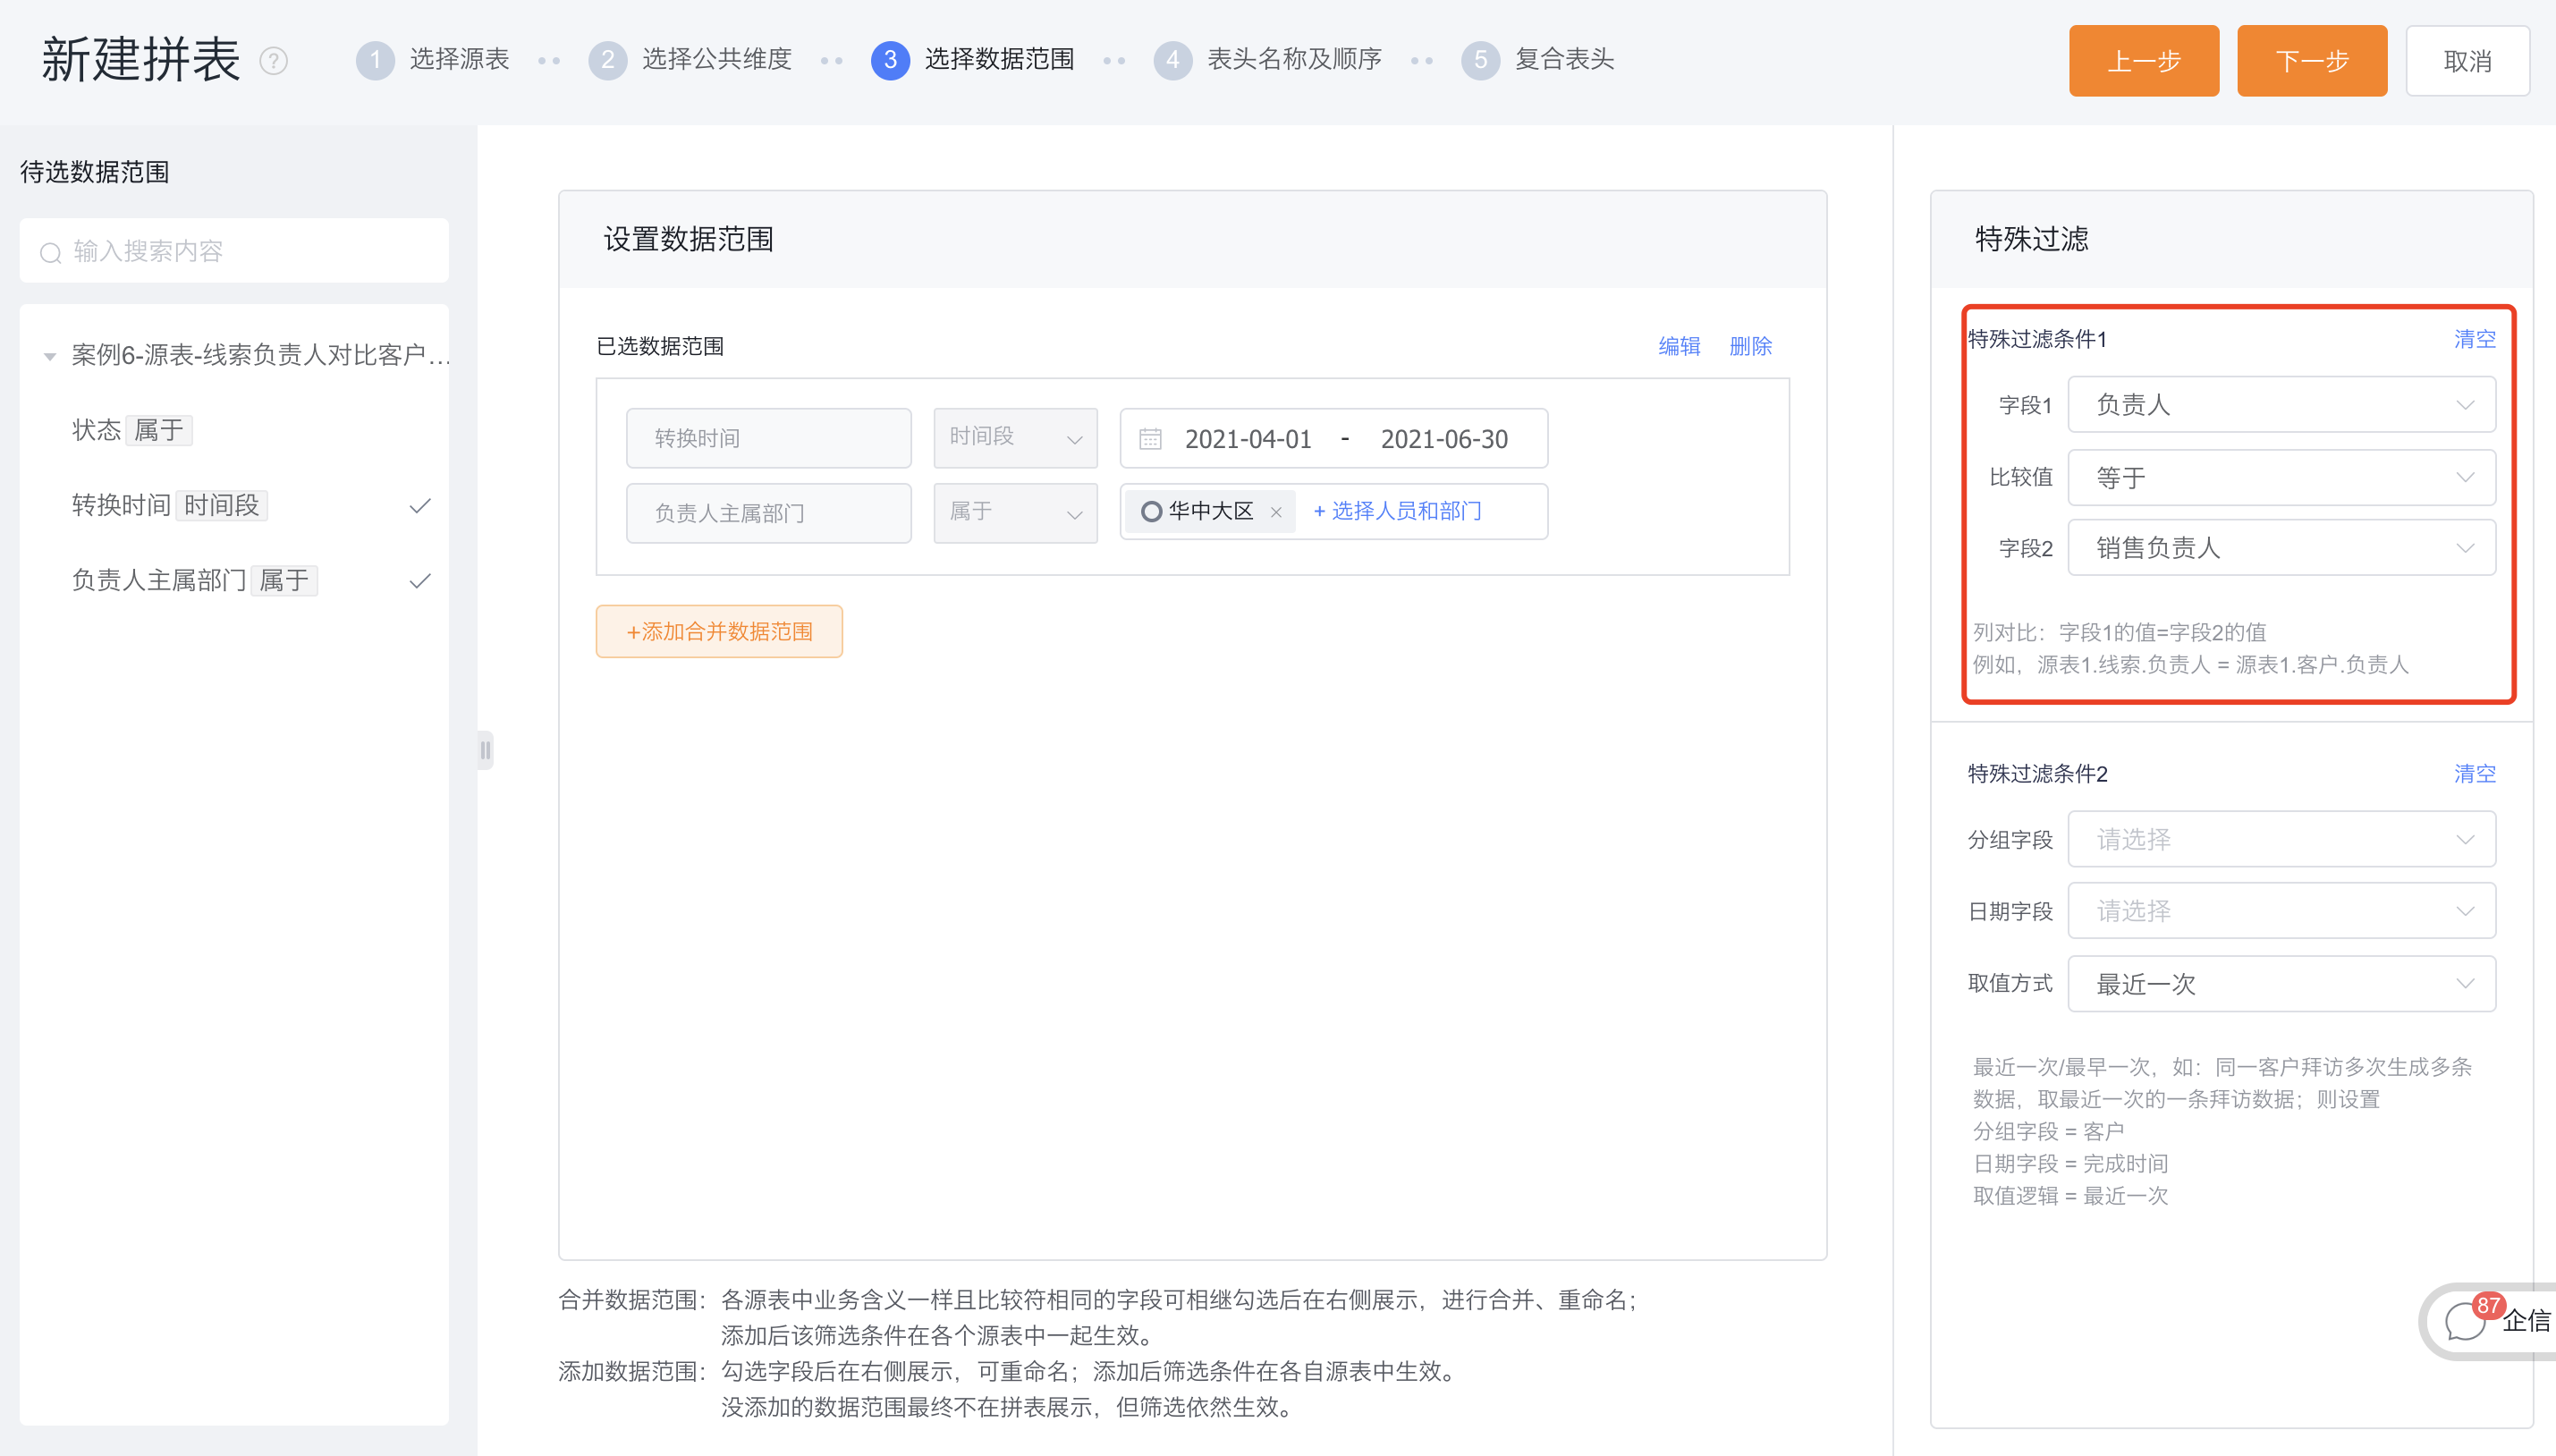
4.1.1.3 Select data range
- Add merged data range: the common data range of each source table is similar to the common dimension, click on the left to add to the right as a group. Clicking "Merge" means that it will eventually be merged into one filter condition to be used in the data range of the stitching table, and displayed according to the renamed field name. The default values for the filter can also be modified here.
- Add data range: In addition to the public data range, other filter conditions, which need to be exposed in the data range after the table is assembled. Filter conditions that have not been added will not be displayed in the data range of the combined table, and will work according to the default configuration of the source table.
- Special filter condition 1: Specify two fields to be compared, specify the comparison method: equal to, not equal to, and the data that does not meet the conditions will be filtered out.
- Case description: Add the conversion time and the department of the person in charge as the data range, and the unadded fields will be filtered by the condition value configured in the source table by default;
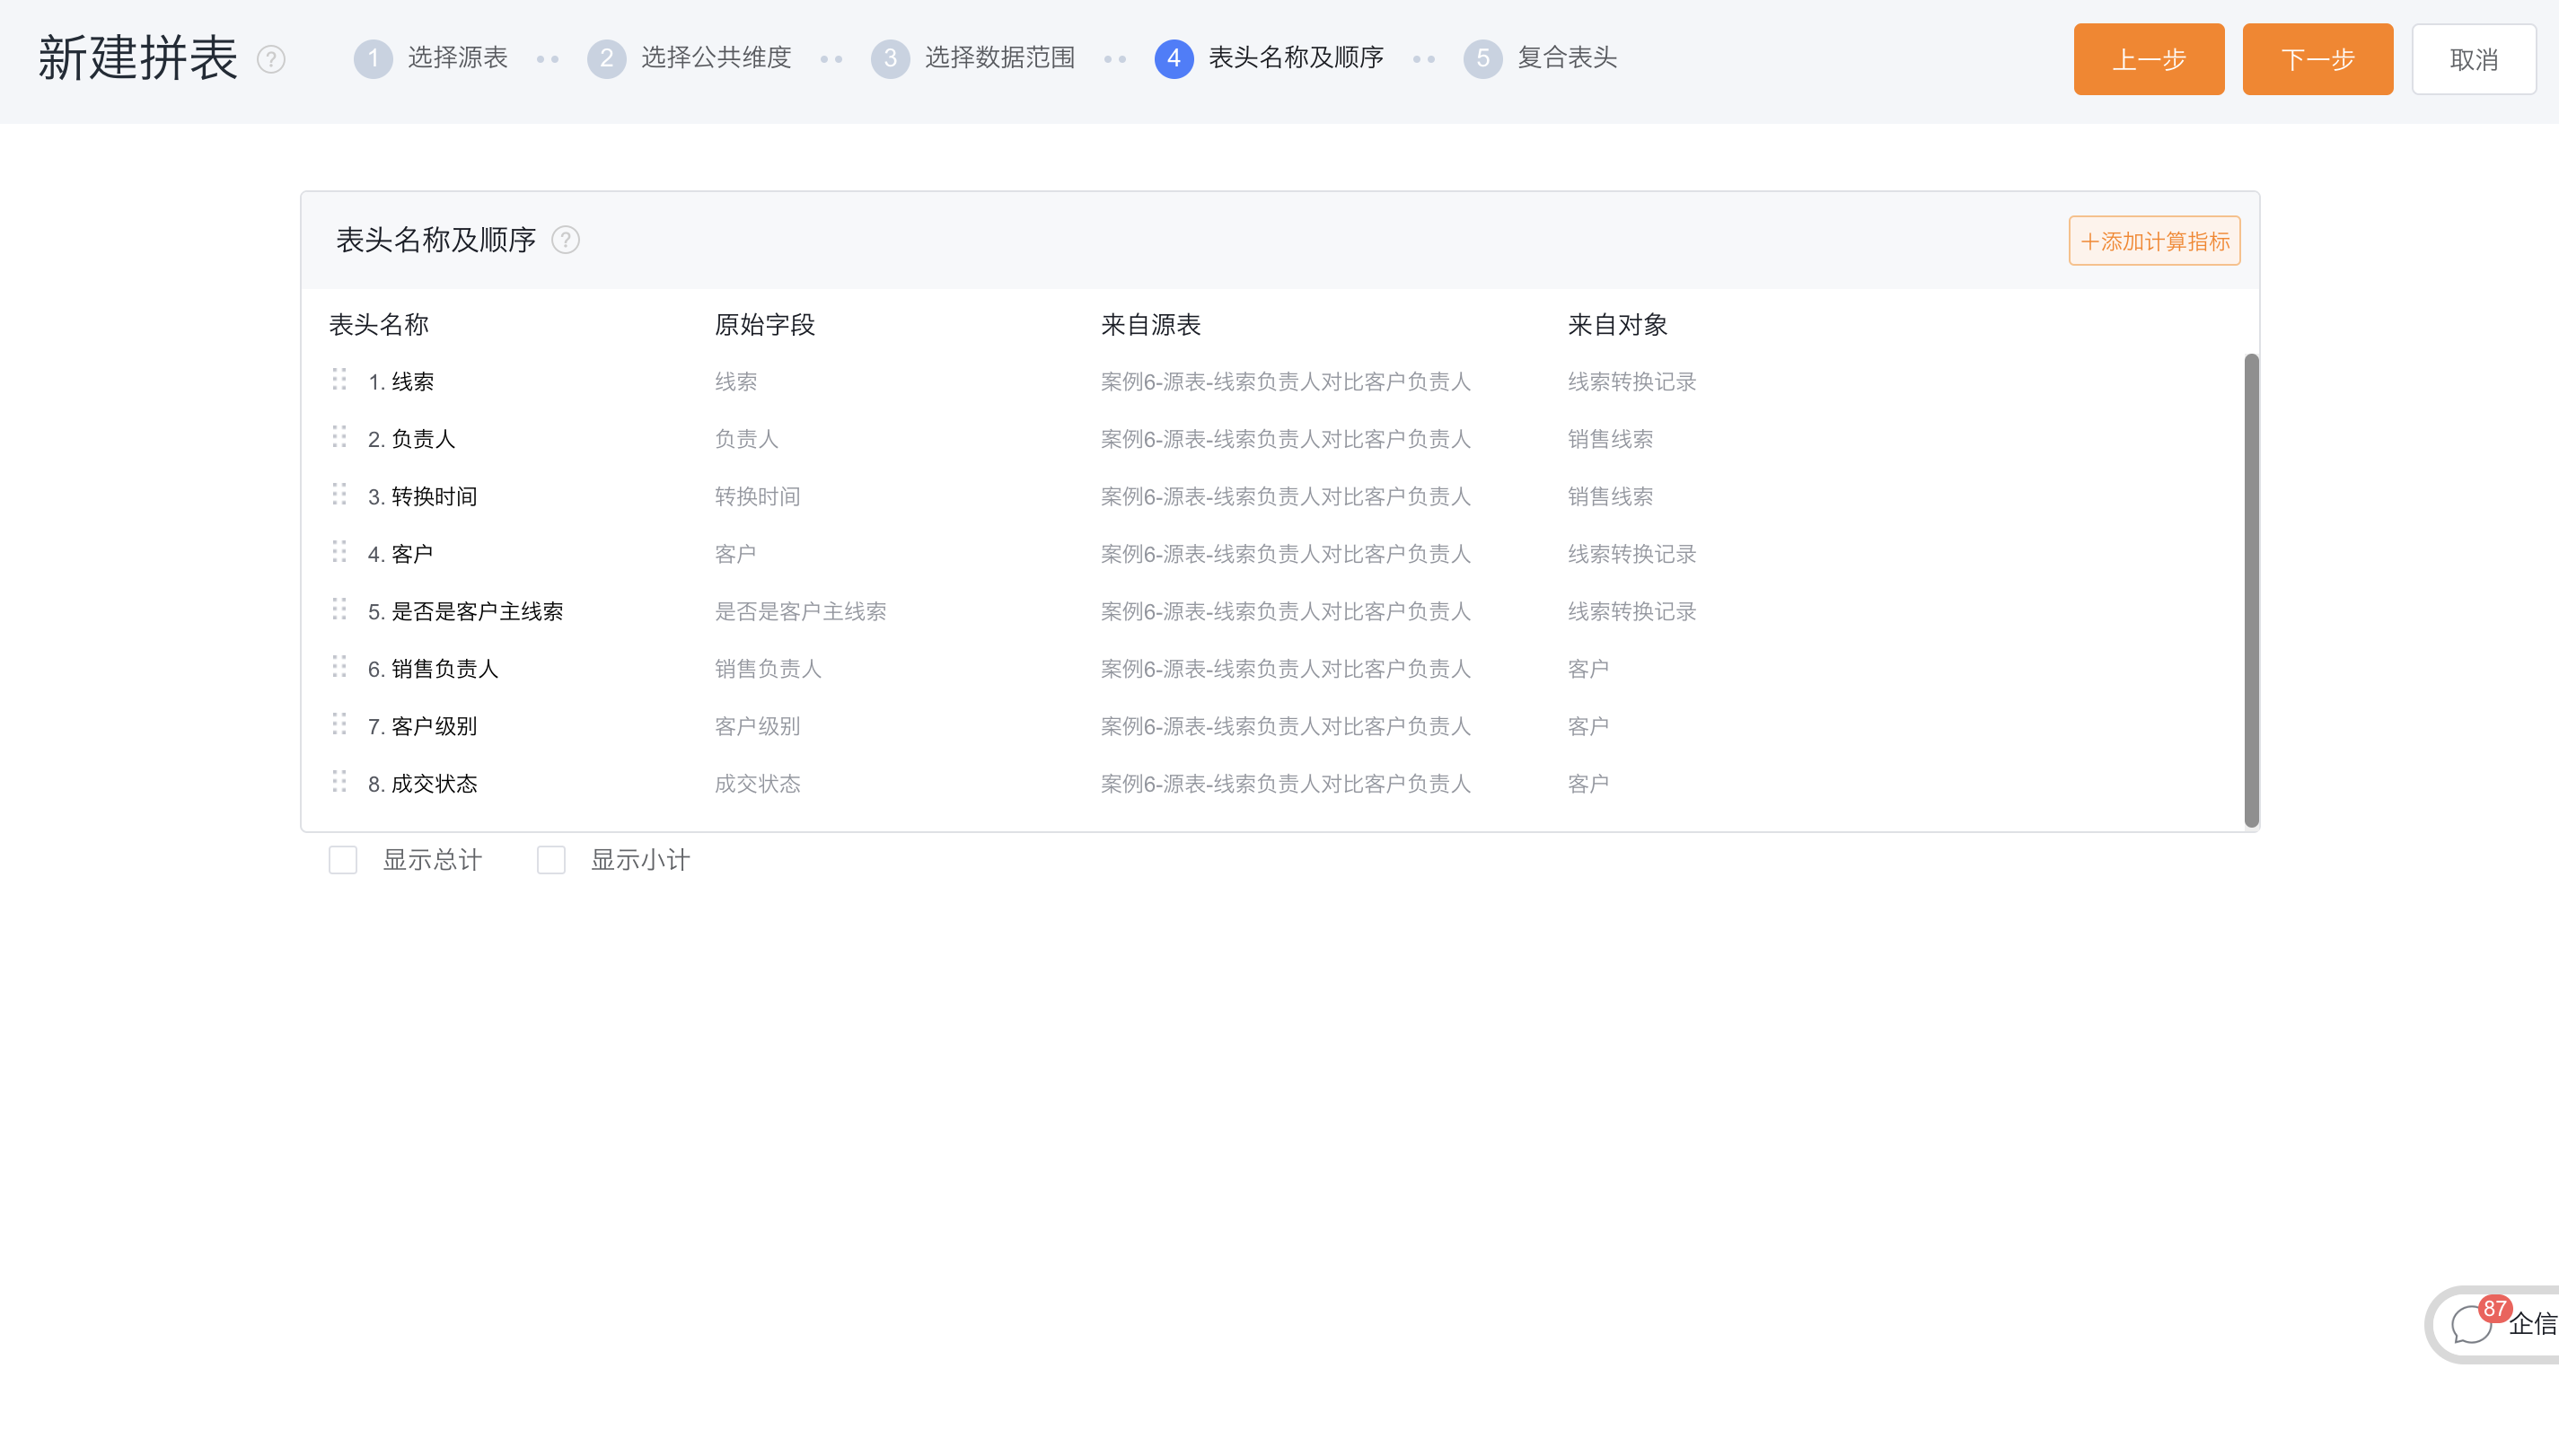
4.1.1.4 Header name and sequence
- Header name: The field name of the public dimension is displayed according to the setting in the second step, which cannot be modified here, and other field names can be modified as required.
- Adjust the order: Drag and drop to adjust the order of the columns, where the common dimension must be at the front and cannot be adjusted.
- Add and hide columns: You can add calculated indicators as new columns; you can hide columns that don't need to be displayed in the spelling table.
- Case Description: This case does not need to add a composite header, just save it directly.
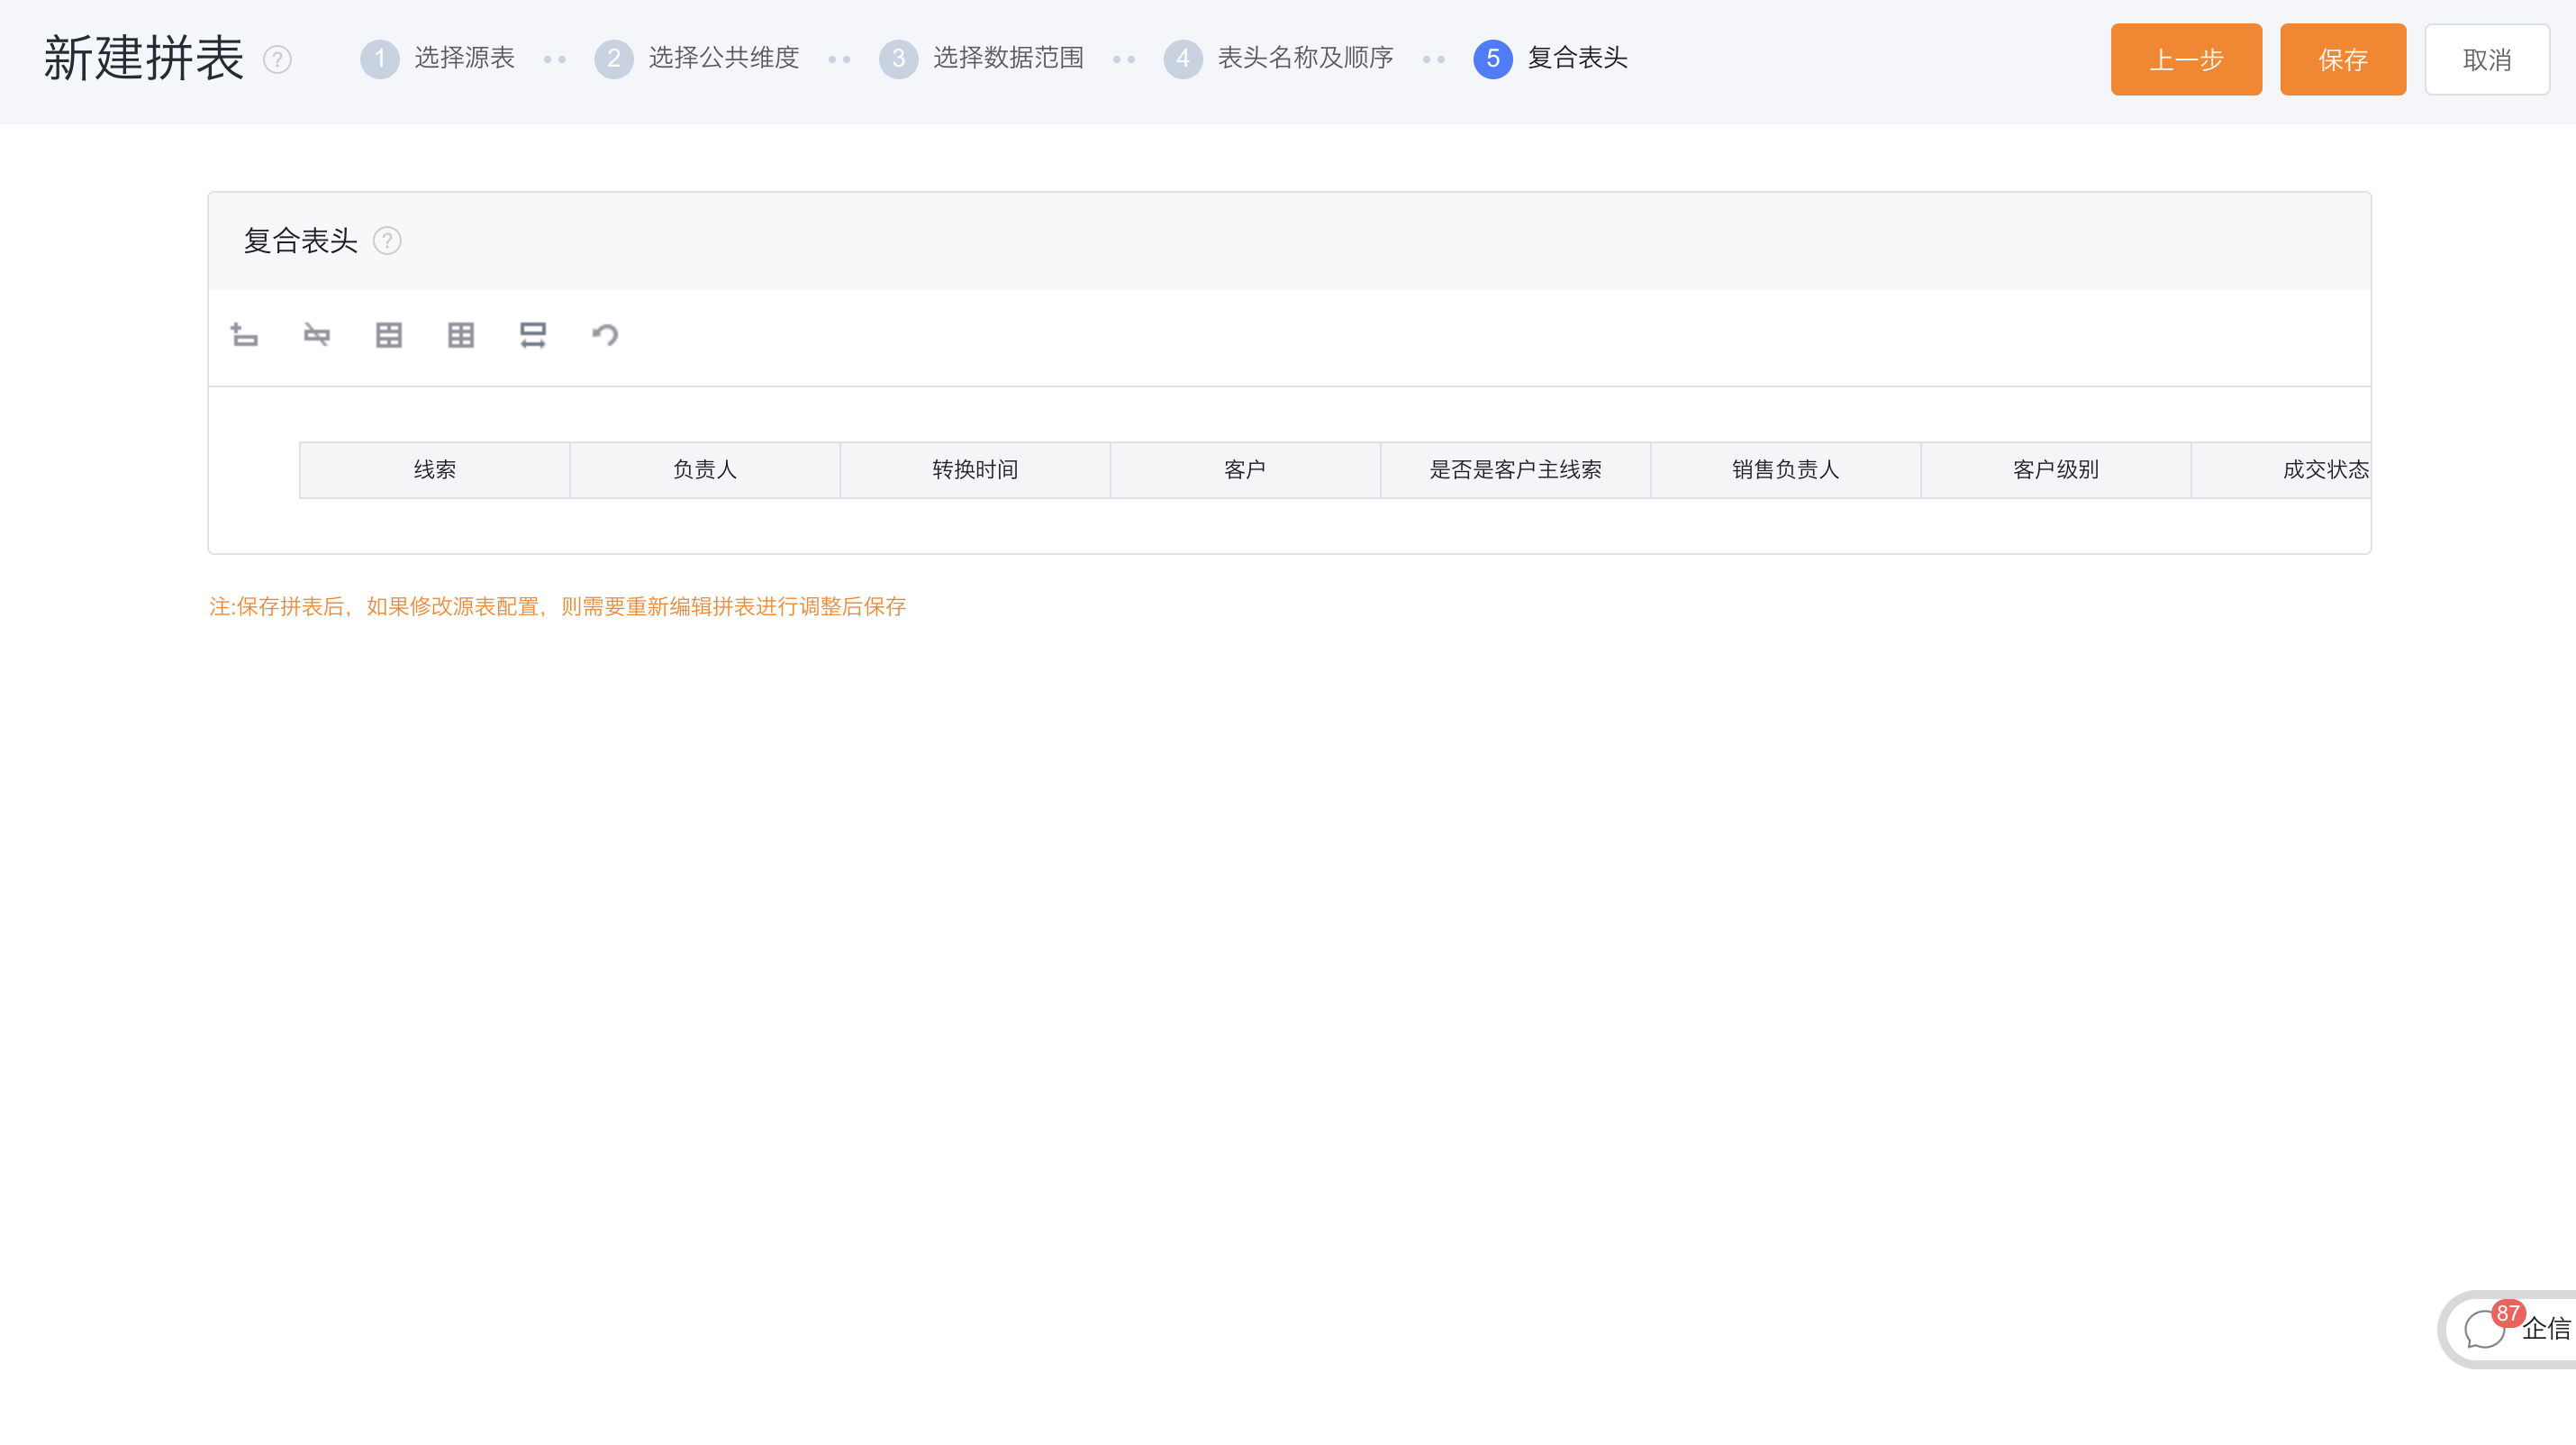
4.1.1.5 Composite header
-
Composite header: Display the title and order of the headers adjusted in the previous step, and add multiple layers of composite headers to the top.
-
operate:
Add row: add a new row above; Delete row: delete the selected row; Merge cells: Merge multiple cells in the mouse circle; Split cell: split the merged cell back to the original cell; Compact mode: compact mode can be set; Back: Go back to the previous step; Modify column width: Click the original header to modify the column width; Modify the display name: Click the added grid to modify the display name; -
Case Description: This case does not need to add a composite header, just save it directly.
4.1.2 Table spelling results
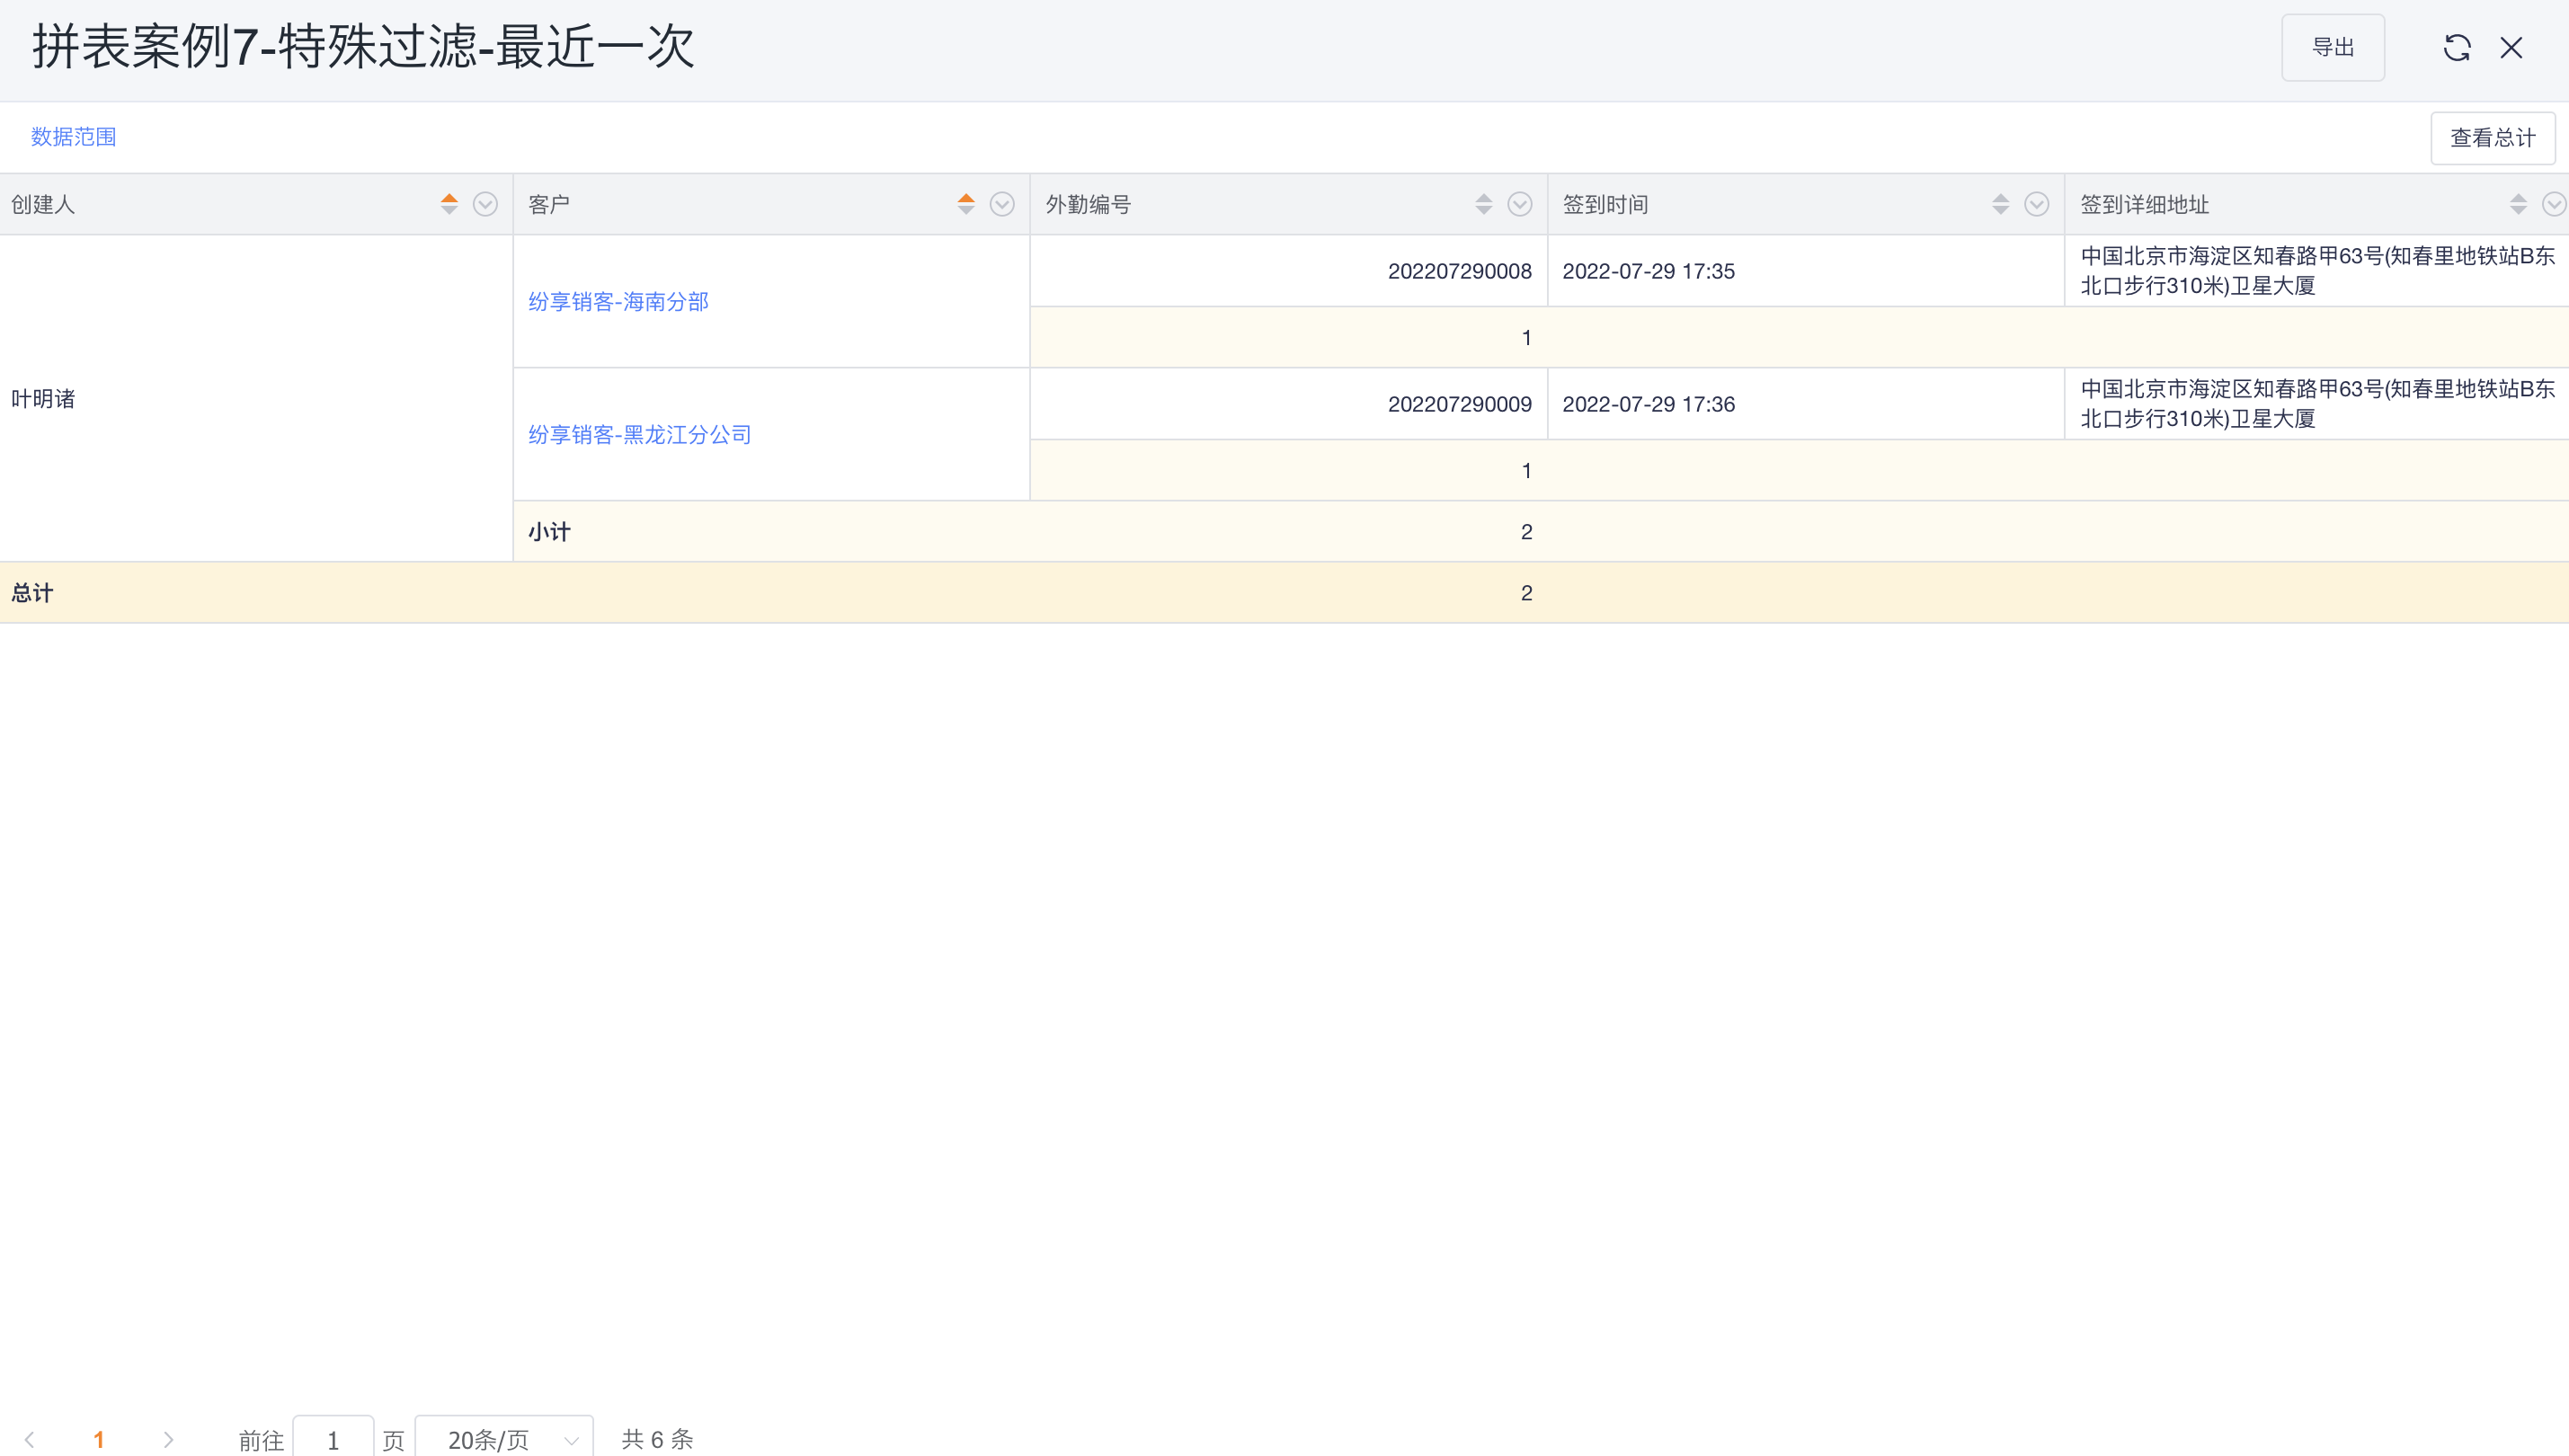
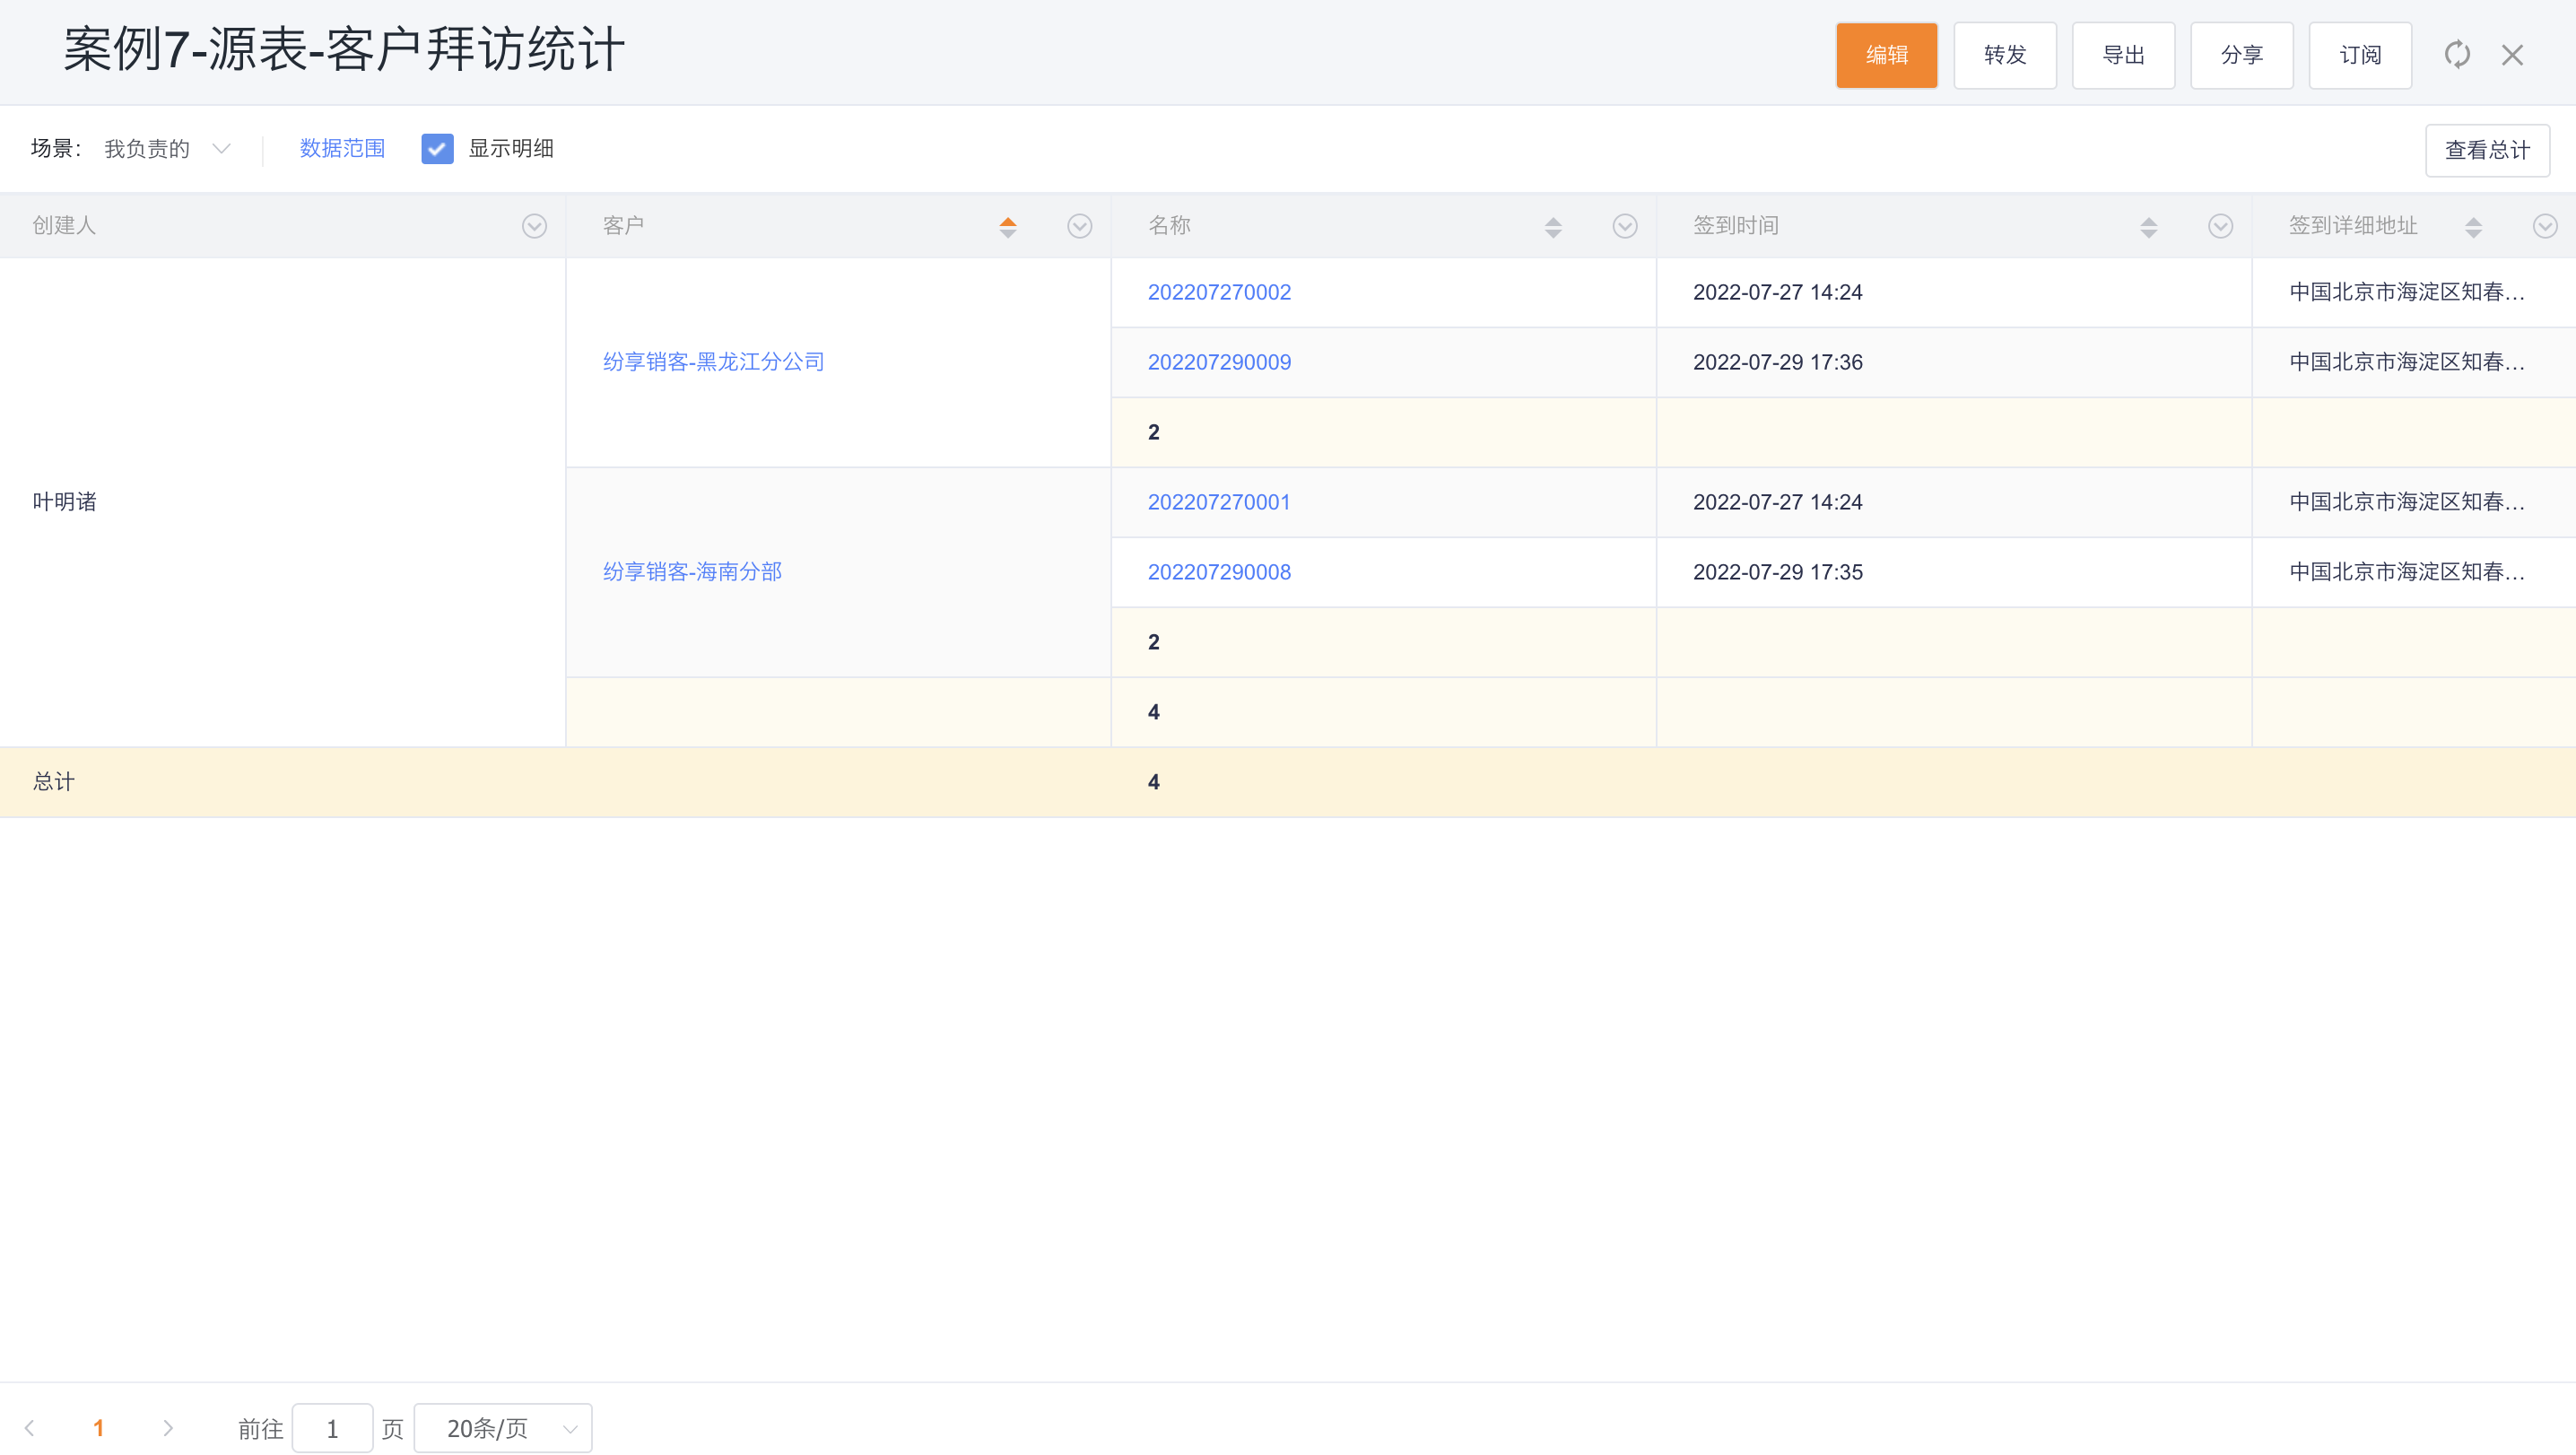
4.2 Case 7: Special filtering - the last time
- Core appeal: There is another special filter, which only keeps one piece of data for multiple pieces of data in the same group. For example, when visiting a store, a store will be visited multiple times, and the table-splitting platform can be used to keep the latest visit to each store within the selected time period as needed.
- Source table configuration:
4.2.1 Configuration process
4.2.1.1 Select source table and association type
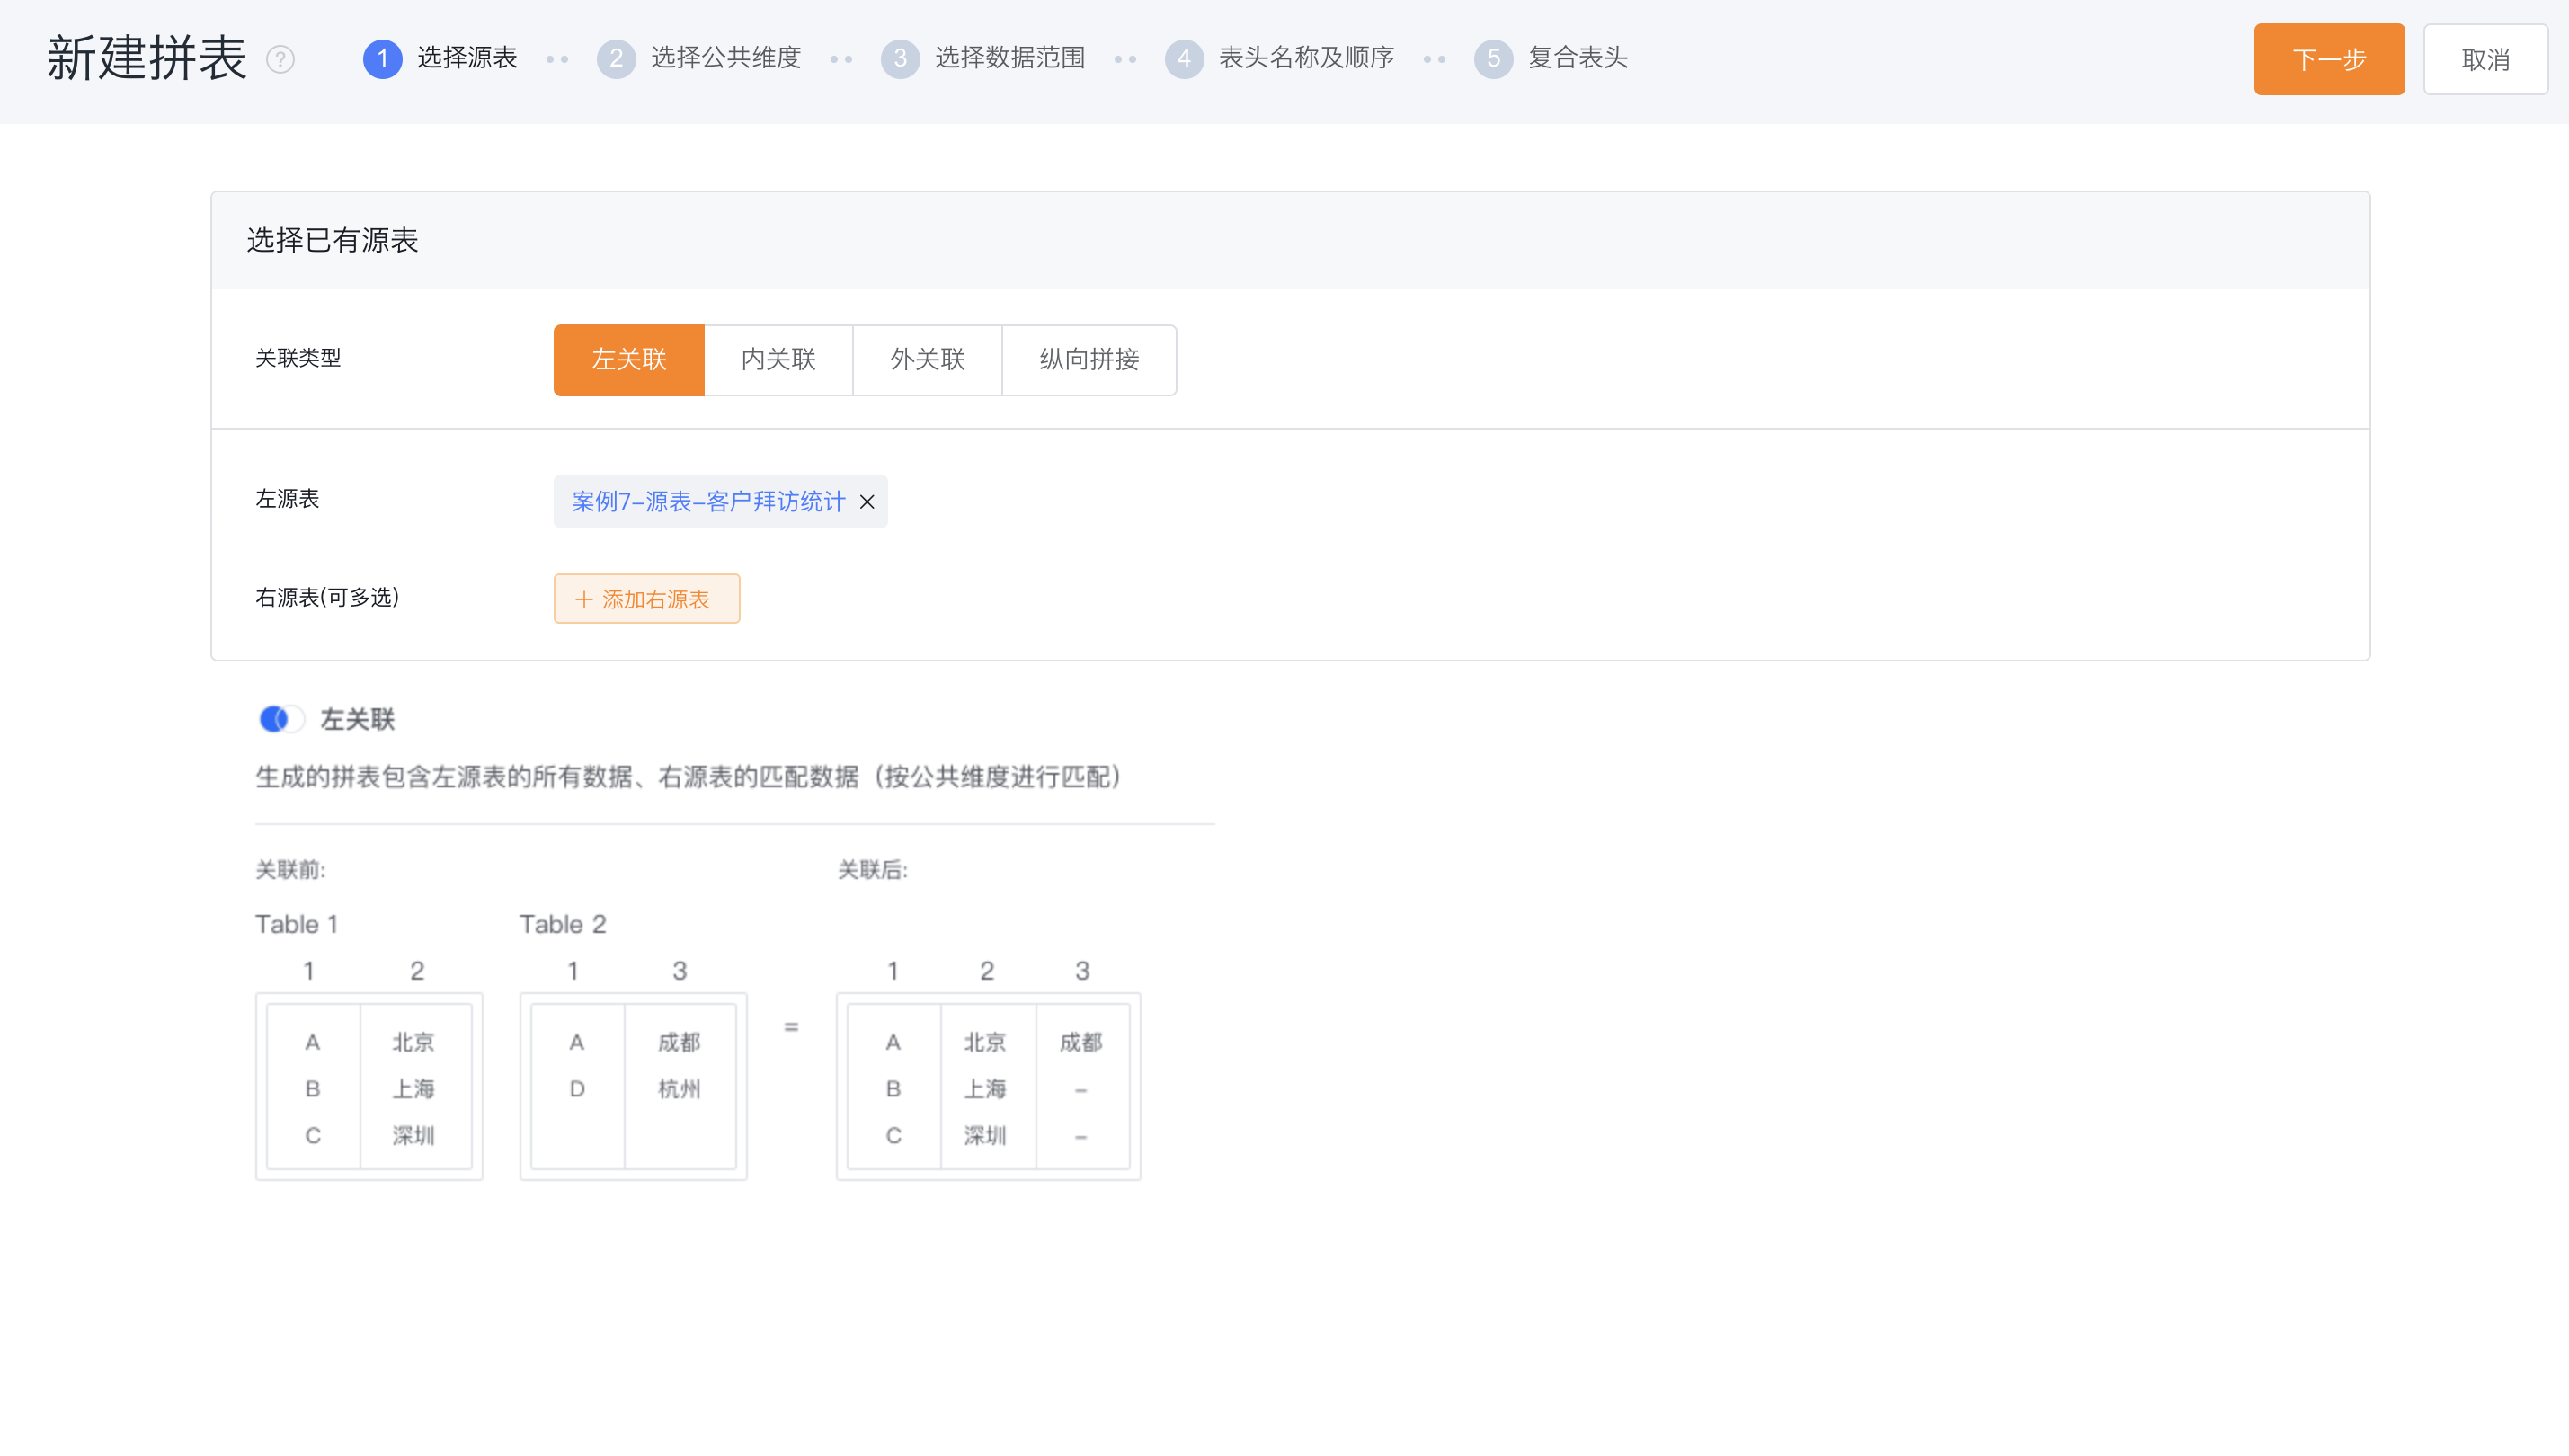
- Source table: the basic table configured based on BI reports and statistical charts, as the source of the combined table;
- Association type: the splicing method of each source table when splicing tables
- 1 Left association: left join, subject to the left source table;
- 2 Inner association: inner join, take intersection;
- 3 Outer association: outer join, take union;
- 4 Vertical splicing: Merge of all data rows;
- Case description: When there is only one source table, there is no need to specifically select the association type, just use the default left association.
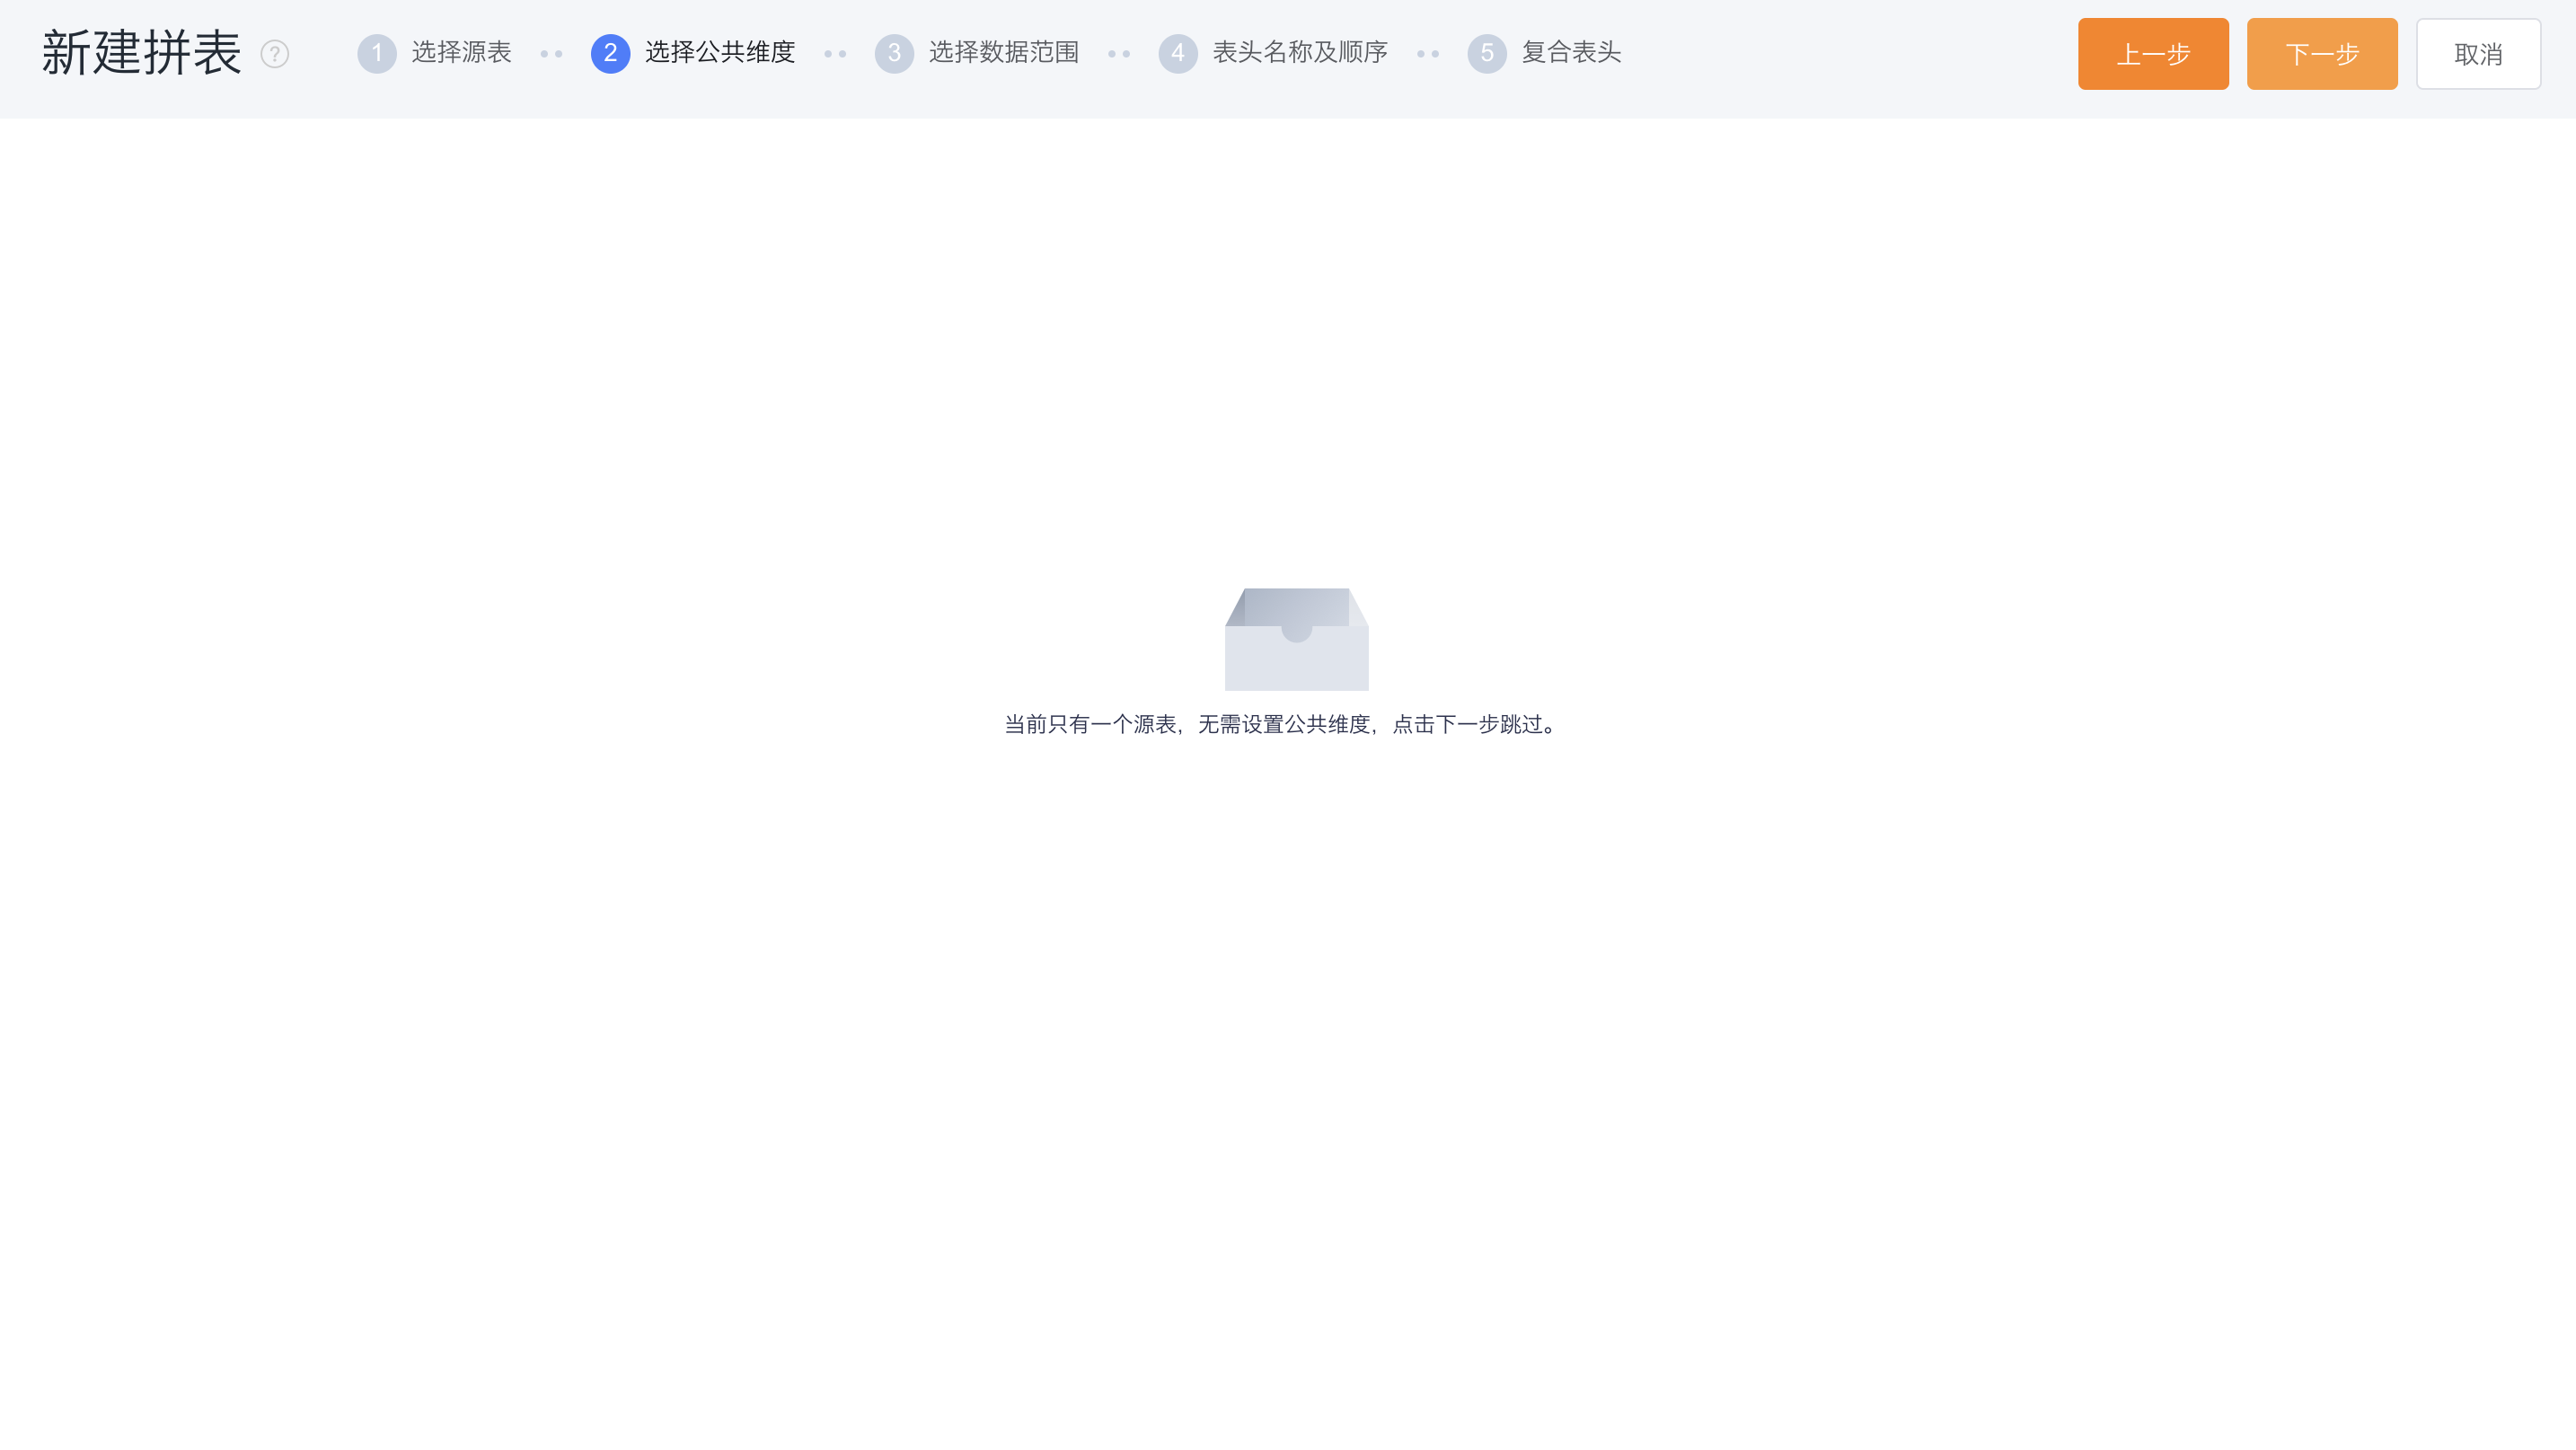
4.2.1.2 Select public dimension
- Common dimension: As the basis for splicing multiple source tables, generally the grouping/dimension fields with the same meaning in each source table click on the fields with the same meaning in each source table and add them to the right to form a set of common dimensions, which will be used as the splicing table Grouping/dimension fields, displayed by renamed field names.
- Case description: When the association type is left association, there is no need to specify a common dimension and go directly to the next step.
4.2.1.3 Select data range
-
Add merged data range: the common data range of each source table is similar to the common dimension, click on the left to add to the right as a group. Clicking "Merge" means that it will eventually be merged into one filter condition to be used in the data range of the stitching table, and displayed according to the renamed field name. The default values for the filter can also be modified here.
-
Add data range: In addition to the public data range, other filter conditions, which need to be exposed in the data range after the table is assembled. Filter conditions that have not been added will not be displayed in the data range of the combined table, and will work according to the default configuration of the source table.
-
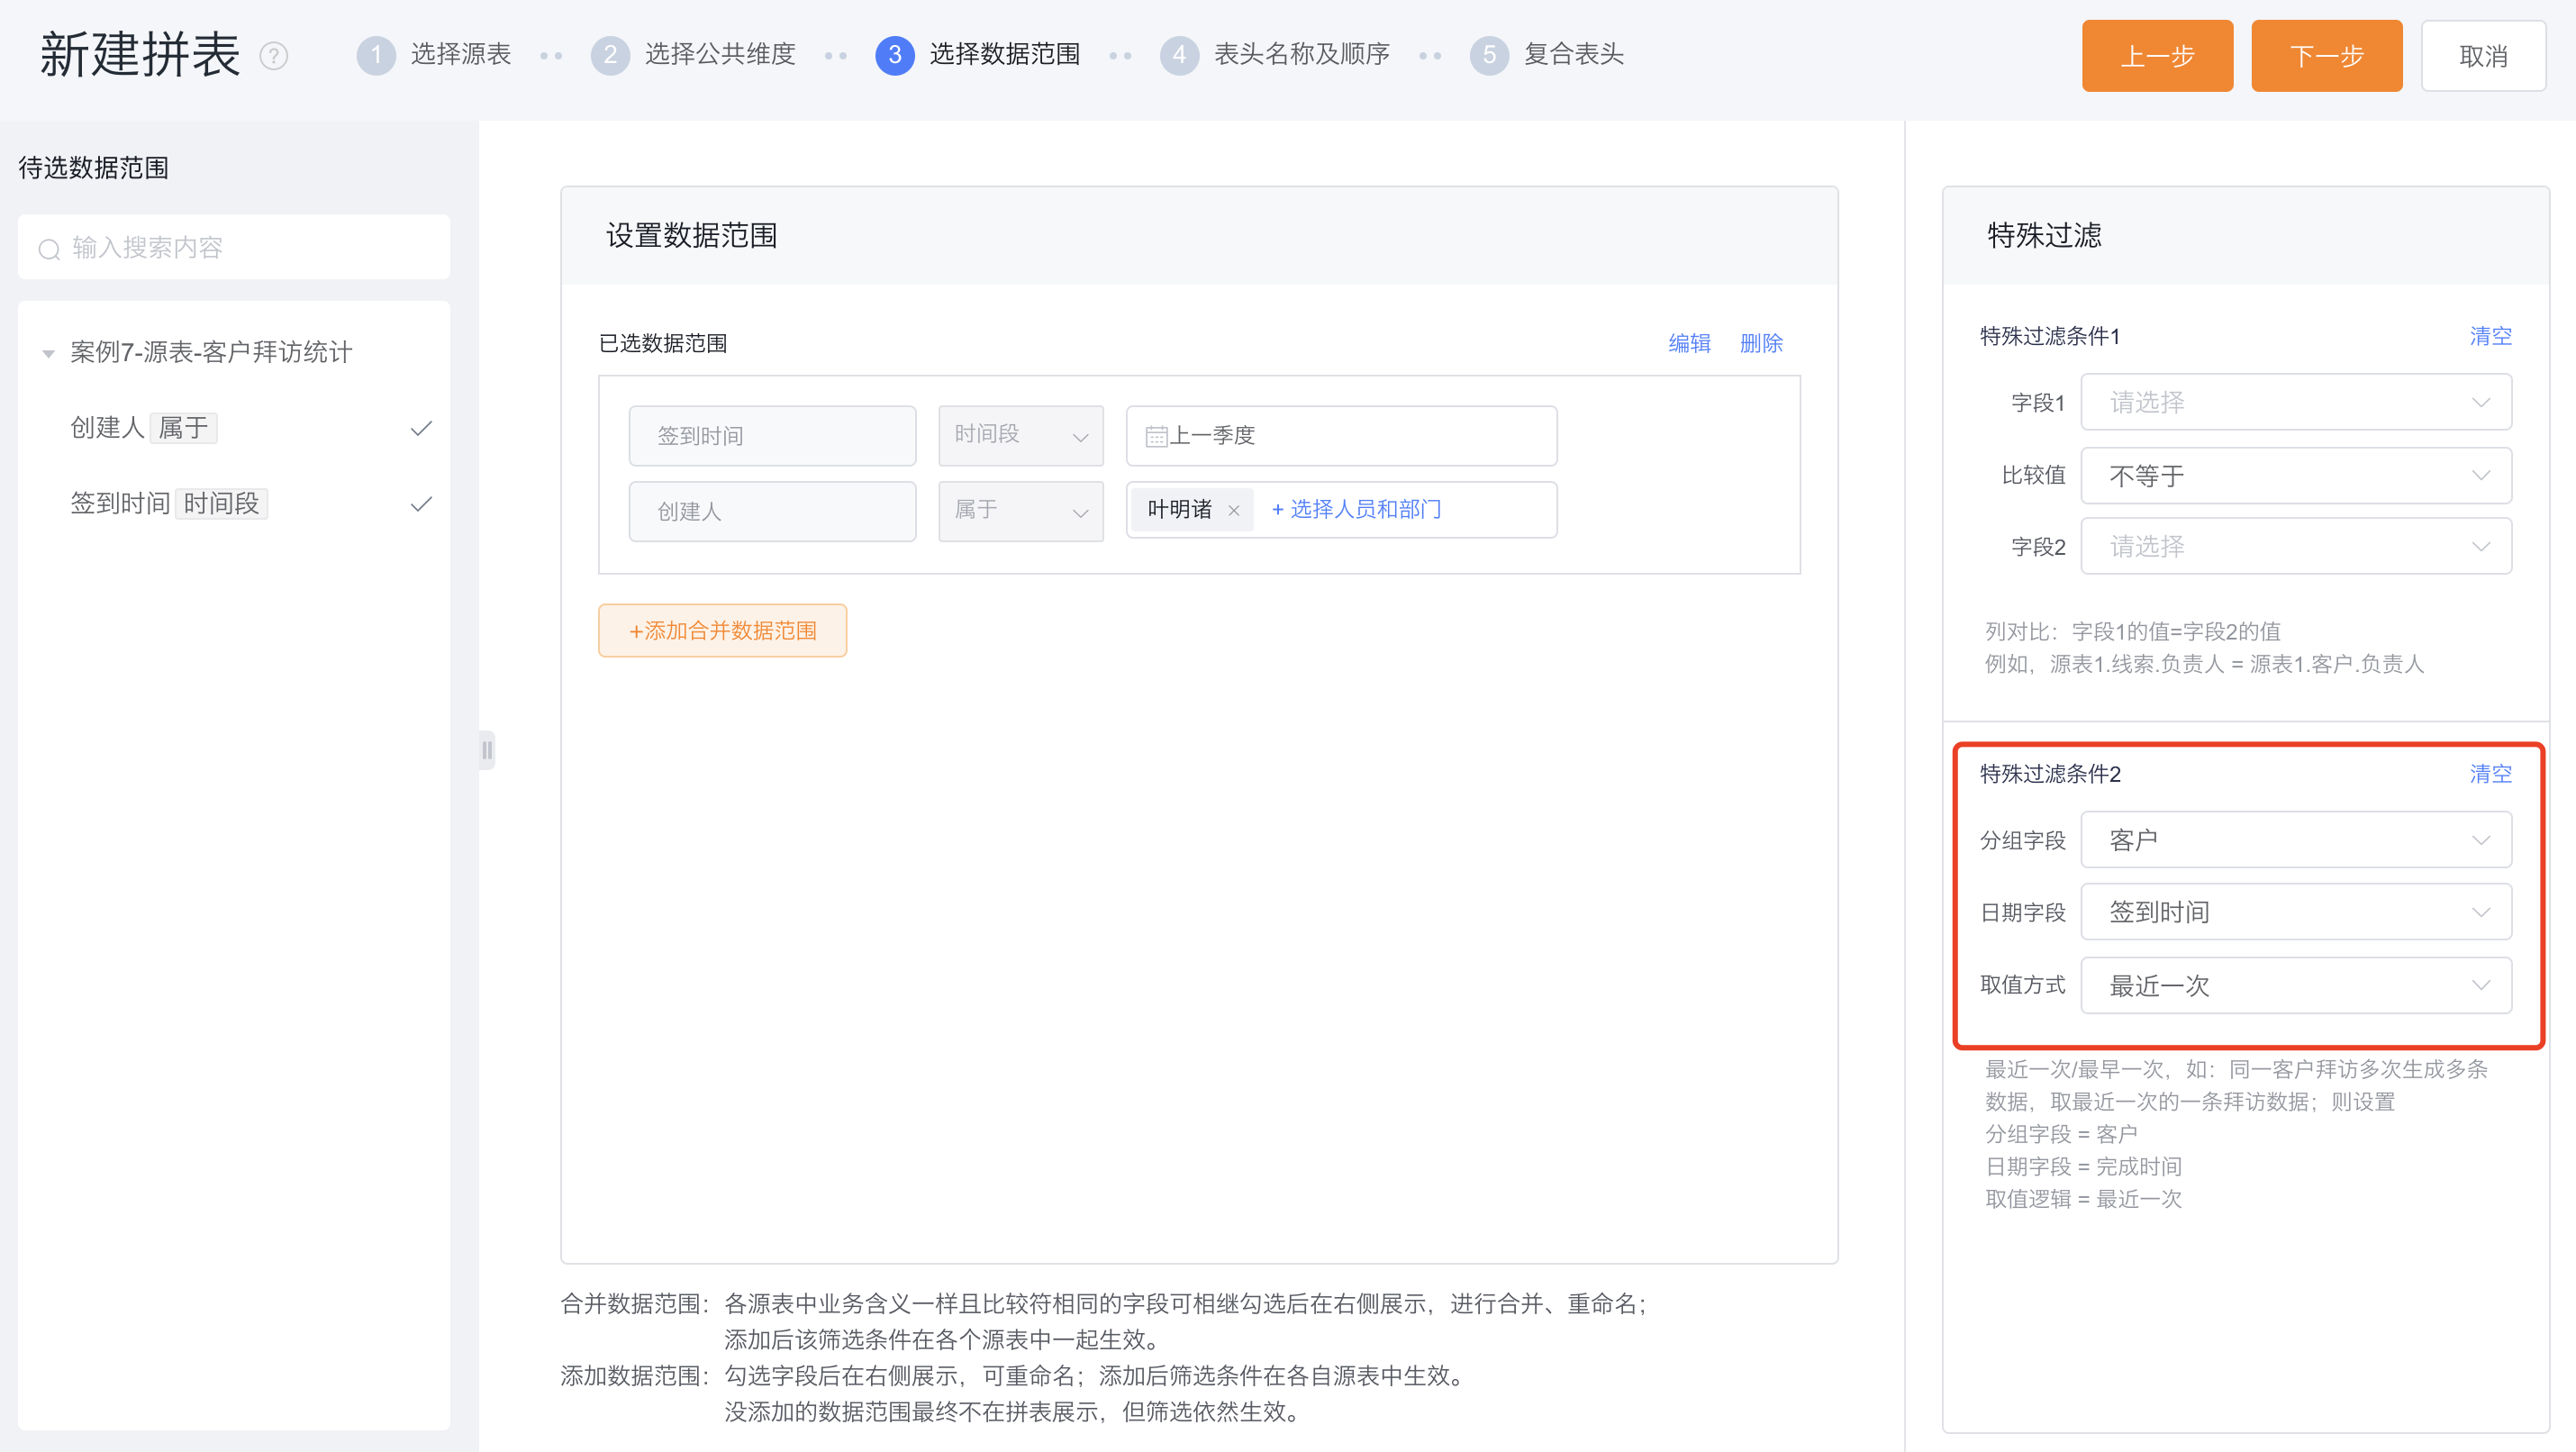
Special filter condition 2: Specify the grouping field, filter the range by date, and filter the earliest/latest piece of data in each group.
-
Case description: For each customer (store), only the latest visit data within this month is kept. Set special filter condition 2:
Group Field: Customer
Date field: check-in time
Value method: last time
4.2.1.4 Header name and sequence
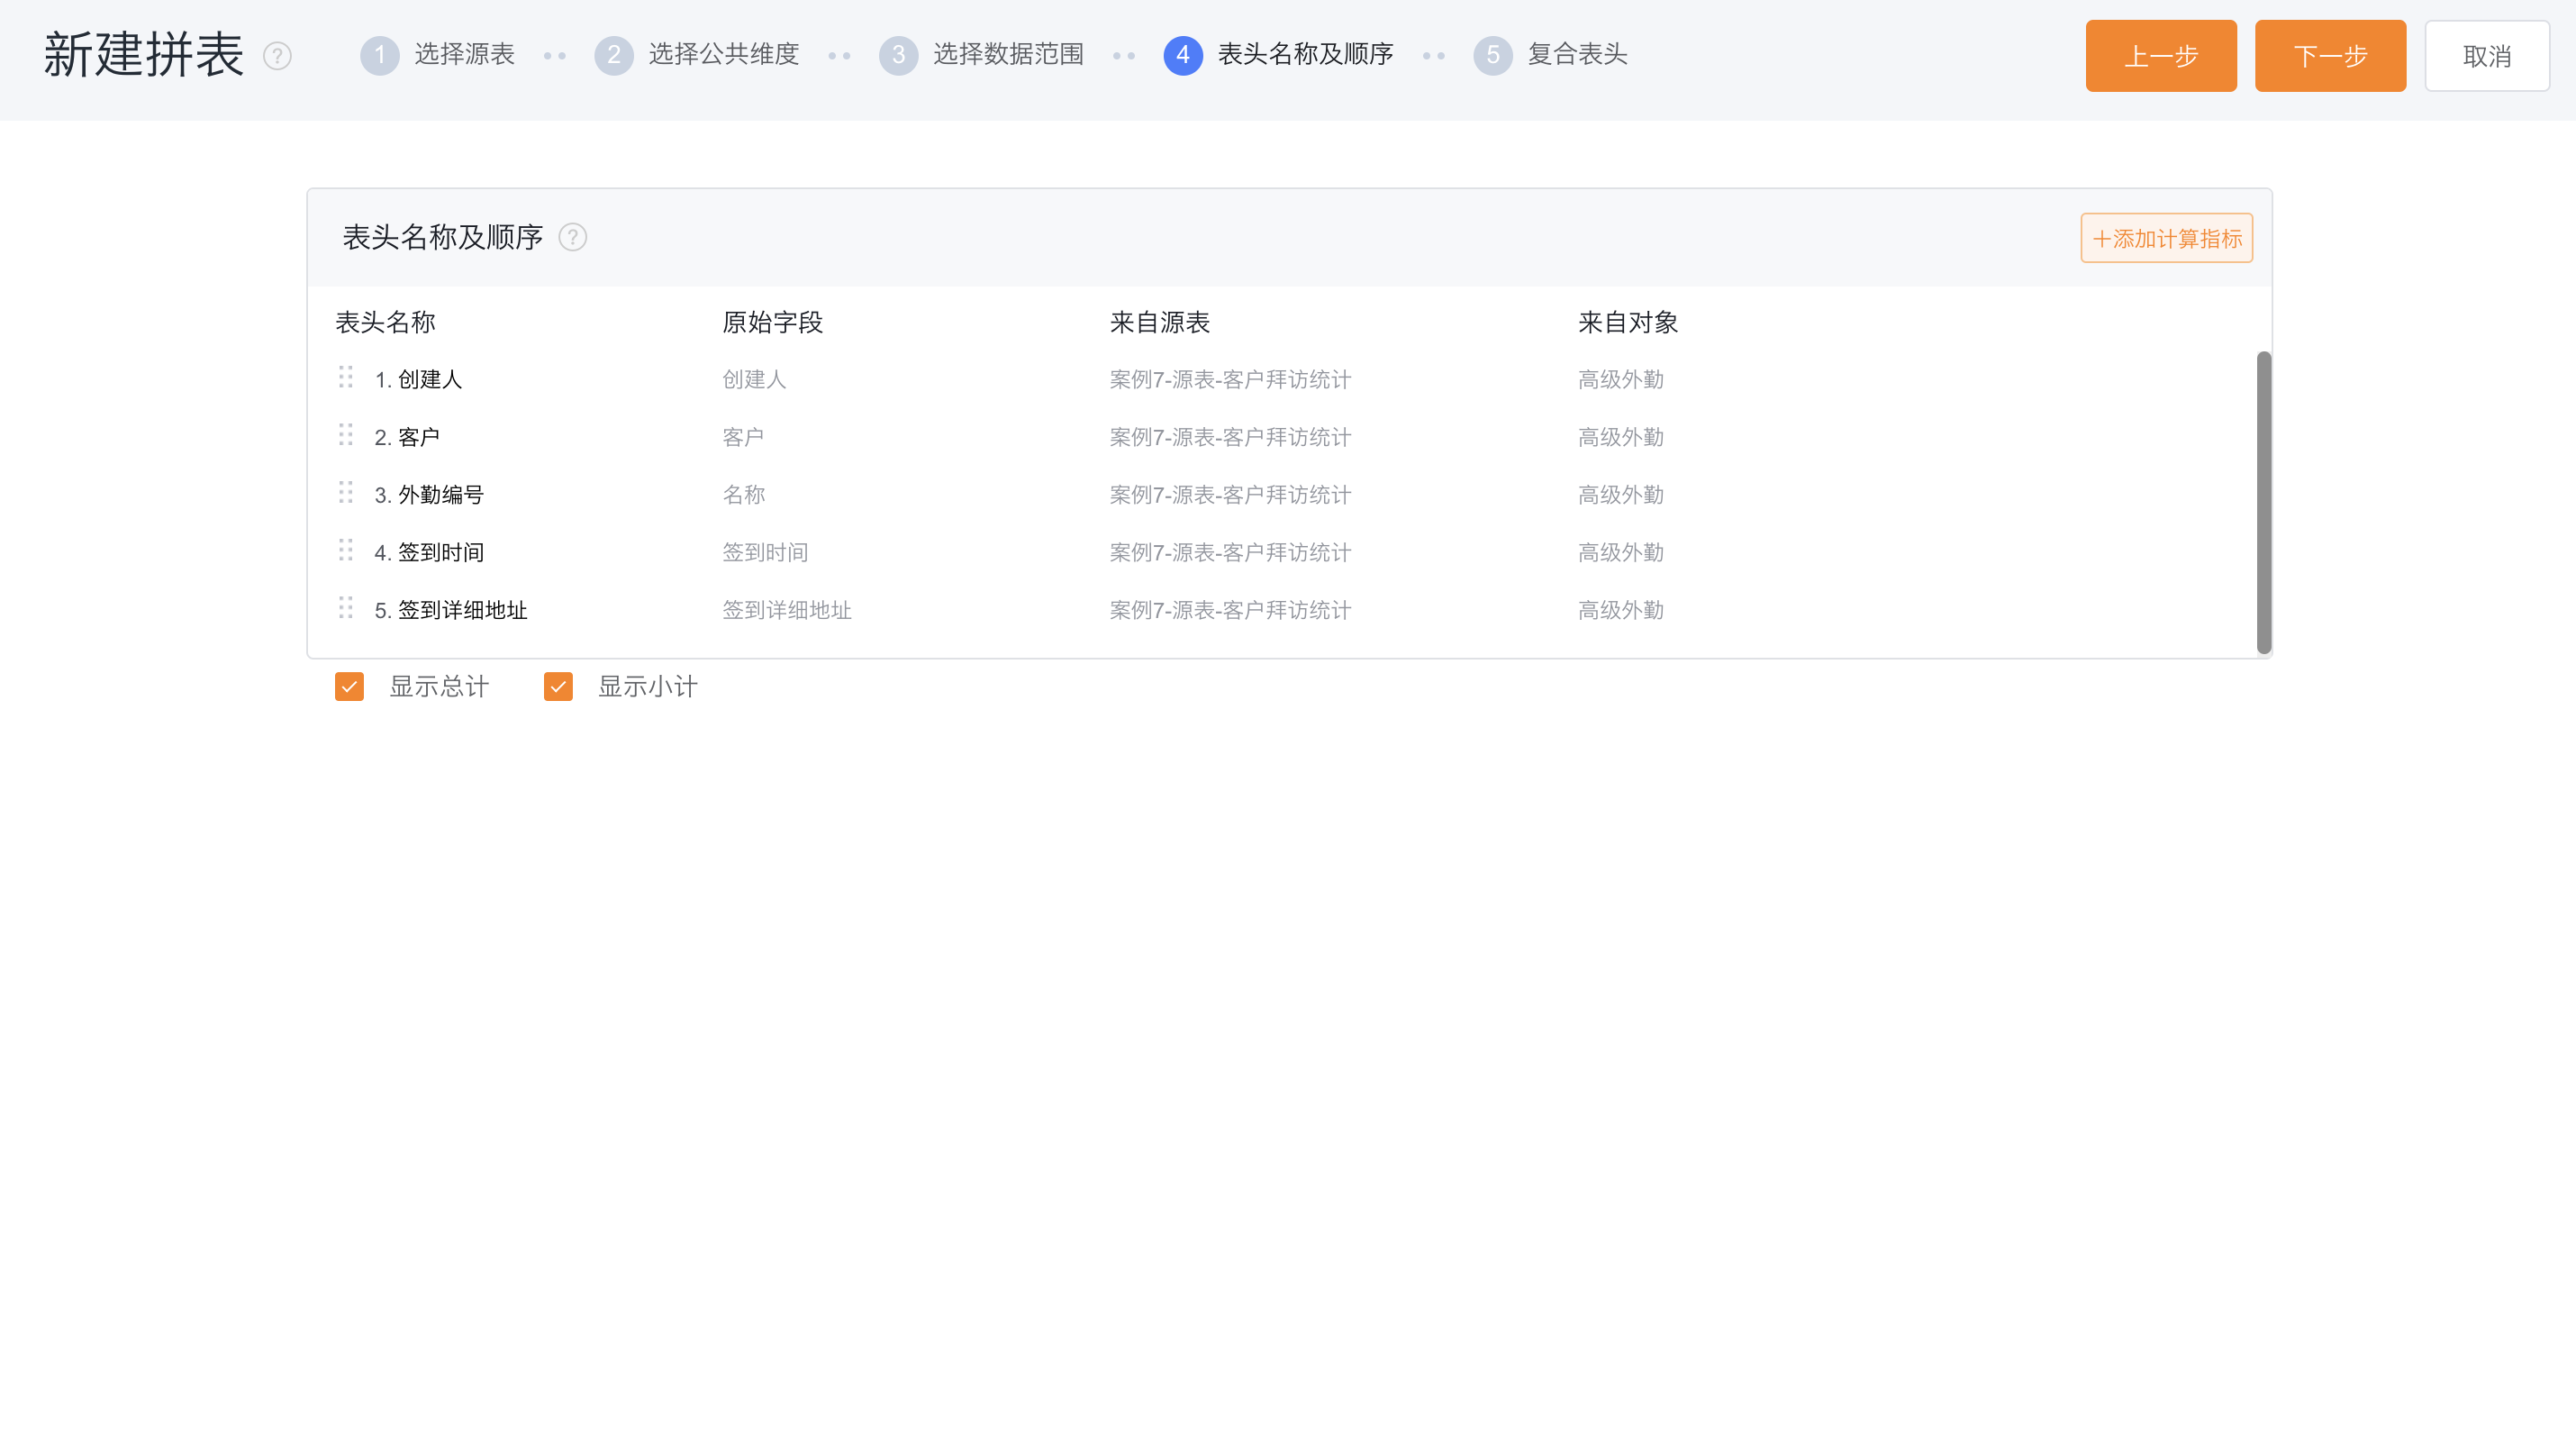
- Header name: The field name of the public dimension is displayed according to the setting in the second step, which cannot be modified here, and other field names can be modified as required.
- Adjust the order: Drag and drop to adjust the order of the columns, where the common dimension must be at the front and cannot be adjusted.
- Add and hide columns: You can add calculated indicators as new columns; you can hide columns that don't need to be displayed in the spelling table.
- Case Description: Change the name of the table header to field number to make the information more intuitive and clear.
4.2.1.5 Composite header
-
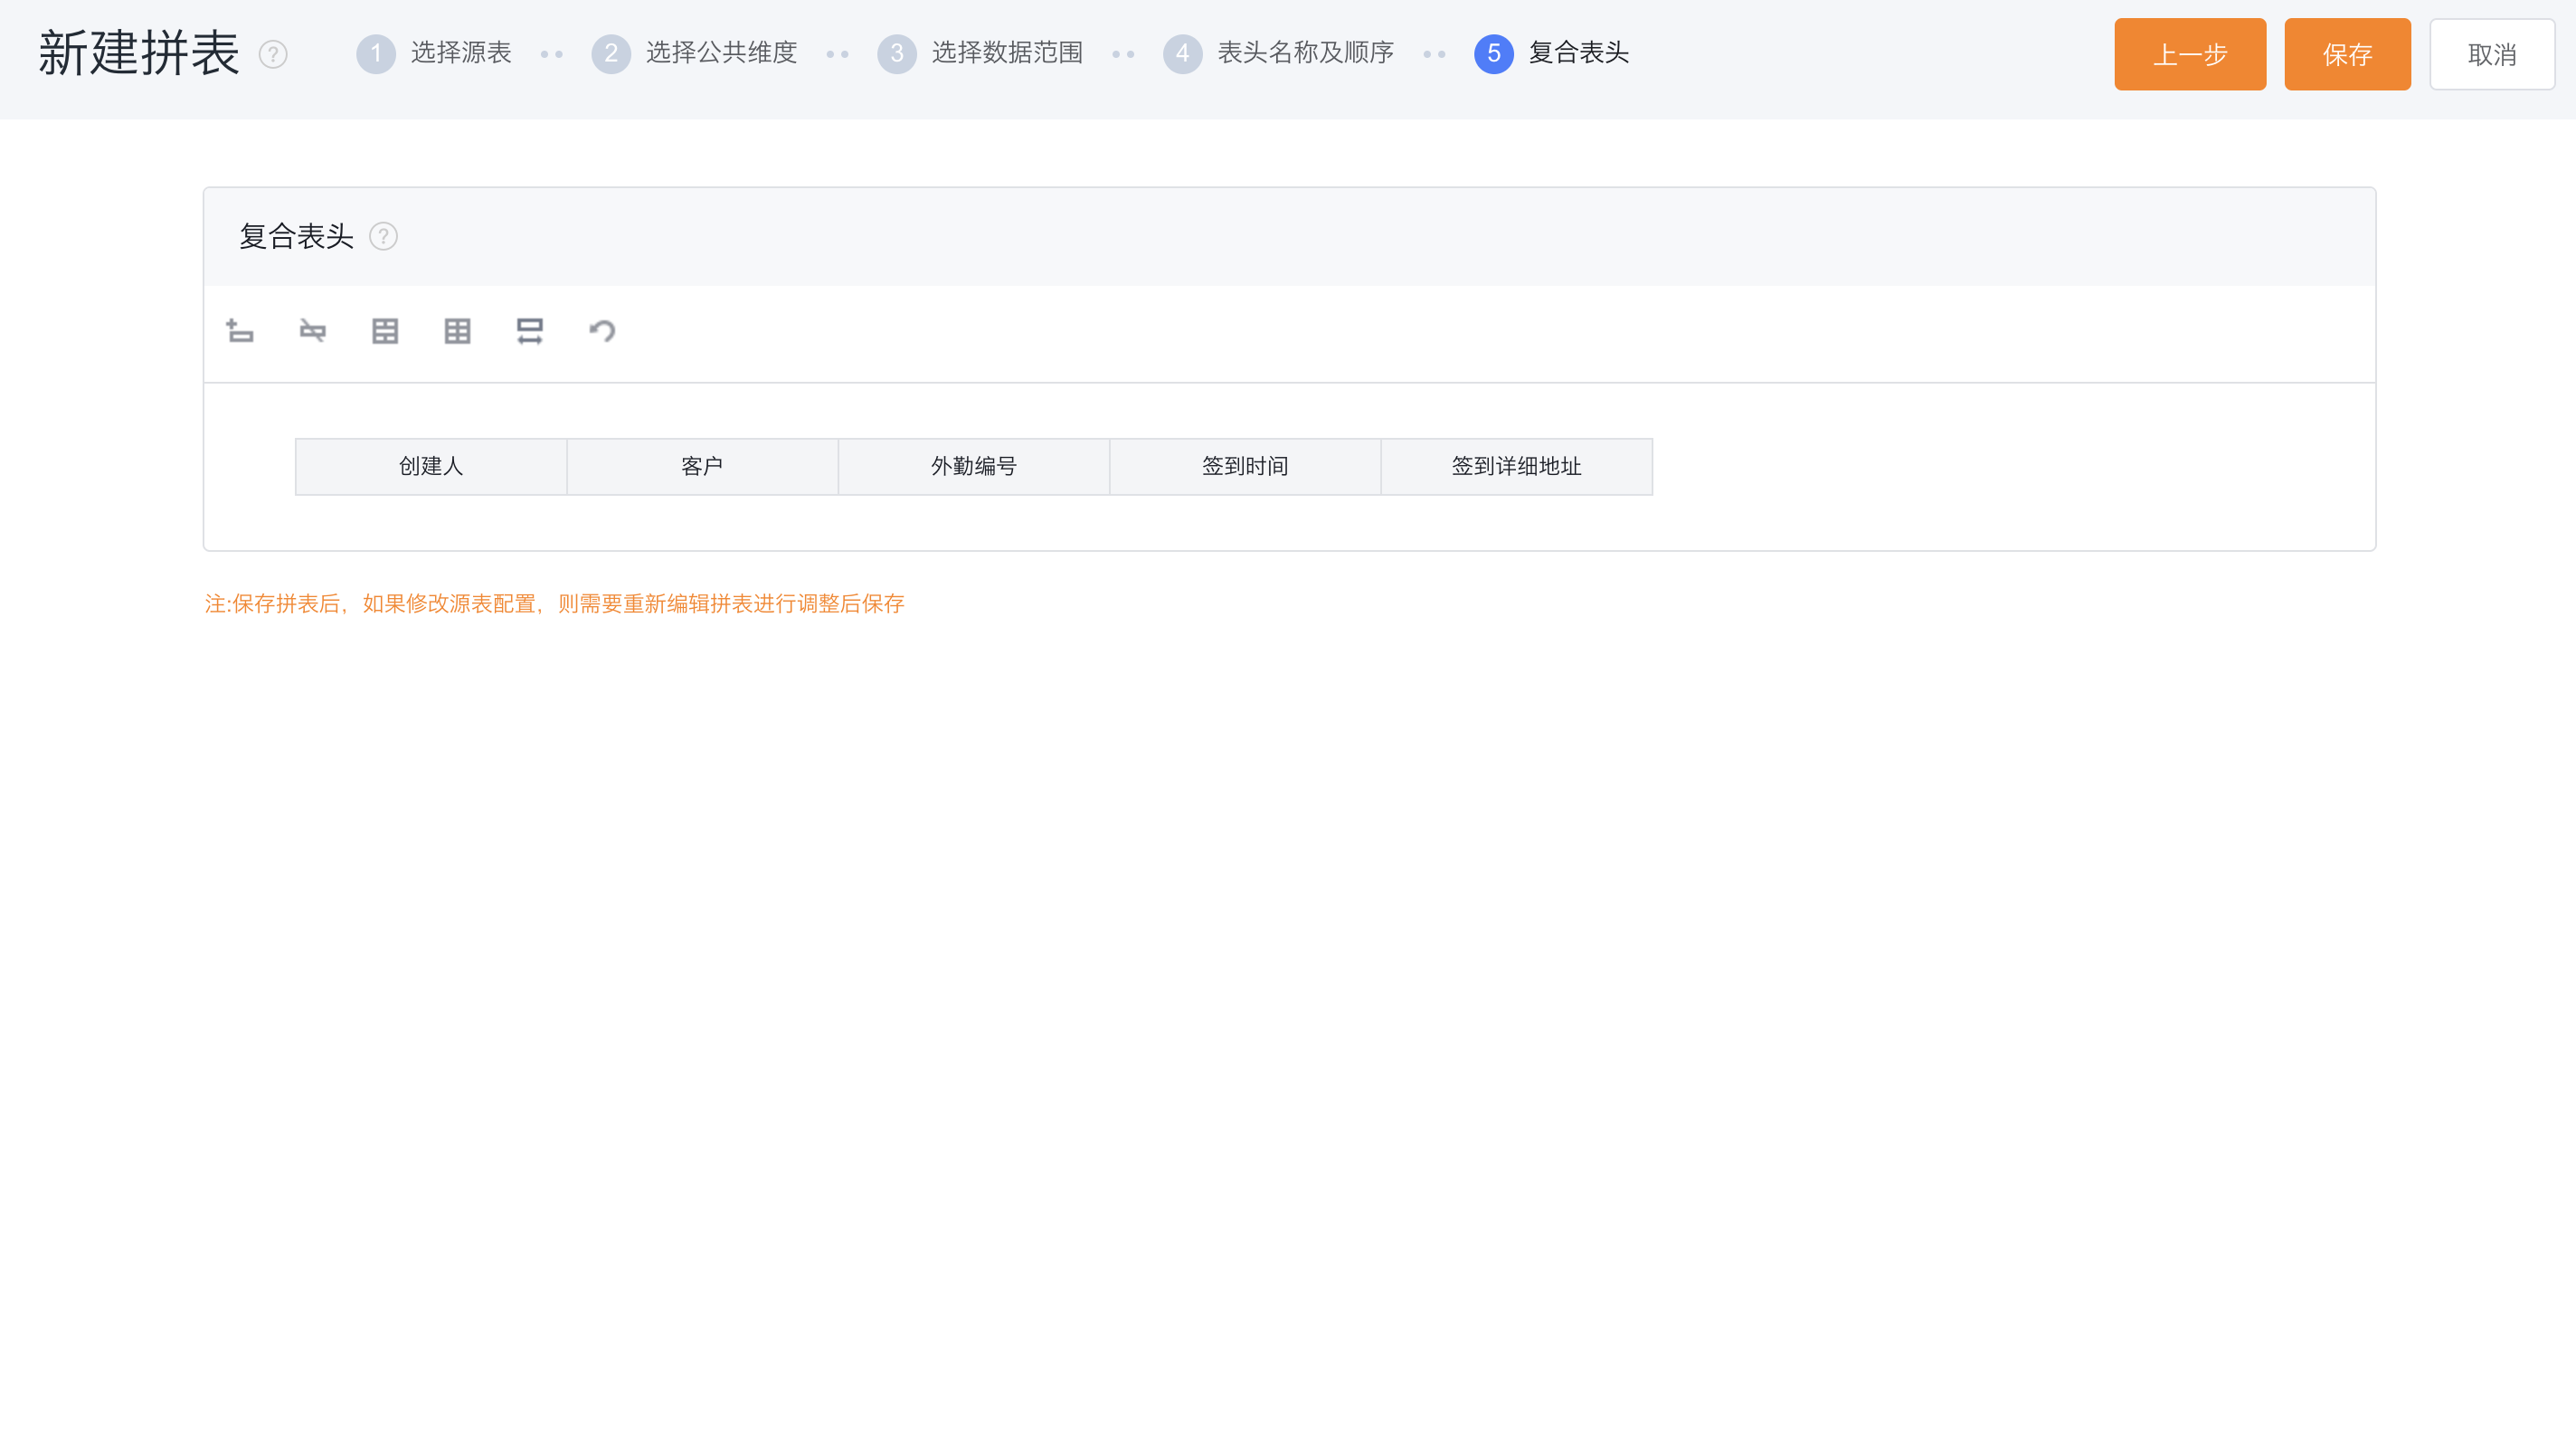
Composite header: Display the title and order of the headers adjusted in the previous step, and add multiple layers of composite headers to the top.
-
operate:
Add row: add a new row above; Delete row: delete the selected row; Merge cells: Merge multiple cells in the mouse circle; Split cell: split the merged cell back to the original cell; Compact mode: compact mode can be set; Back: Go back to the previous step; Modify column width: Click the original header to modify the column width; Modify the display name: Click the added grid to modify the display name; -
Case Description: This case does not need to add a composite header, just save it directly.
4.2.2 Table spelling results