
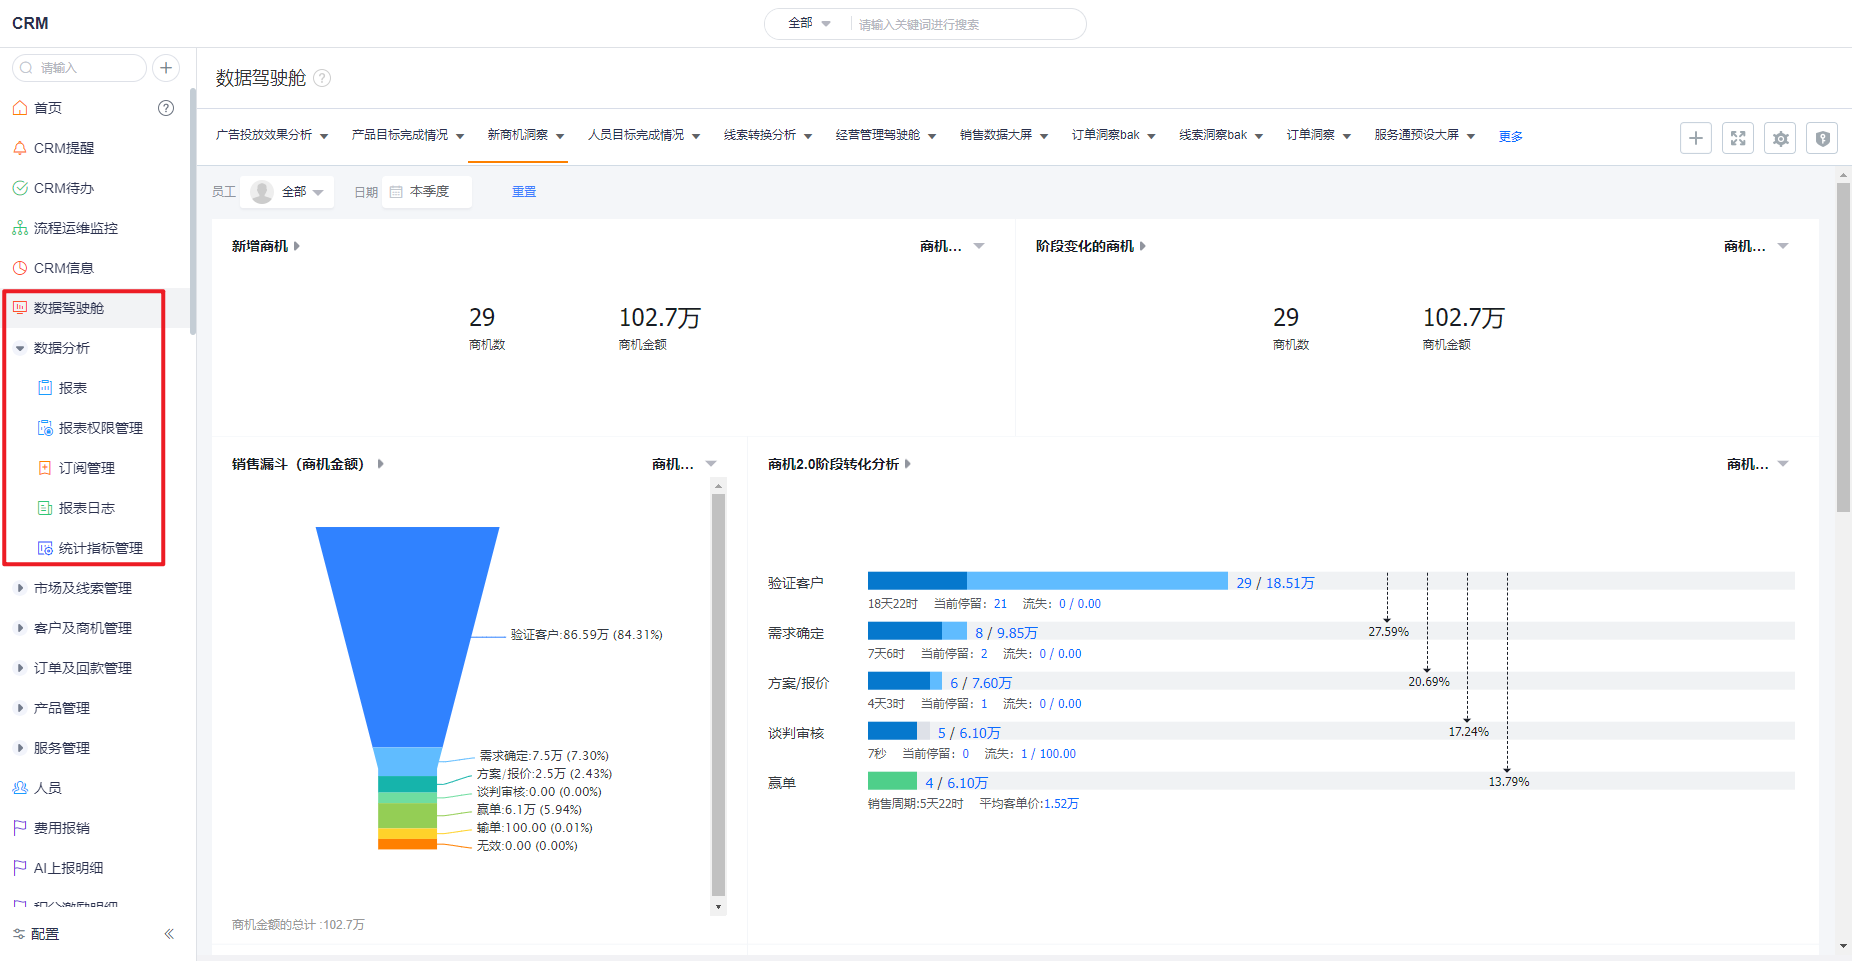
1. Data Dashboard
- Click Data Dashboard on the CRM navigation bar to enter the data dashboard page. This page can view, create, edit, and manage data dashboard.

- Each function point on this page has been introduced in details in the Data Dashboard chapter. For details, please refer to: Edit Data Dashboard
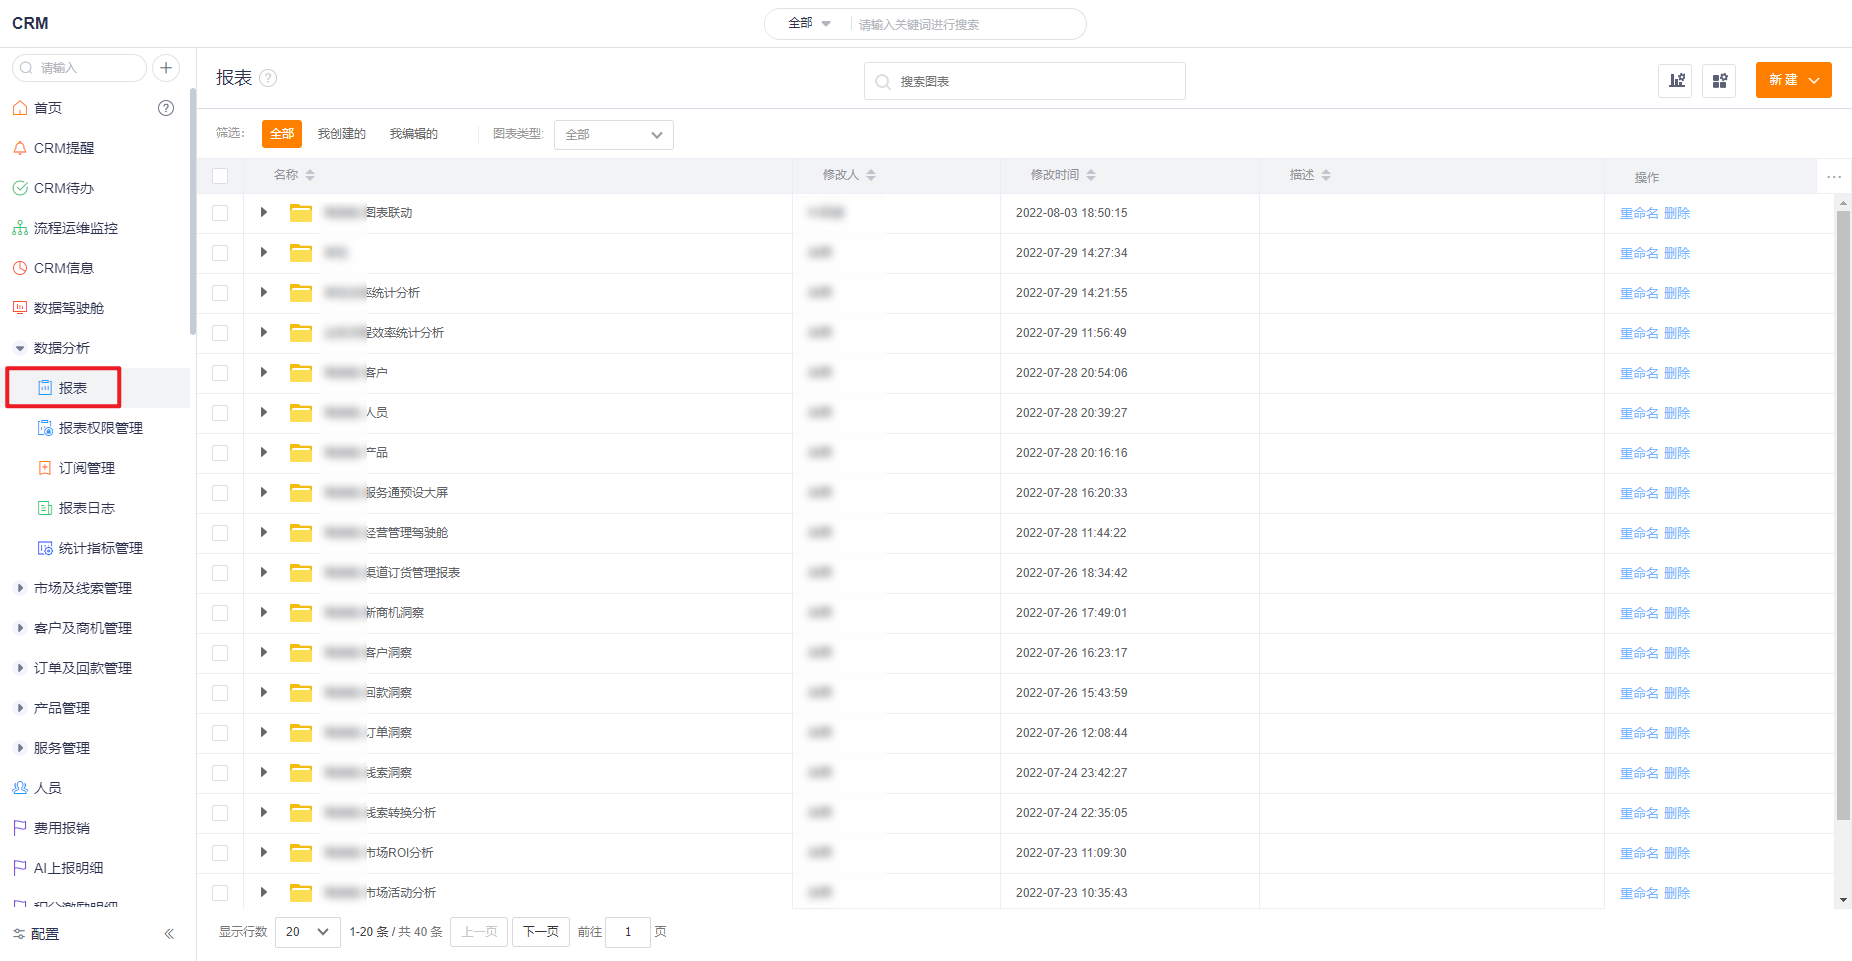
2. Report
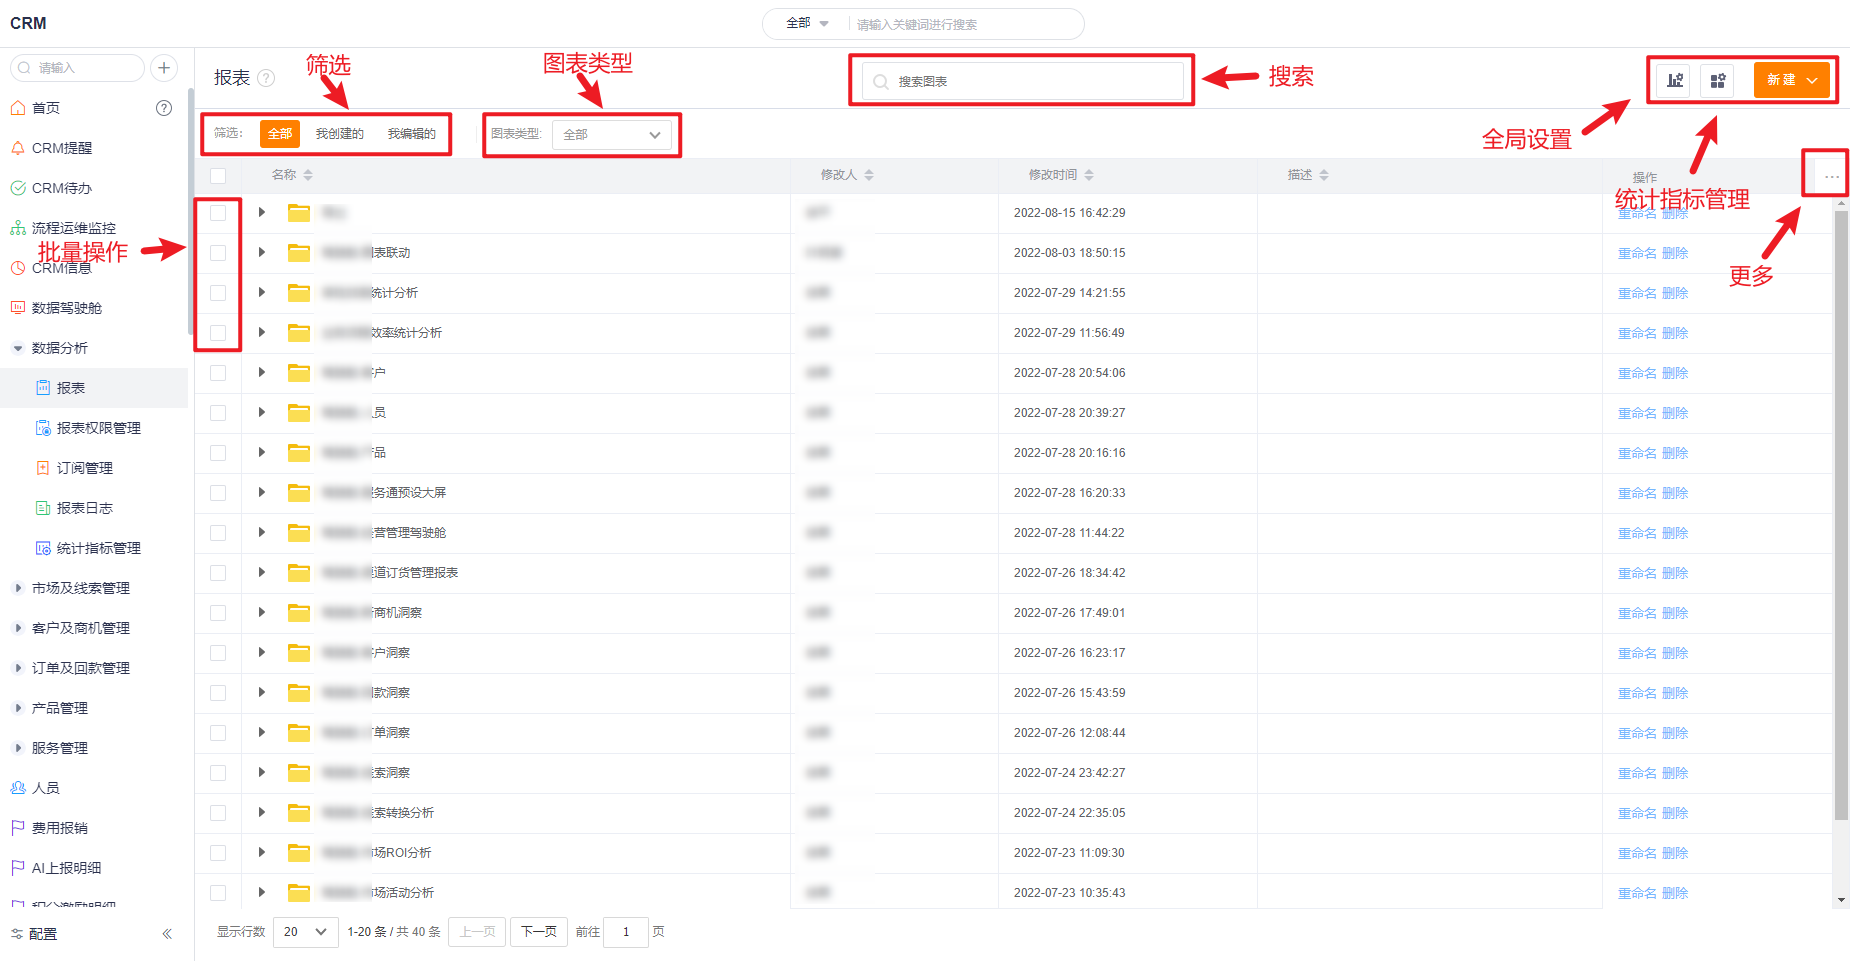
- Click the report entry in the CRM navigation bar to enter the report page. This page can filter, view, create, manage reports, etc.
-
Search: Supports fuzzy query of folder name and report name, hit text is highlighted, and the folder is displayed first and then the report is displayed.
-
Global Settings:
-
Whether to include obsolete data:
-
This configuration is only to control whether obsolete data is included when CRM administrators and report administrators view data in the chart (ordinary employees cannot see obsolete data in the chart);
-
Check: indicates that the administrator includes obsolete data by default when viewing the report, and can further filter out obsolete data by life status; when viewing the statistical graph, the basic indicators include obsolete data, which can be filtered by life status;
-
Unchecked: means that the administrator does not include obsolete data when viewing reports and statistical charts;
-
Regardless of whether it is checked or not, the statistical graph aggregation indicators do not include obsolete data;
-
-
Whether to include the data of resigned employees:
-
This configuration is only used to control whether to include the resigned employees under the department when the employees of the enterprise use the main department or person in charge field to filter a certain department within the data range of the chart; when the data range does not use the main department and responsible person When screening people, it includes resigned employees.
-
This configuration is an enterprise-level configuration. When the administrator modifies the configuration, it will overwrite the personal-level configuration of all employees;
-
Individuals can still modify their own configurations during screening as needed without affecting others;
-
-
Whether the leaderboard allows employees to view the configuration of the ranking index value
-
The leaderboard is based on the ranking within the company-wide data range, and it is possible to control whether employees can view the value of the ranking indicator
-
The default is "No", which means that only the ranking can be viewed, and the value cannot be viewed. Select "Yes", which means that not only the ranking but also the value can be viewed (data permission is still required to view detailed data).
-
-
Business opportunity 2.0 stage conversion analysis preset chart configuration
- For the modification of the time field, it can be modified to other time fields and time periods by default;
- At most one custom filter can be added, and the custom filter can be locked
- Indicator formatting - If you customize the indicator format, it is divided into two types: amount type and numerical type. After setting, it will take effect uniformly for all the amount or numerical type fields displayed in the chart;
- By default, the total conversion rate is displayed (total number of business opportunities in this stage/total number of business opportunities in the first stage), which can be switched to inter-stage conversion rate (total number of business opportunities in this stage/total number of business opportunities in the previous stage);
- Count the data of the skip status, which corresponds to the process stage. The statistics are that the stage status belongs to completed, skipped, in progress, and incomplete and the sub-status does not belong to unsuccessful or returned. For the data that does not count the skip status, corresponding to the process stage, the statistics are that the stage status belongs to completed, in progress and the sub-status does not belong to unsuccessful, returned, and skipped;
-
-
Filter: All - All reports visible; Created by me - Created by my chart; Edited by me - Modified by my chart
-
Chart type: You can filter all types of charts, statistical charts, and reports
-
Batch operation: Select the check box in front of the folder or chart to delete, export, merge and export in batches
-
More hidden fields: You can check the fields to display on the page, including: description, creation time, creator, template name, template classification
-
Folder operations: you can rename folders and delete folders
-
More operations on charts: edit, export, delete, subscribe, move, create copy, rename report/chart, forward. Display operation function keys according to user permissions
- Measures Management: For the related content of measures management, please refer to: Configure Statistical Chart
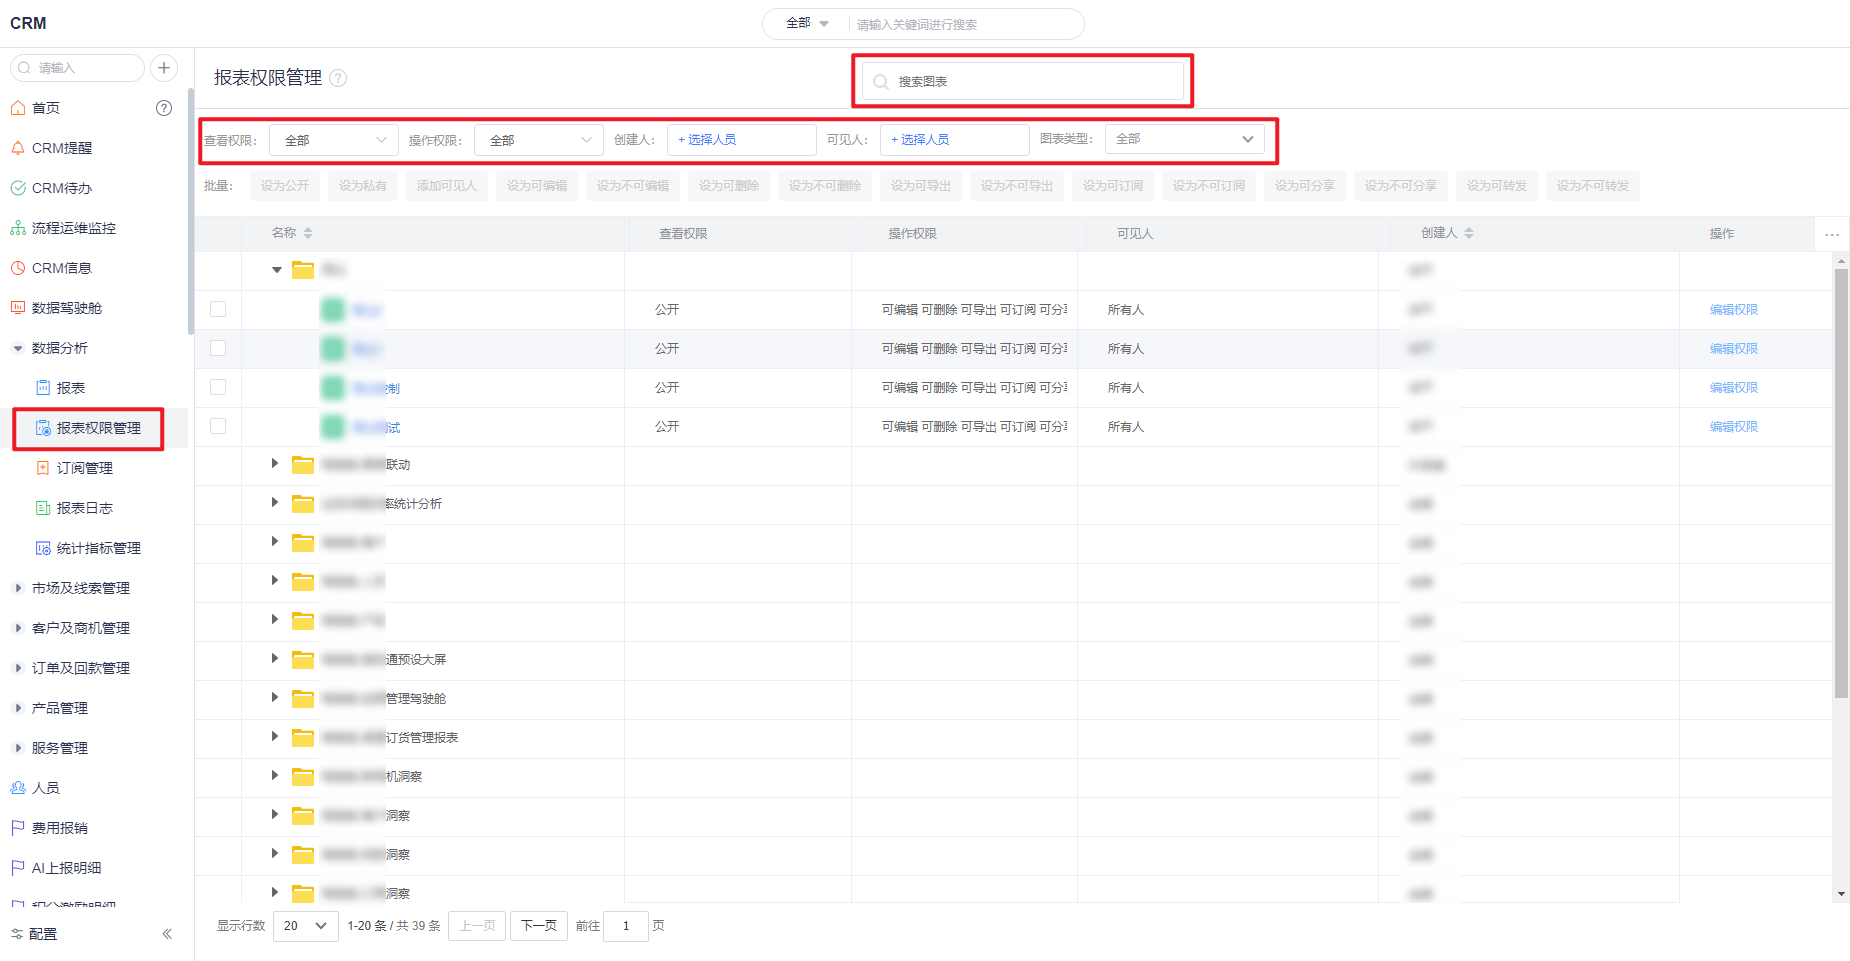
3. Report Permission Management
- Click Report Permission Management on the CRM navigation bar to enter the report permission management page. On this page, you can view the permission of the chart, modify the permission of the chart, etc.
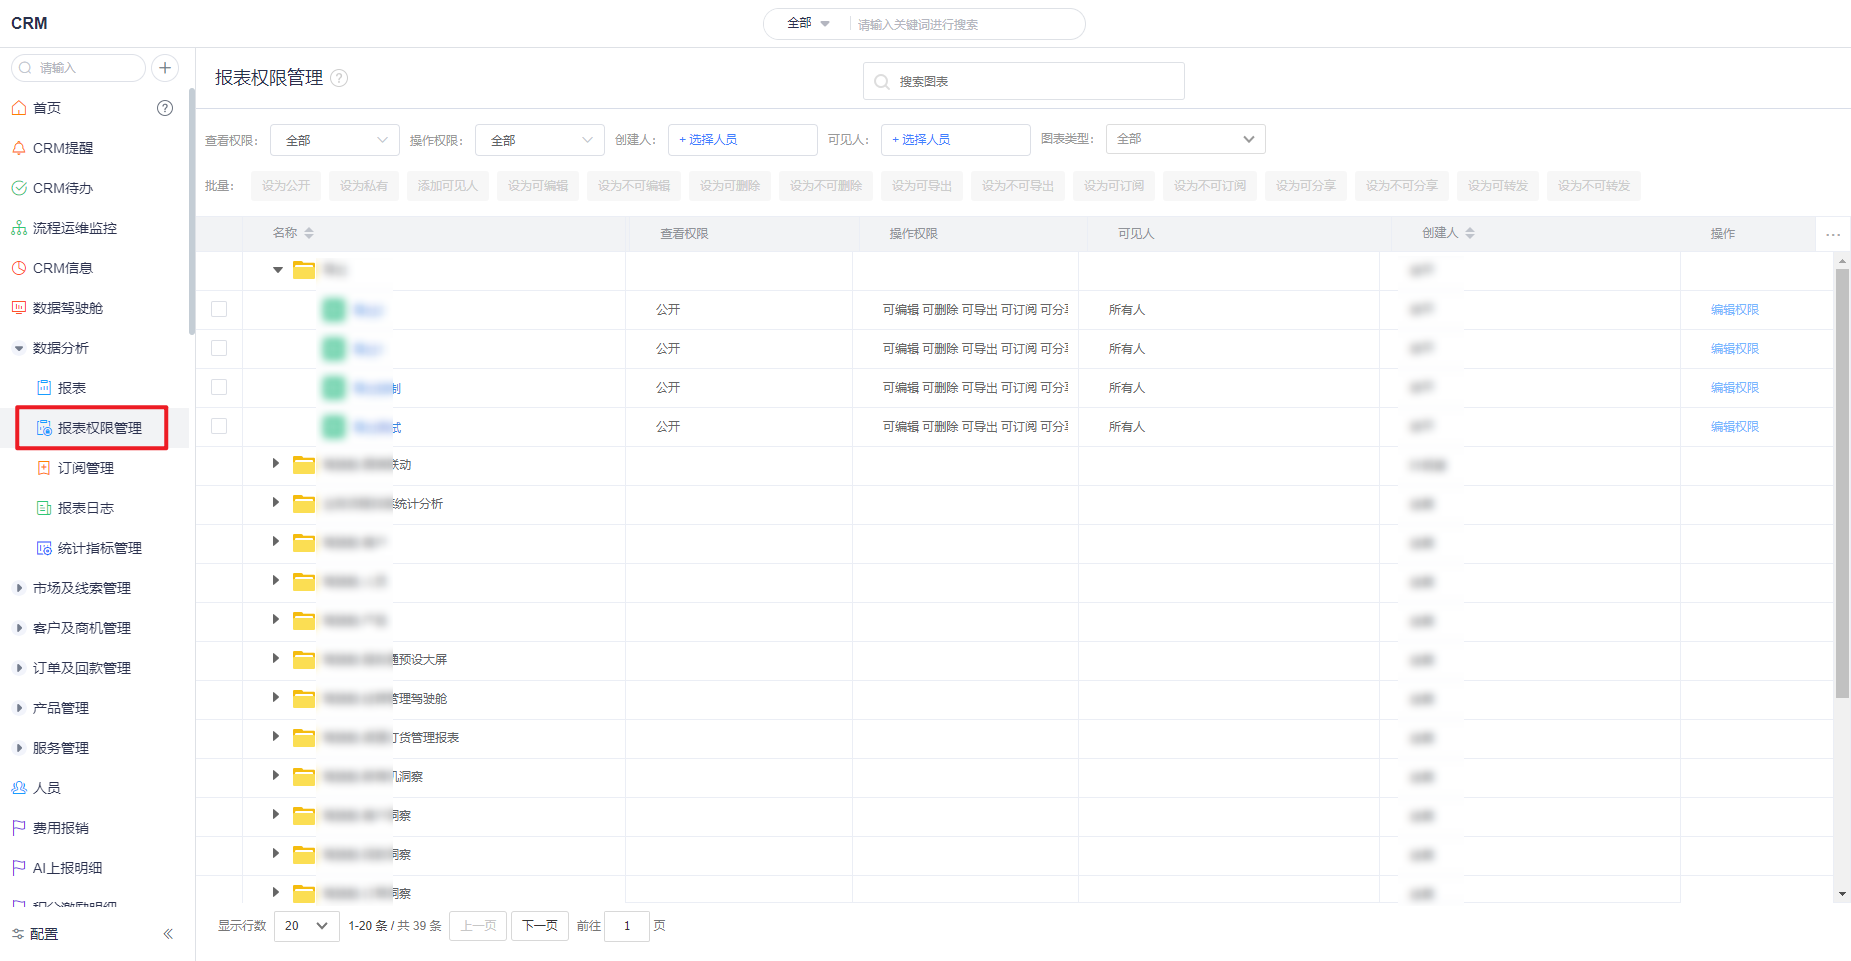
- View Report Permission: In the search box, you can search for a specific chart name, and view the specific viewing permission and operation permission of the chart.
- View Charts with Certain Permission: You can jointly search for charts with a certain permission according to viewing permission, operation permission, creator, visible person, and chart type.
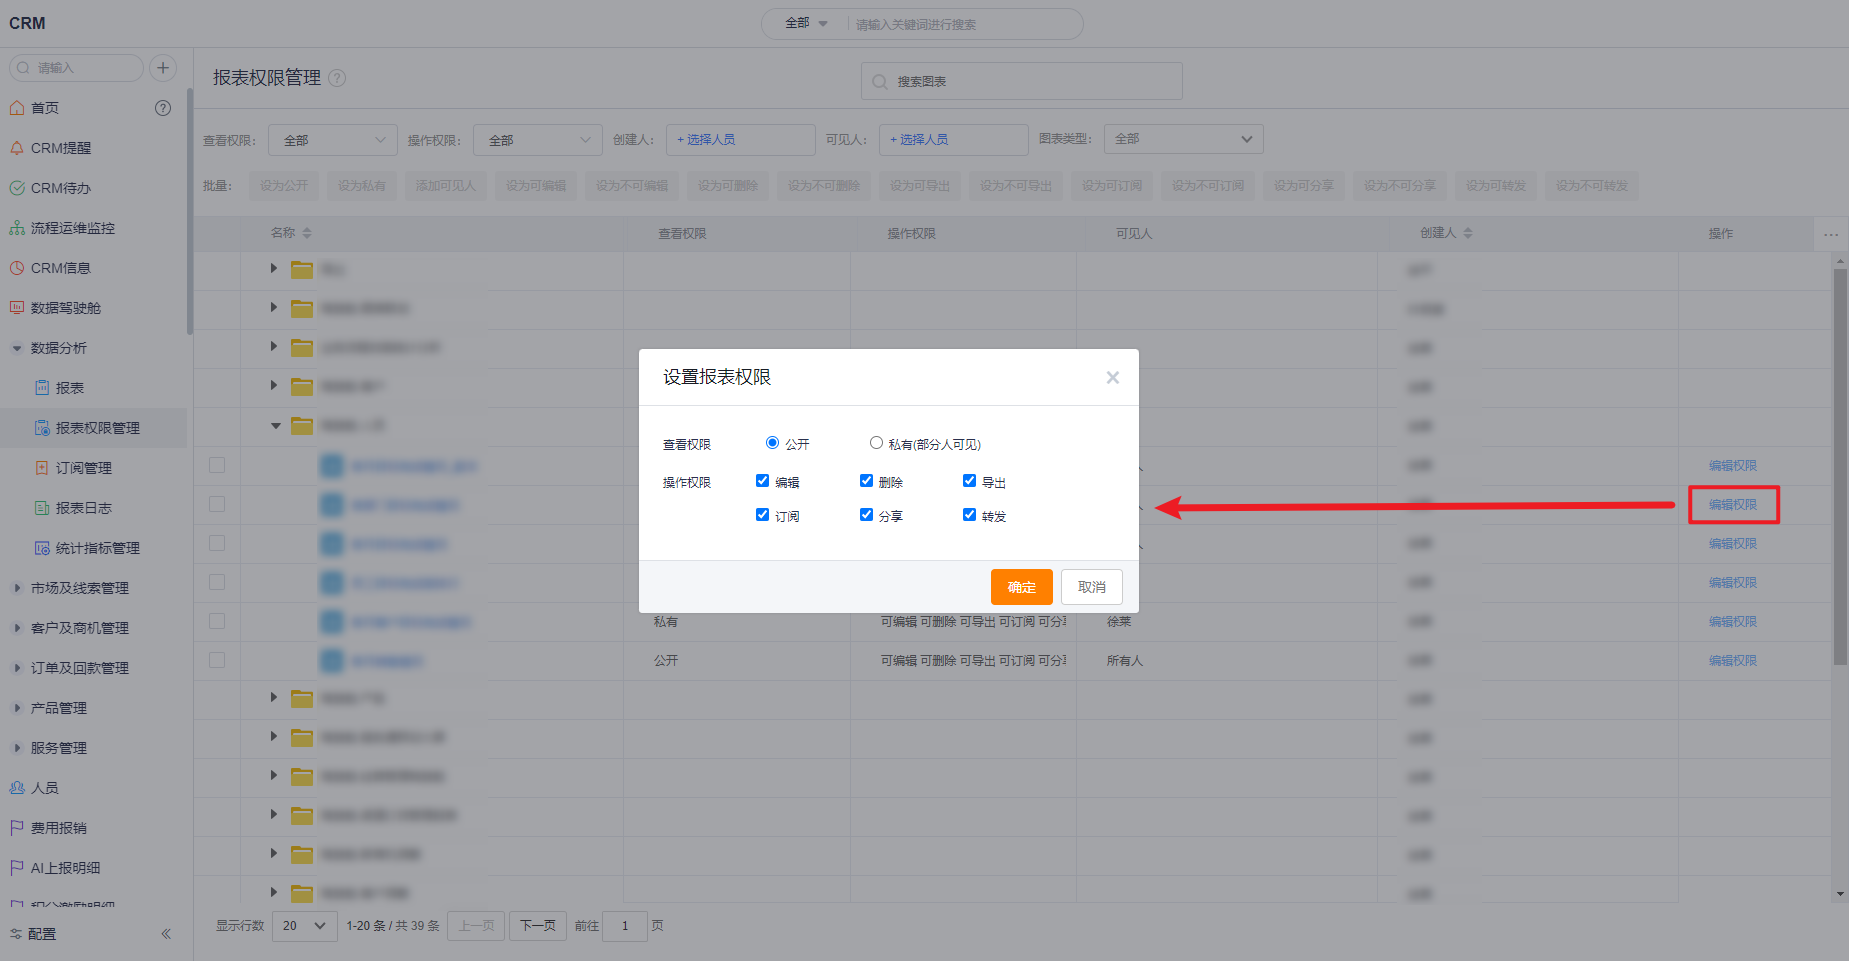
- Edit the permission of a specific chart: You can click the edit permission of a single chart to edit the permission of a single chart.
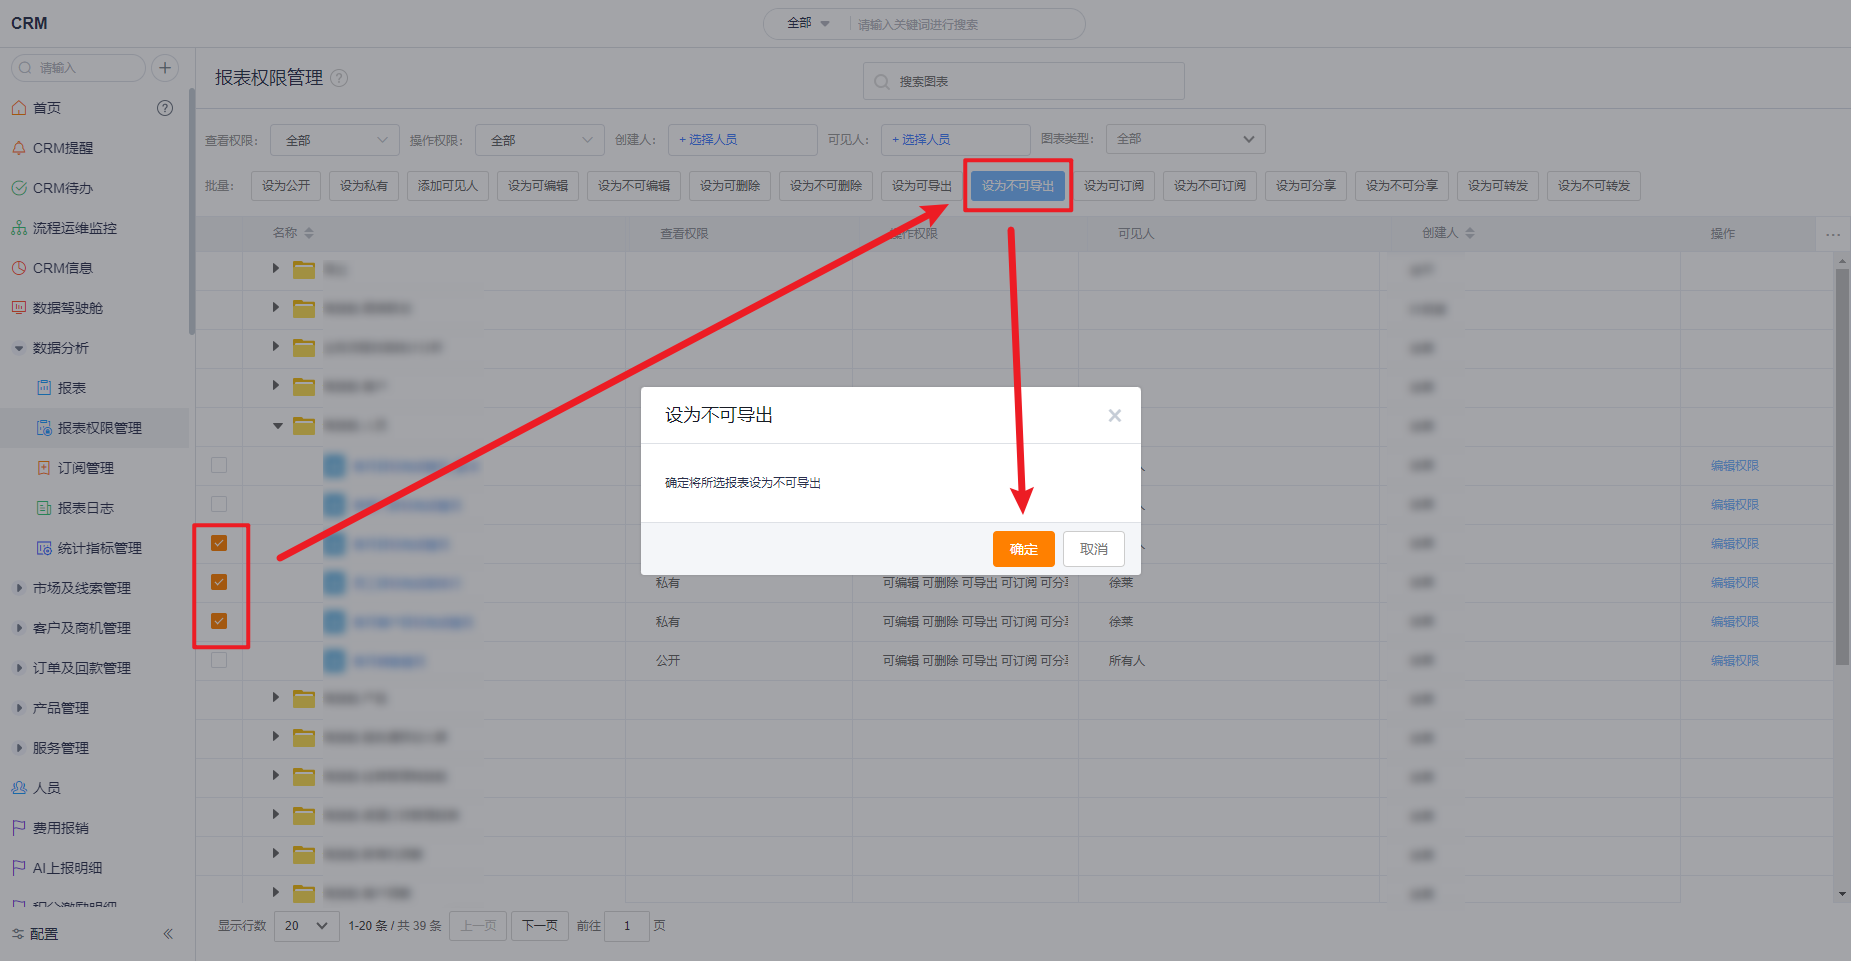
- Edit chart permissions in batches: Click the check box in front of a folder or chart, and select specific permissions to modify chart permissions in batches.
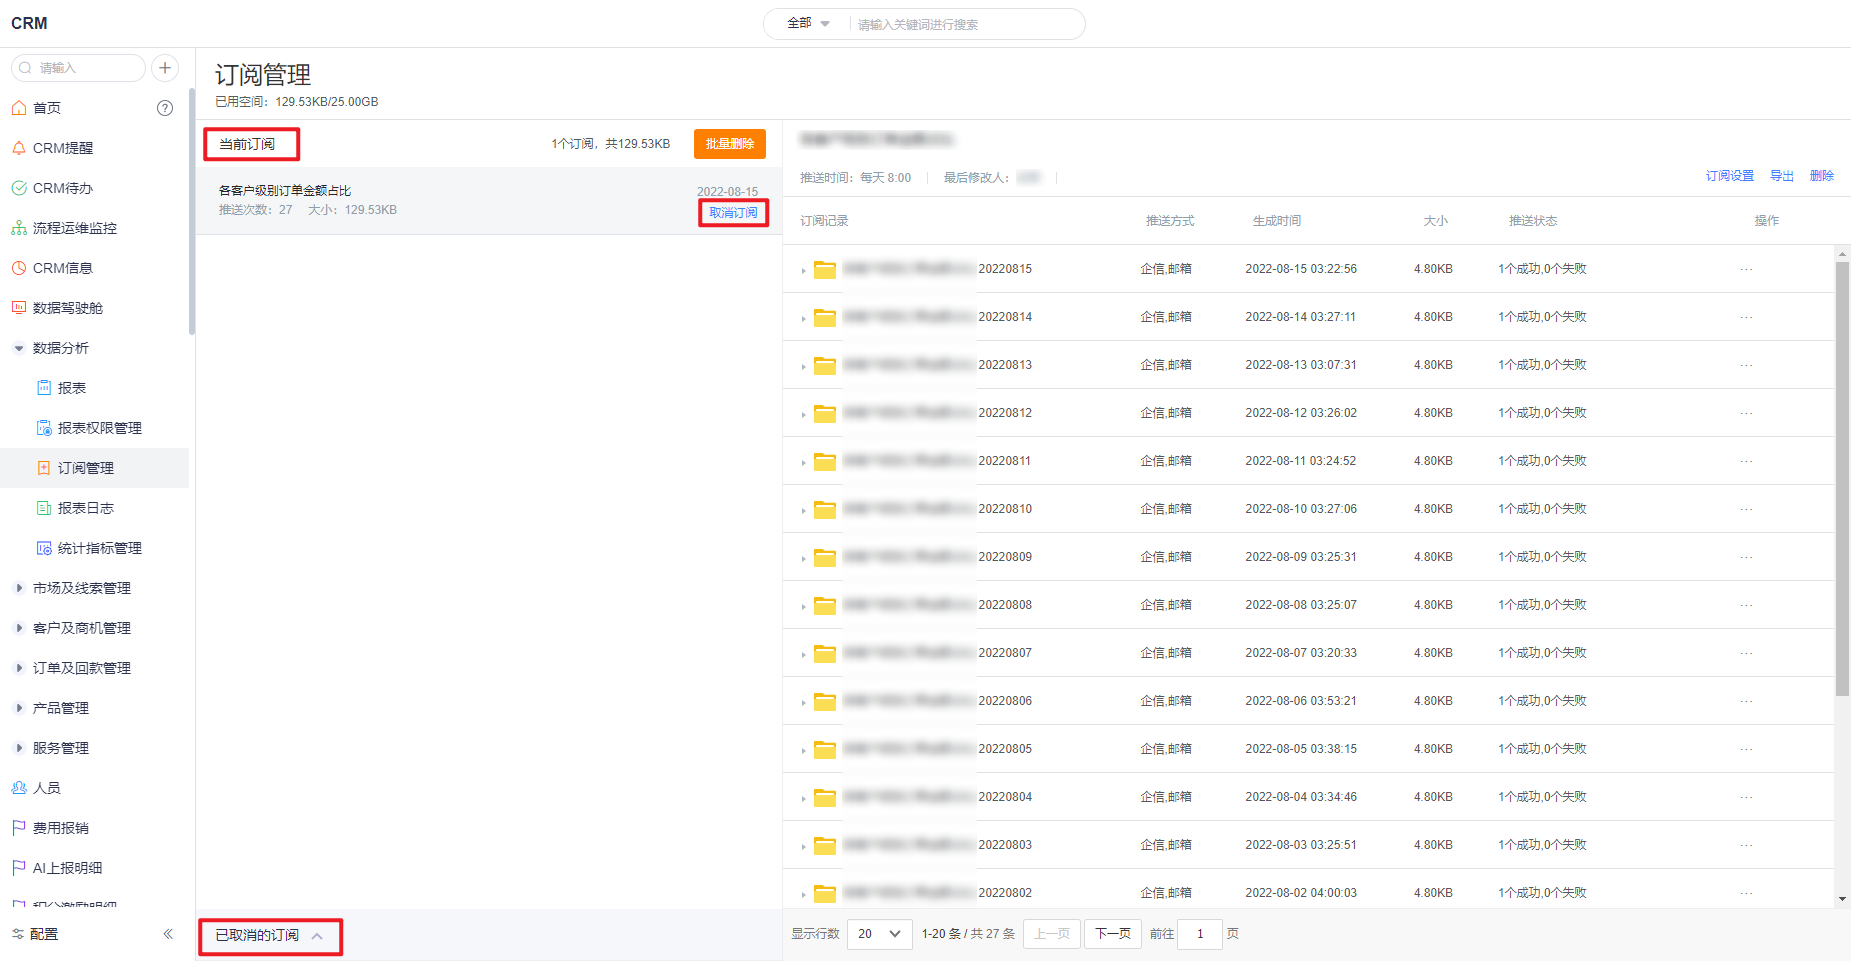
4. Subscription Management
- Click Subscription Management on the CRM navigation bar to enter the subscription management page. On this page, you can view historical subscription tasks, cancel subscriptions, reset subscriptions, etc.
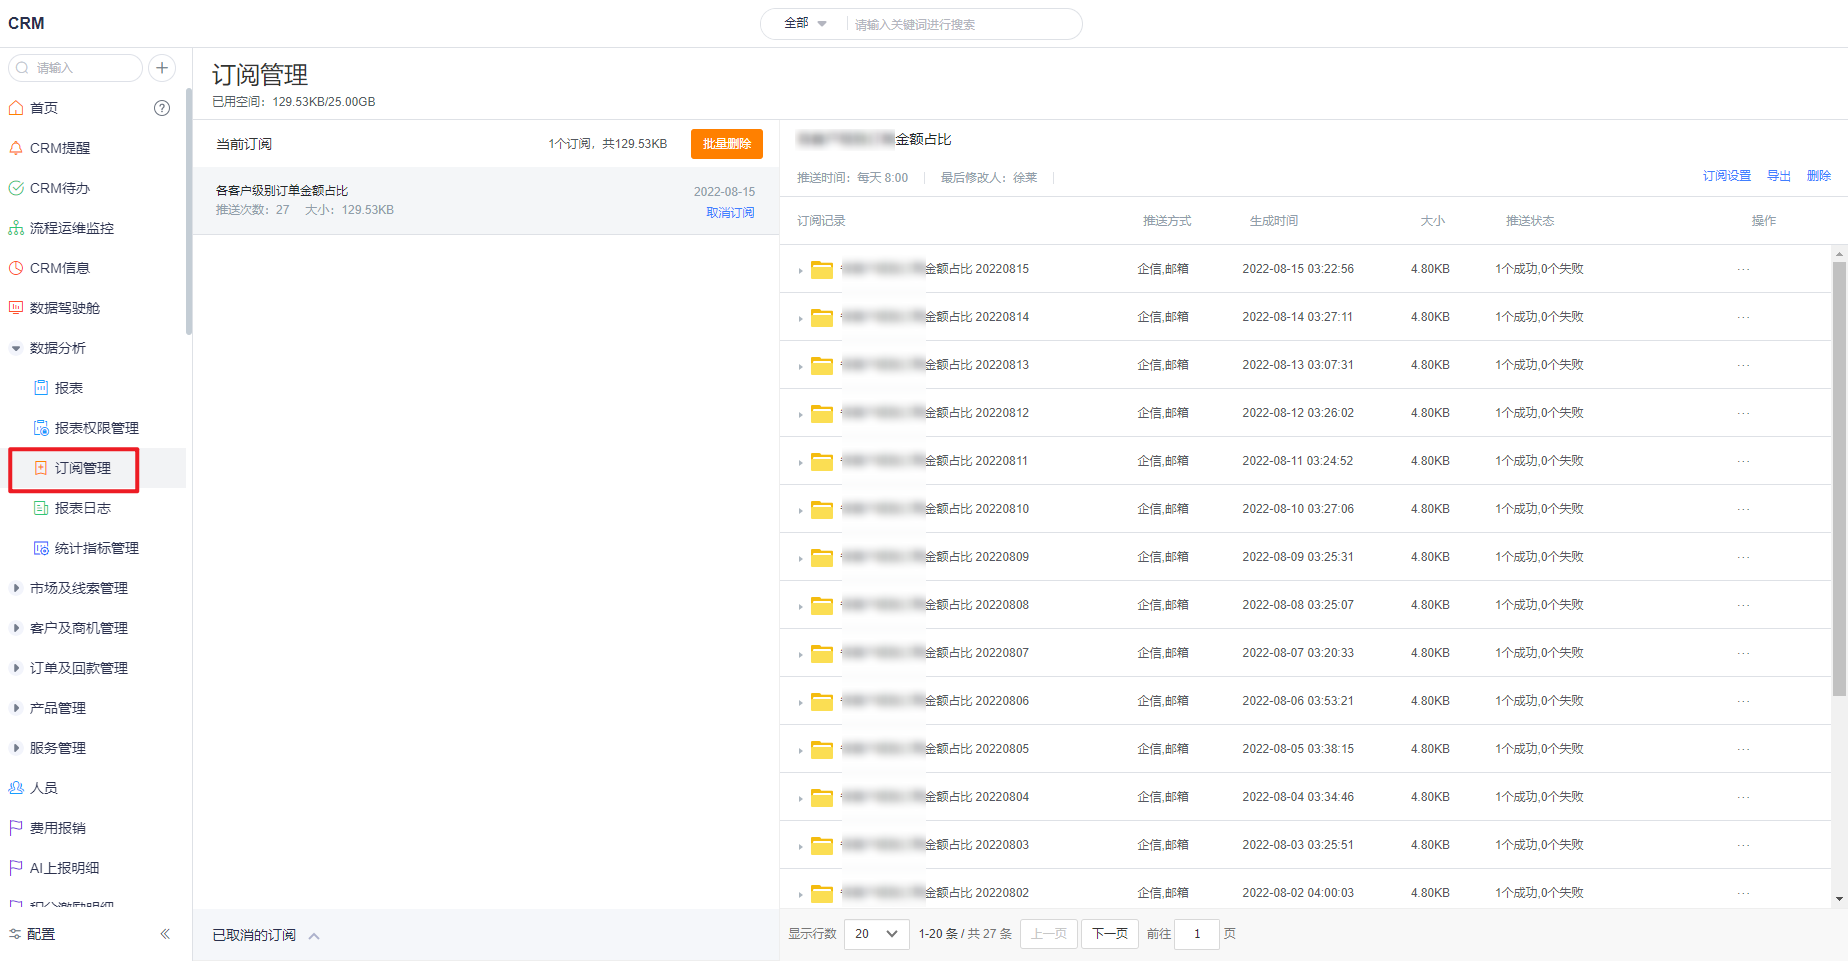
- View Current Subscriptions/Cancelled Subscriptions: You can view subscription tasks, the number of pushed subscriptions, and the occupied space.
- Unsubscribe/Resume Subscription: Click Unsubscribe to cancel the subscription task, and the canceled subscription task will be moved to the canceled subscription;
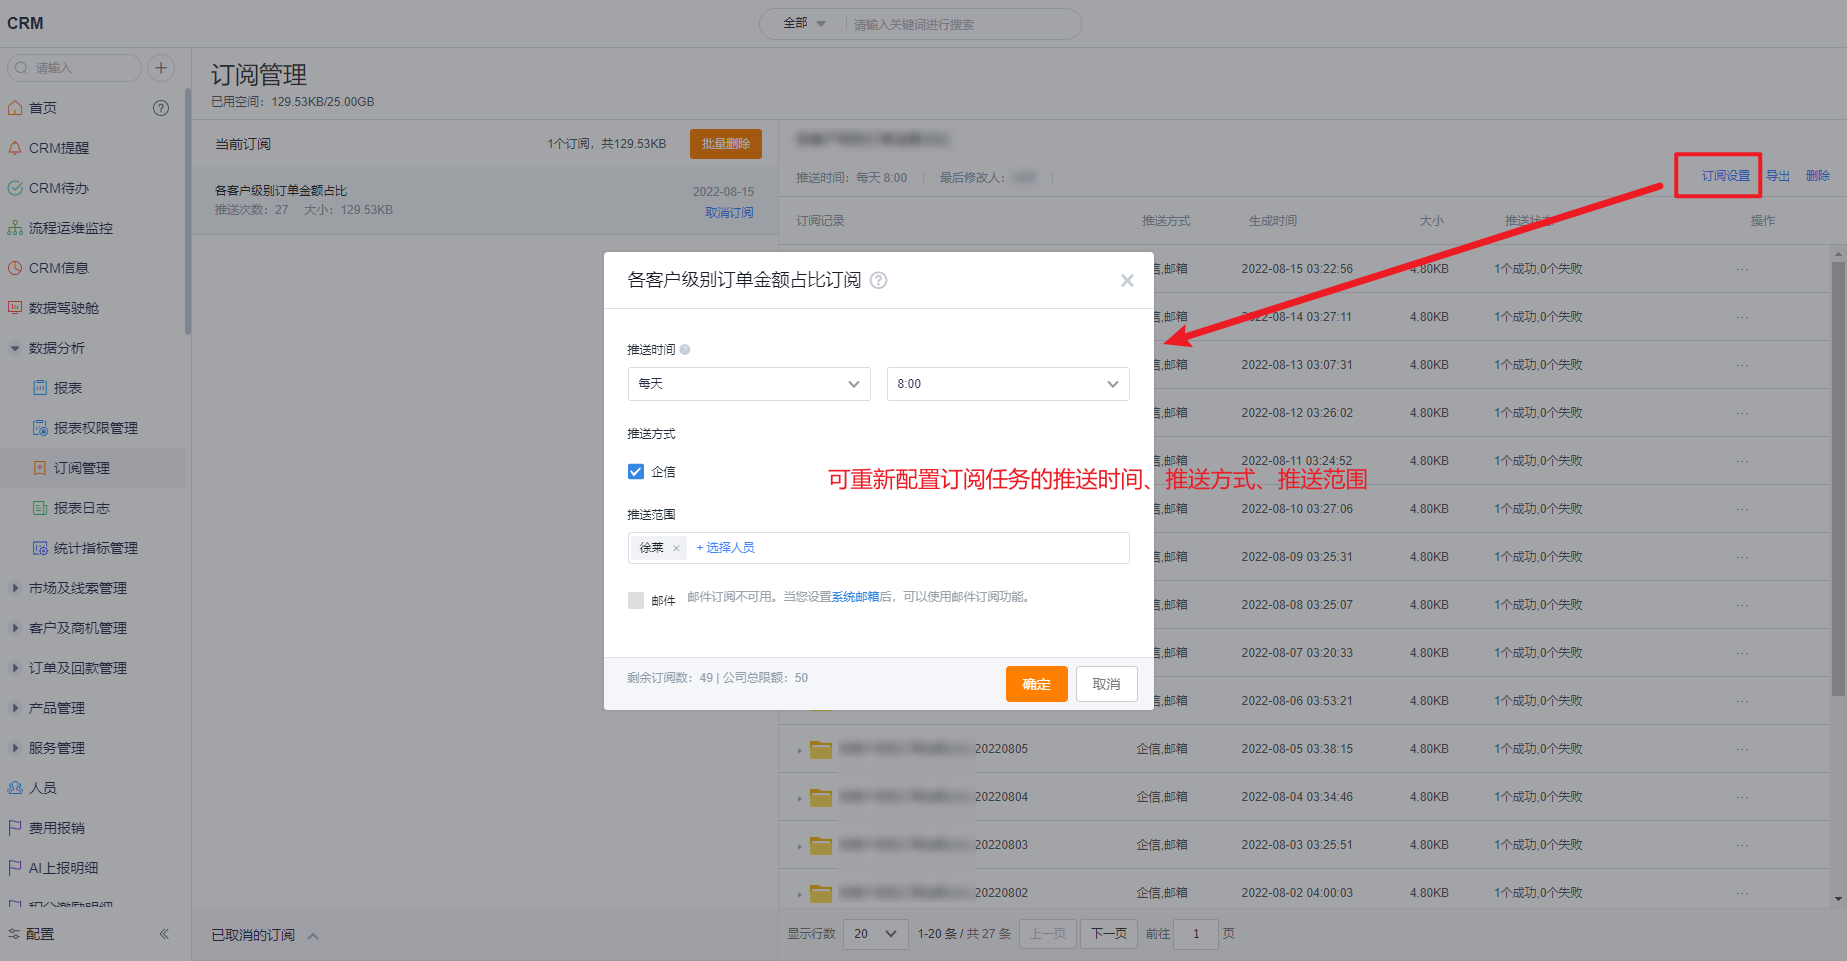
- Subscription Settings: Subscription tasks can be reconfigured
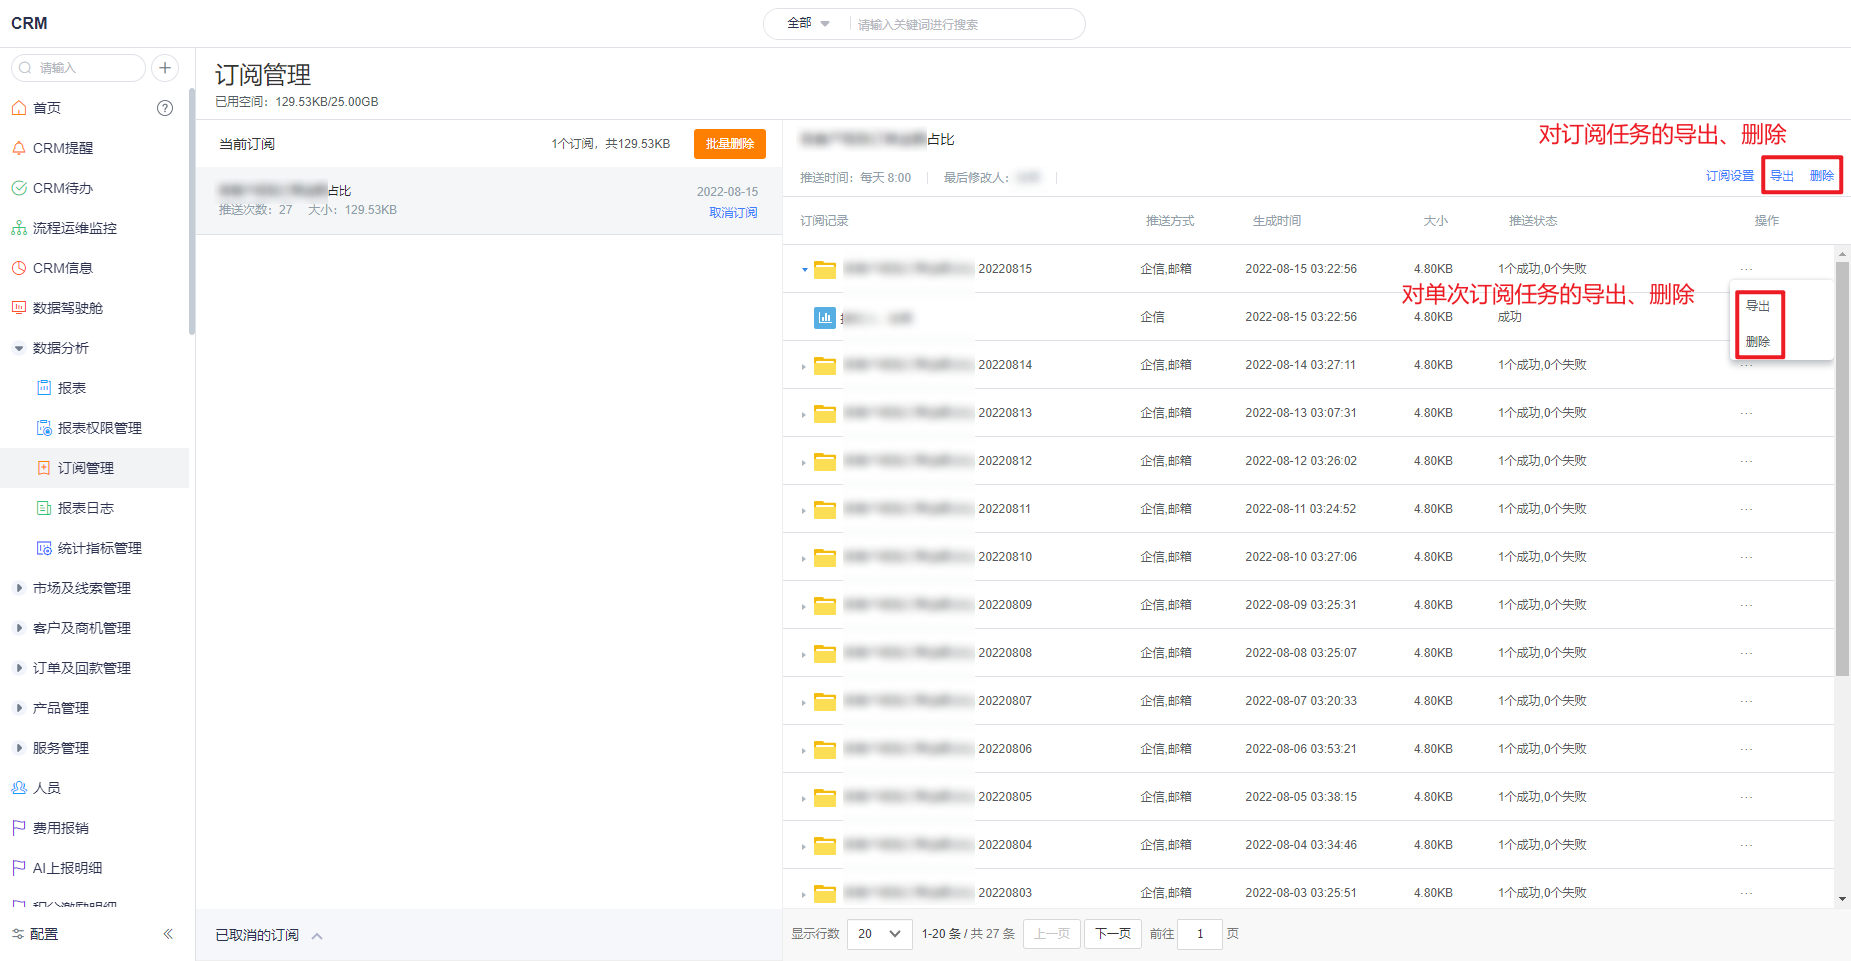
- Export: You can export a single subscription task or the subscription file of a single subscription task
- Delete: You can delete a single subscription task or the subscription file of a single subscription task
- Batch Delete - Delete by Generation Date: delete all subscription files before a certain point in time
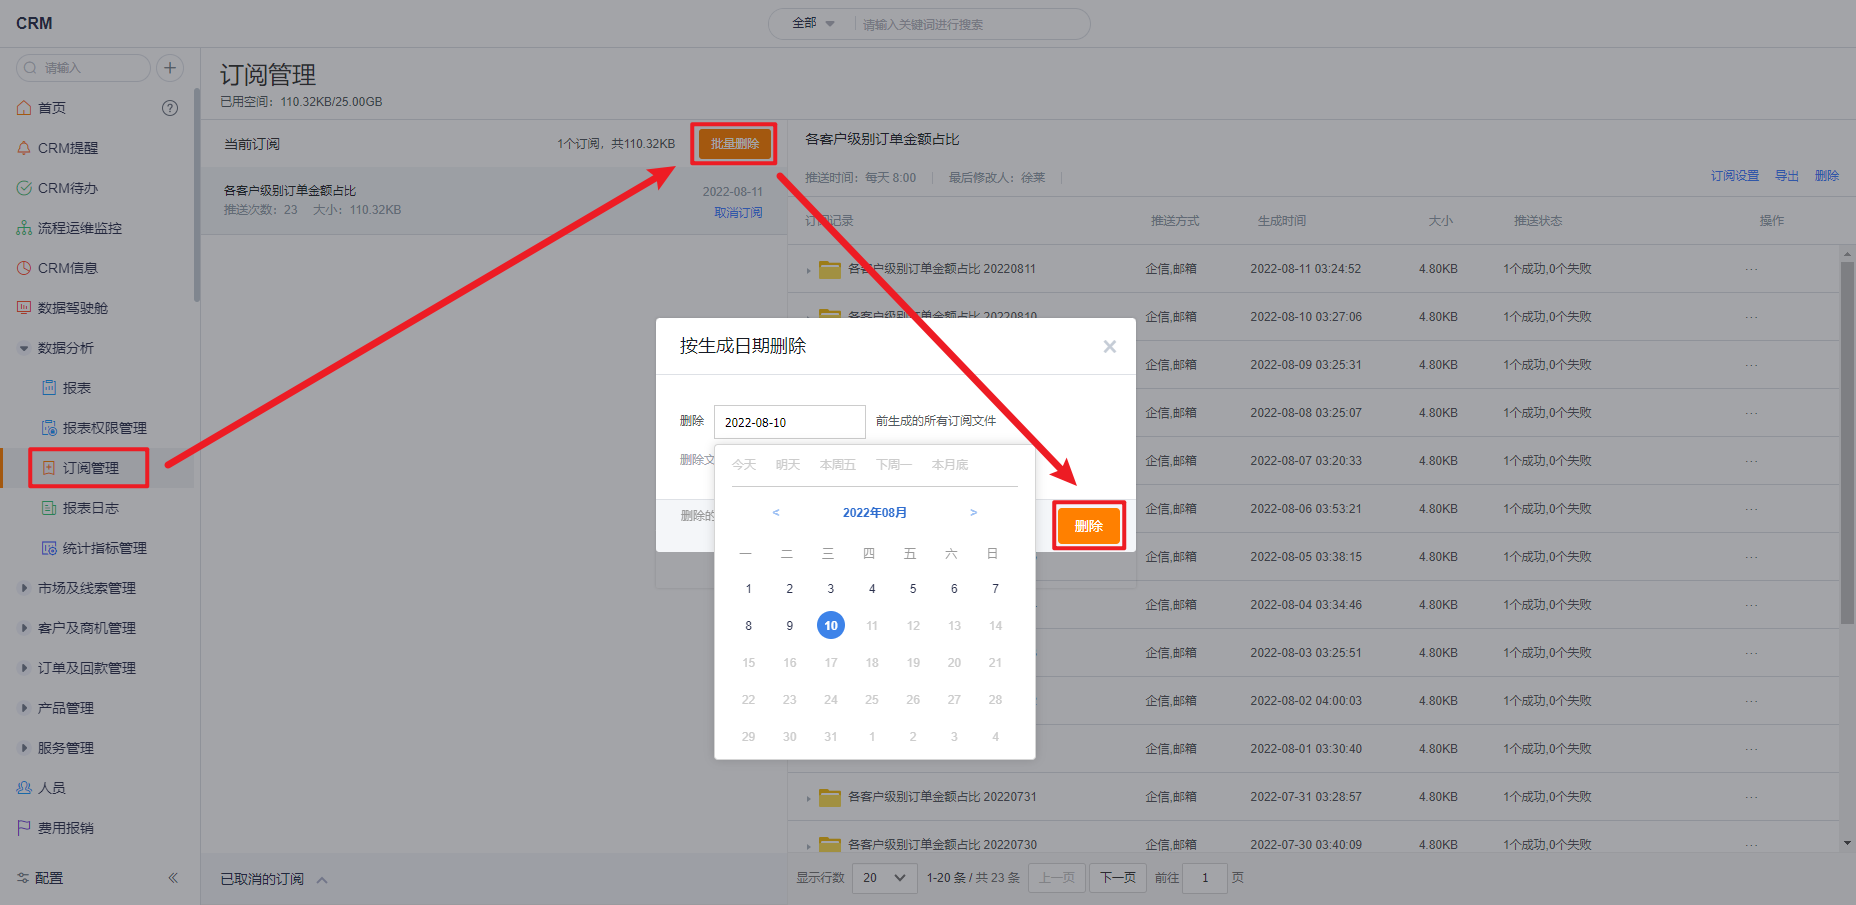
- Batch Delete-Regular Delete: regularly delete all subscription files outside the retention period calculated by the generation date on the 1st of each month

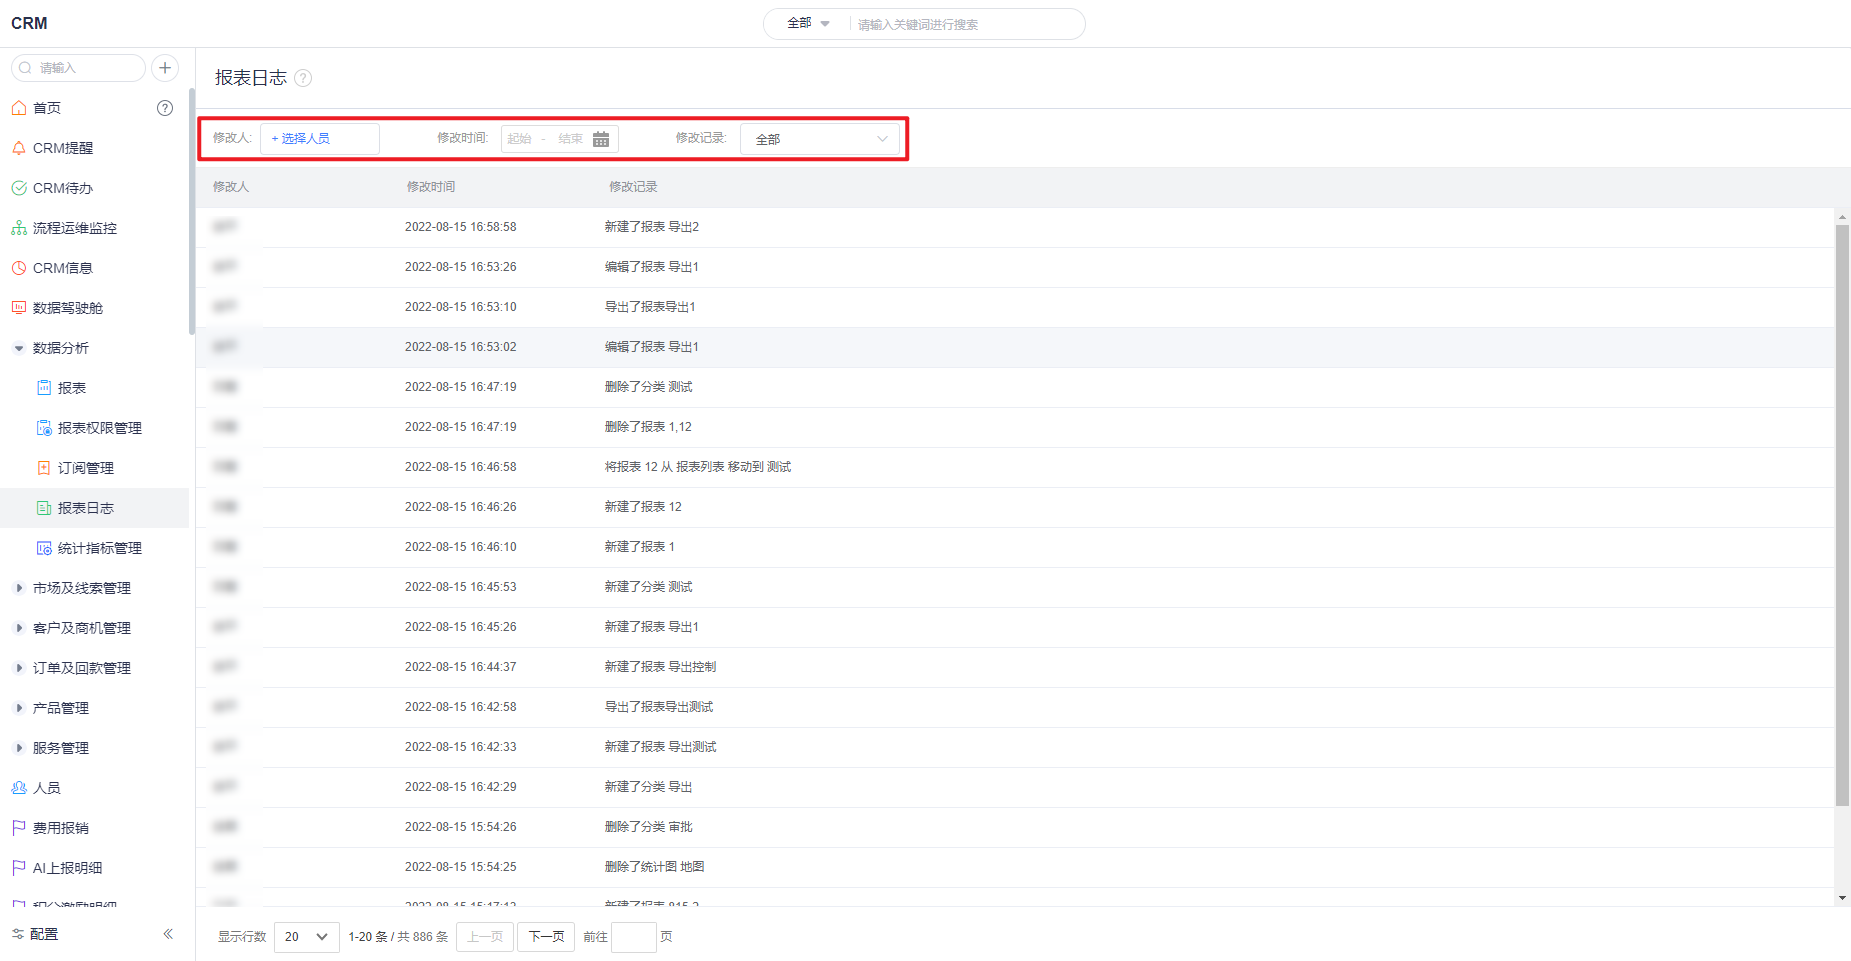
5. Report Log
- Click Report Log on the CRM navigation bar to enter the report log page. On this page, you can check the specific operation behavior of all employees.
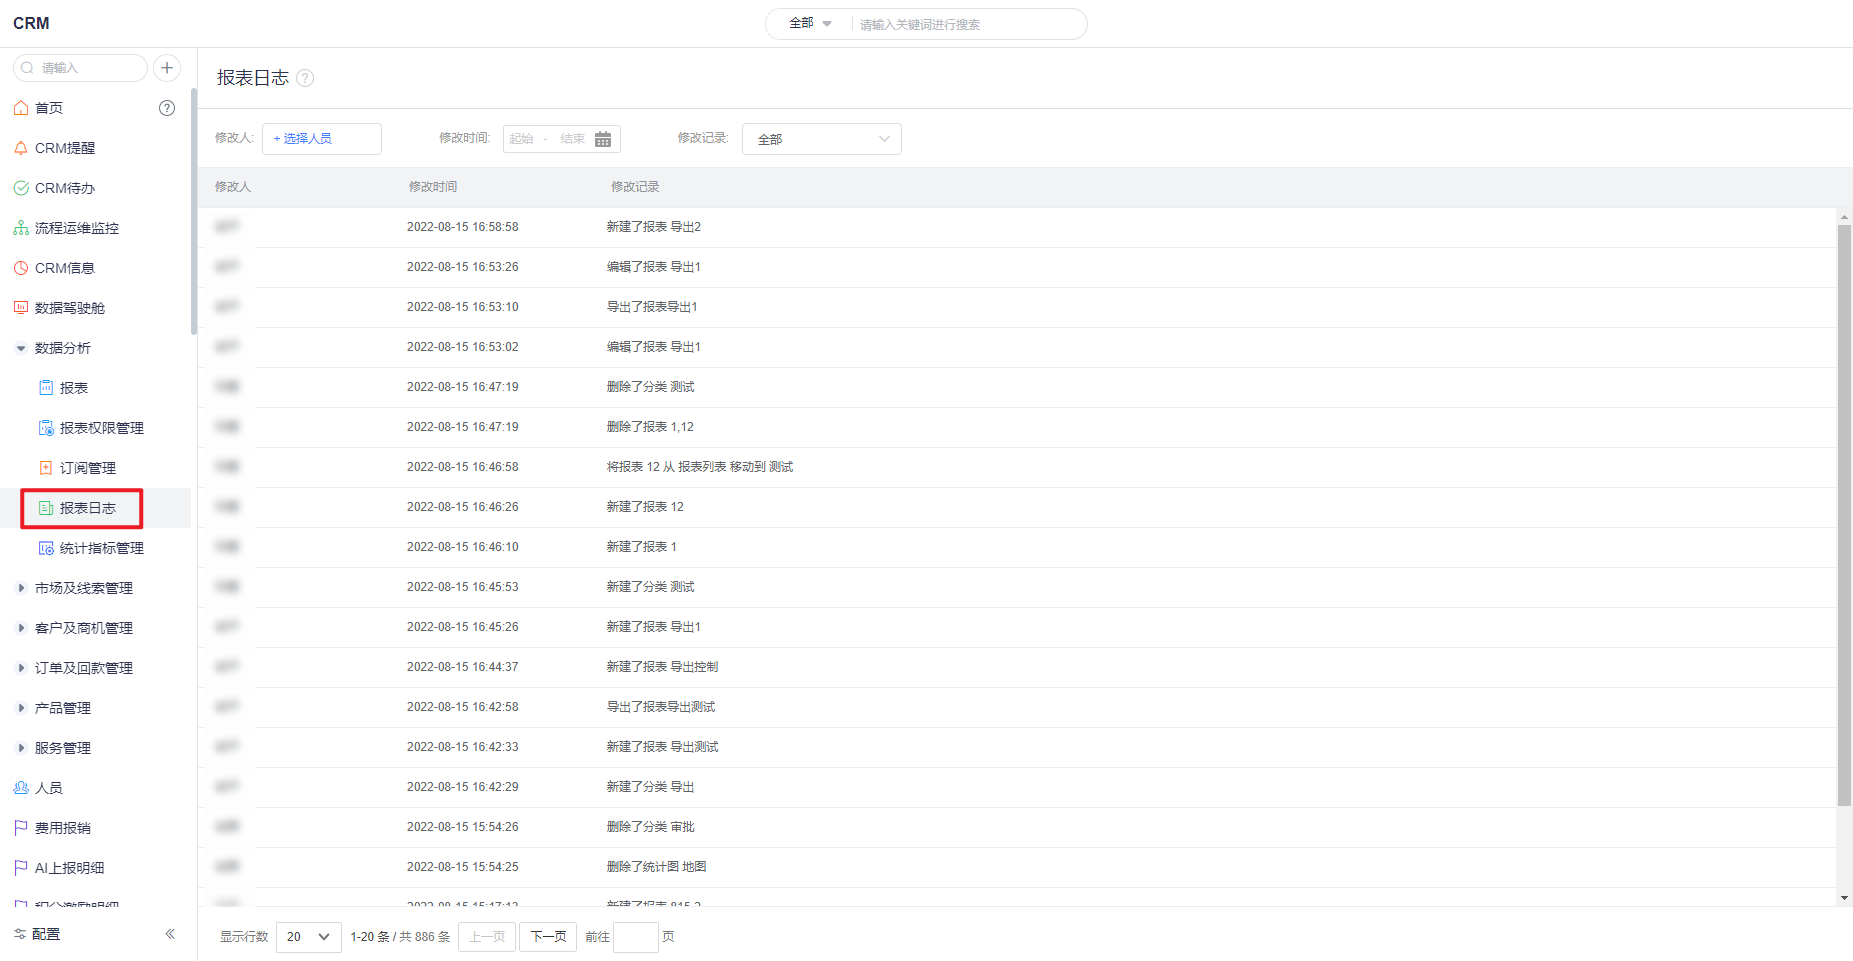
- The user's operation behavior can be queried according to the modification person, modification time, and modification record.
- Permissions: only visible to report administrators and CRM administrators
6. Measures Management
- Click Measures Management on the CRM navigation bar to enter the measures management page. You can create a new topic on this page, and click on a specific topic to create new measures, etc.
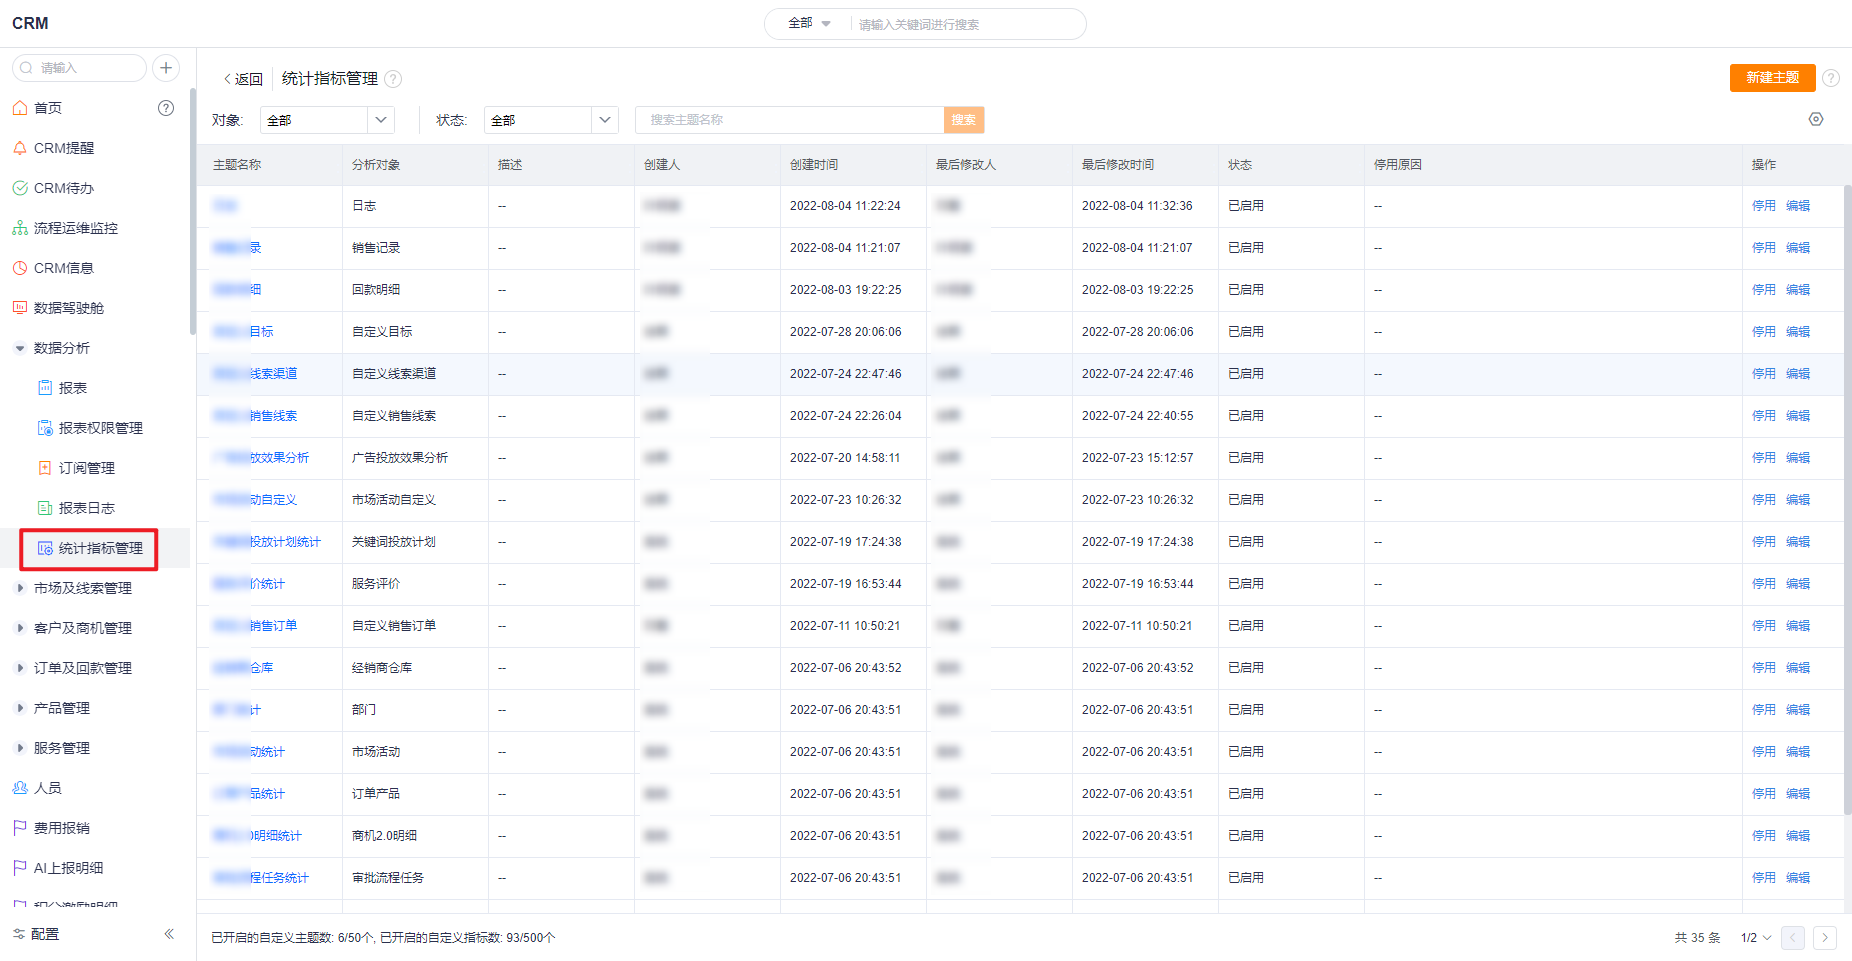
- Measures Management: For the related content of measures management, please refer to Measures Management