
1. Create Common Report
1.1 Select from Preset Templates
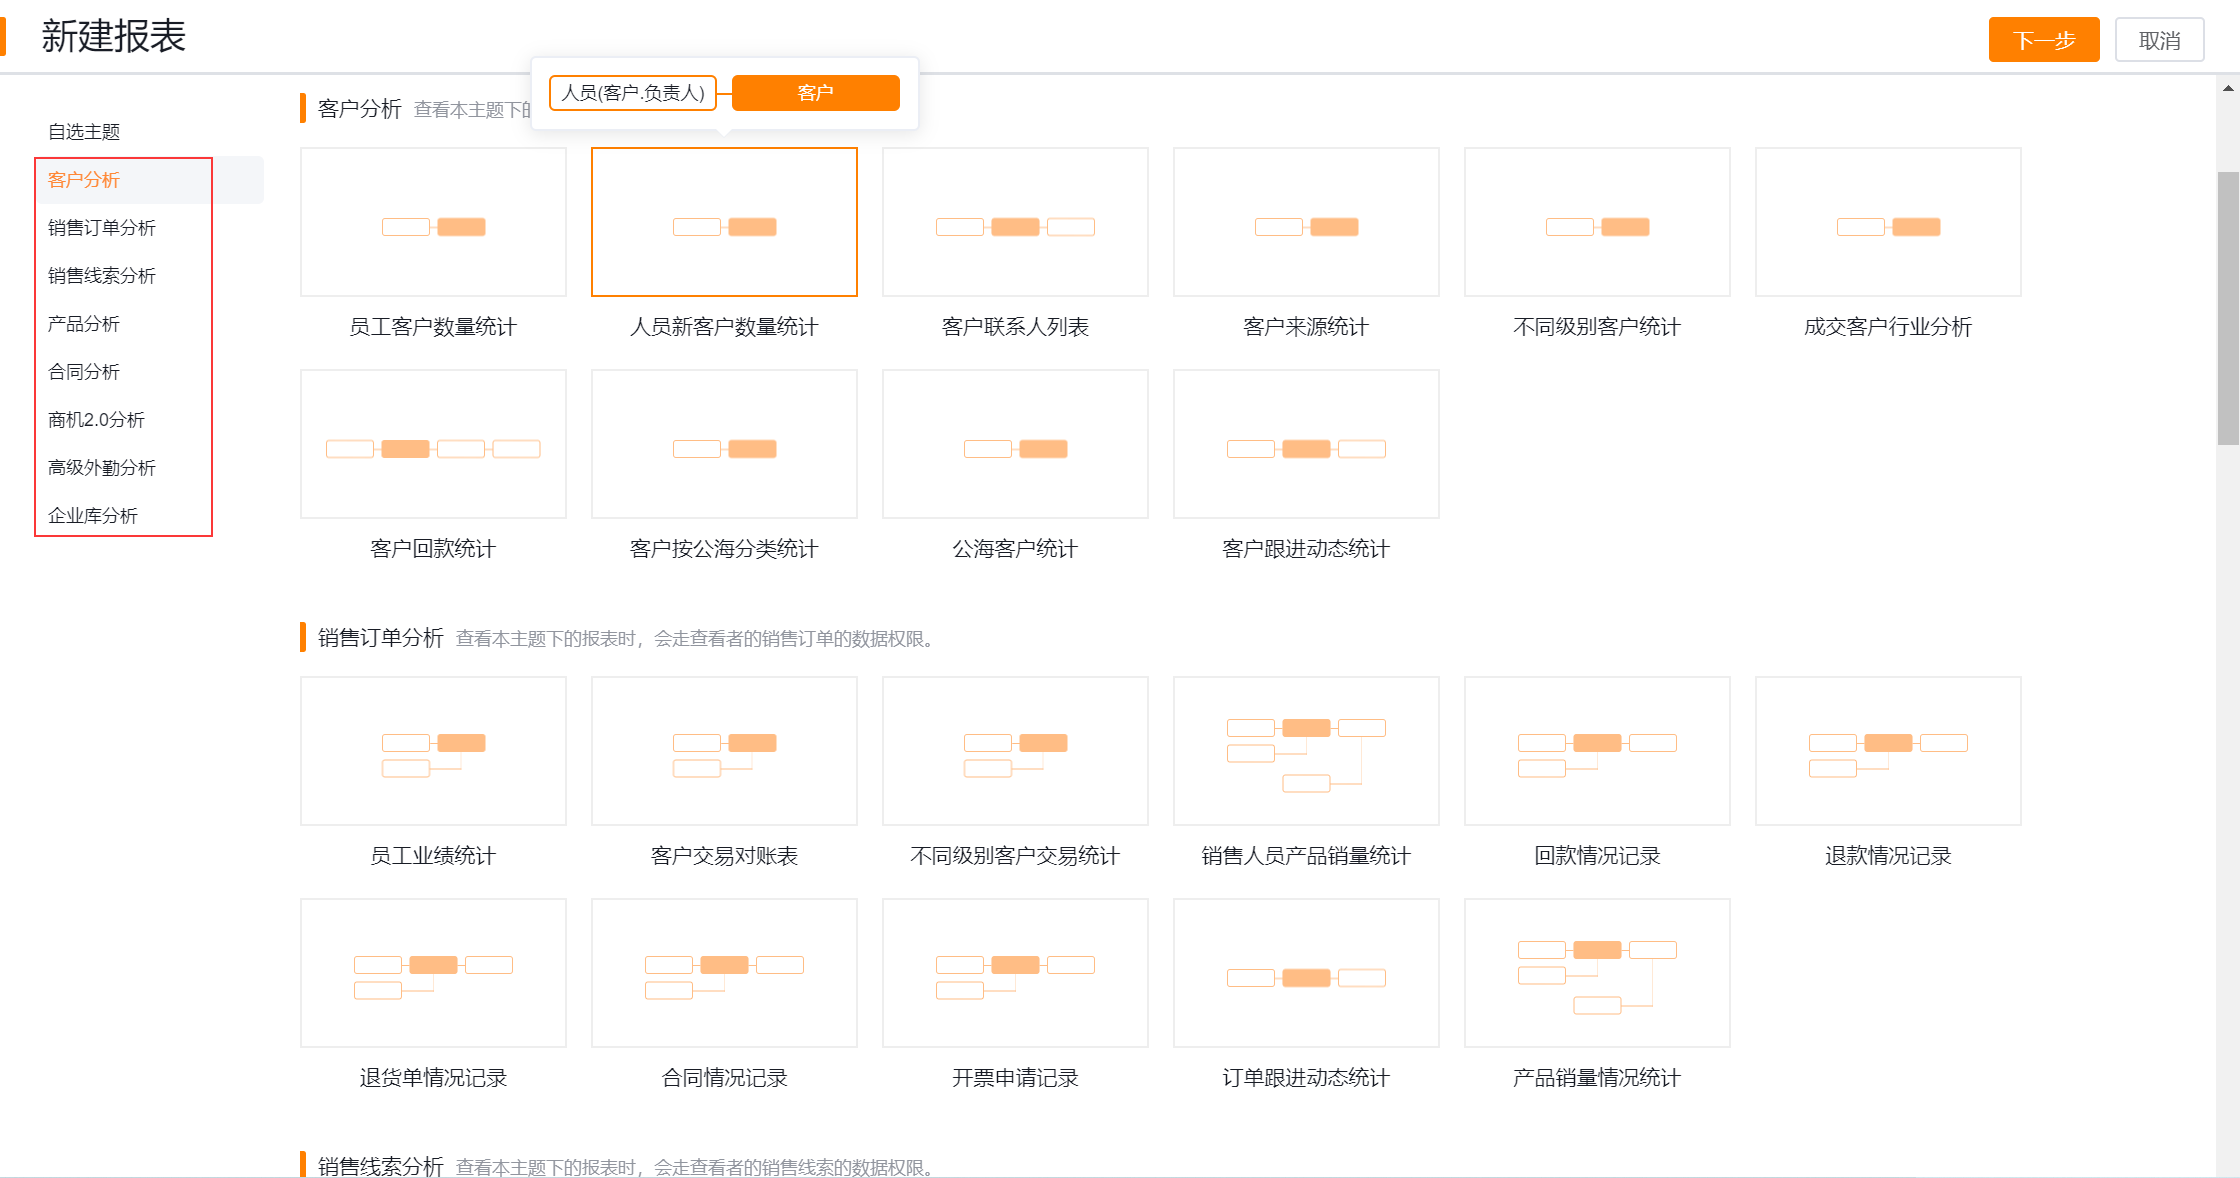
In order to quickly create a report, according to different business classifications in ShareCRM, 8 themes are preset, with a total of 51 templates. You can choose the appropriate template to create a report according to your actual needs. When the cursor slides to the corresponding preset template , the objects contained in the template will be displayed, among which the solid ones are the main objects, and the hollow ones are the associated objects. You can select the fields required by the corresponding report from these objects in the template.
- Template Description: All reports are based on a business subject domain, such as "account analysis", which focuses on analyzing accounts, including statistics on the number of new accounts for analysts, statistics on account sources, statistics on different levels of accounts, and other statistical reports around accounts.
- Use of Report Template: When you click New Report, the system will jump to the preset report template, and you need to select the subject field and report template according to the business scenario to create the report.
- New All Reports: Create a new report according to the latest report template of the system. If the report classification already exists, the creation fails. When you add the ShareCRM application, the system will create all reports for the company according to the system preset template by default, that is, the report classification and reports you see when you enter the "Report" menu for the first time, so you don't need to click here again.
1.2 Create from Blank Template
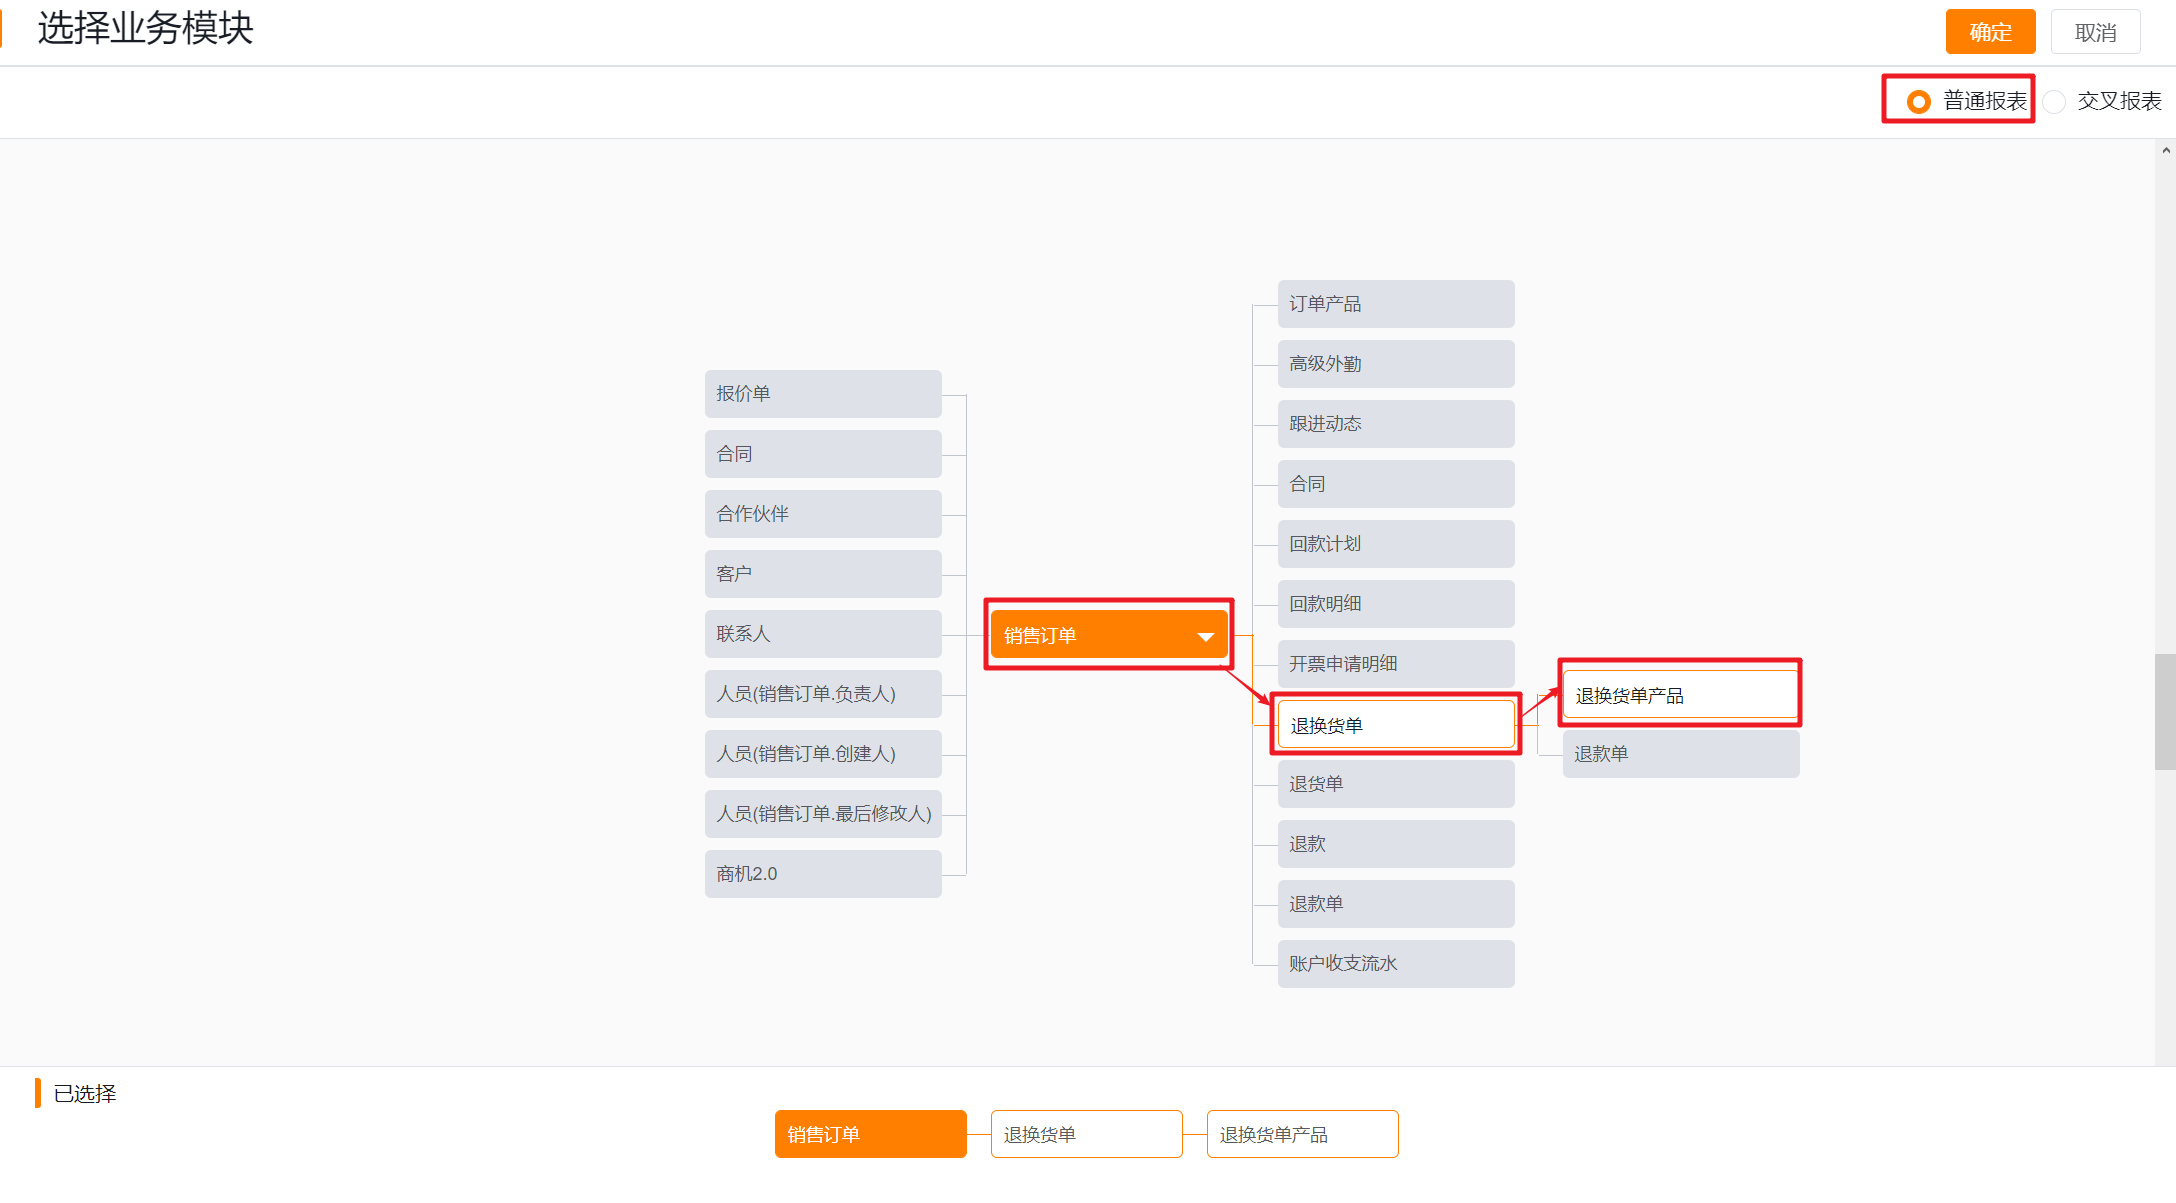
Enter from the new report, select a blank template, and then analyze the custom object. First, you need to select the main object. After the selection, its associated objects will be automatically brought out. You can customize the selection according to your needs.
- After selecting the desired object, click "OK" to enter the report design page, and then you can drag and drop fields as needed, set the data range, etc. to design the report.
2. Edit Common Report
2.1 Report Design
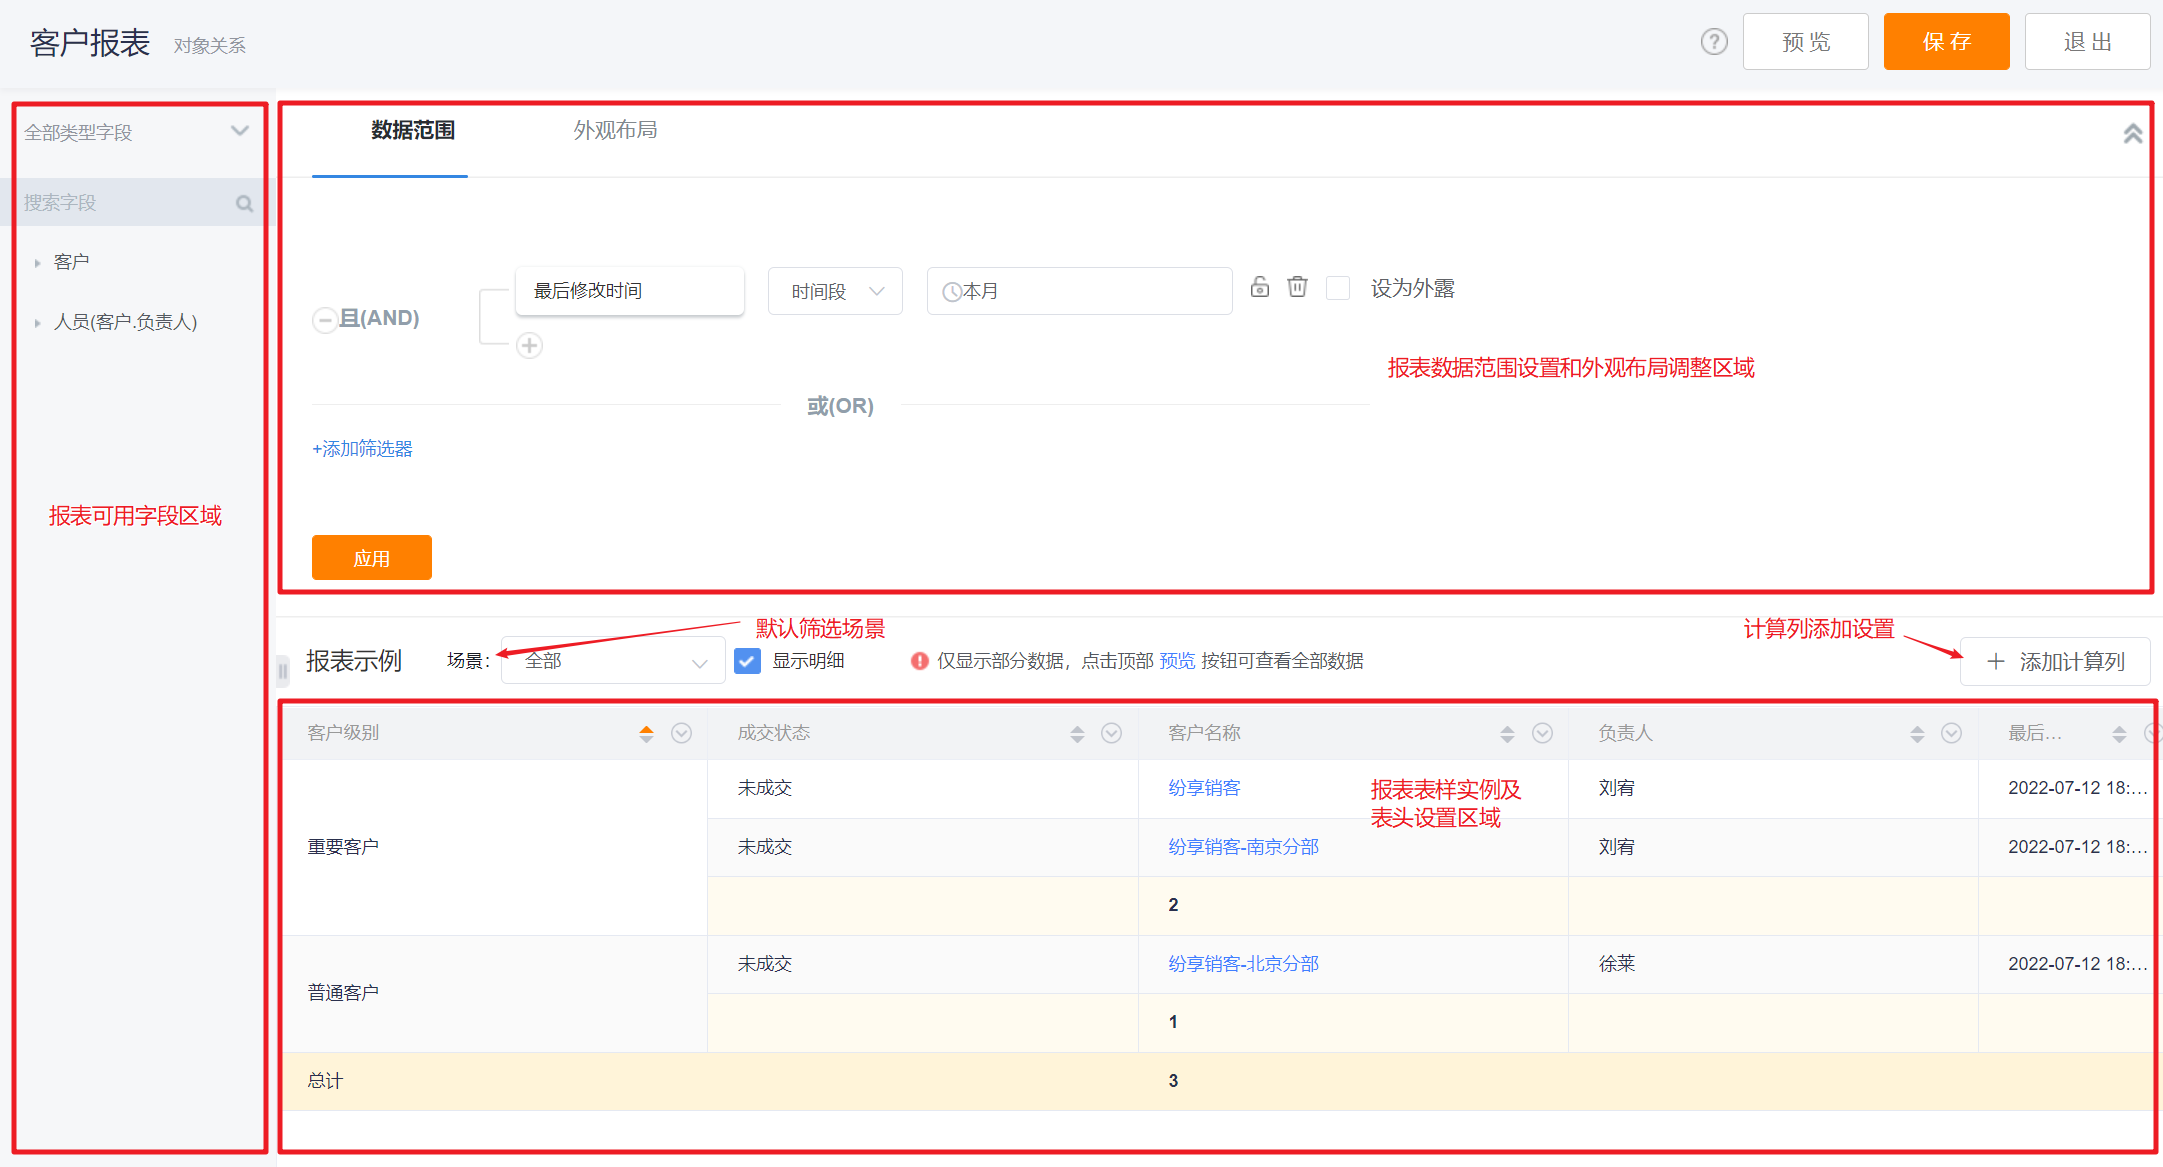
- Designer Layout:
- Left: The available field area, which varies according to the selected template, can be dragged to the right.
- Upper Right: data range setting area, used to set the filter conditions of the report.
- Middle Right:
- Scene: filter the scene (consistent with the preset scene of the CRM corresponding object), and specify the default scene of the report.
- Calculated column: perform operations on numeric fields in the report.
- Bottom Right: the report sample area, only a few pieces of data are used to display the sample (click the preview button to view all the data).
- Click on the table header to modify the field name, grouping, statistics, and sorting settings.
- Field Supplement in Report:
- Fields available for reports, including preset fields and custom fields on each business object.
- Field types currently supported for synchronization: custom fields (character, date, numeric, component), flexible types (calculated fields, statistical fields, reference fields), system preset fields (life state, main attribute, created people, etc.), special scenarios (multi-association, self-association, tree hierarchy, etc.). Among them, the picture field will be converted into the number of pictures in BI for statistics; the attachment field does not support display at the moment, and will be supported later, and it will also be converted into the number of attachments.
- BI does not support the field types displayed in the report: signature type.
- Custom fields can be synced in real time.
2.2 Field Selection
Report columns need to be selected when defining a report
- Field Source: When creating a new report, the system will ask you to select a subject field, and each subject field has preset and customized fields available for the report.
- Sorting: The sorting of all available fields in the field list is sorted by the first letter A-Z.
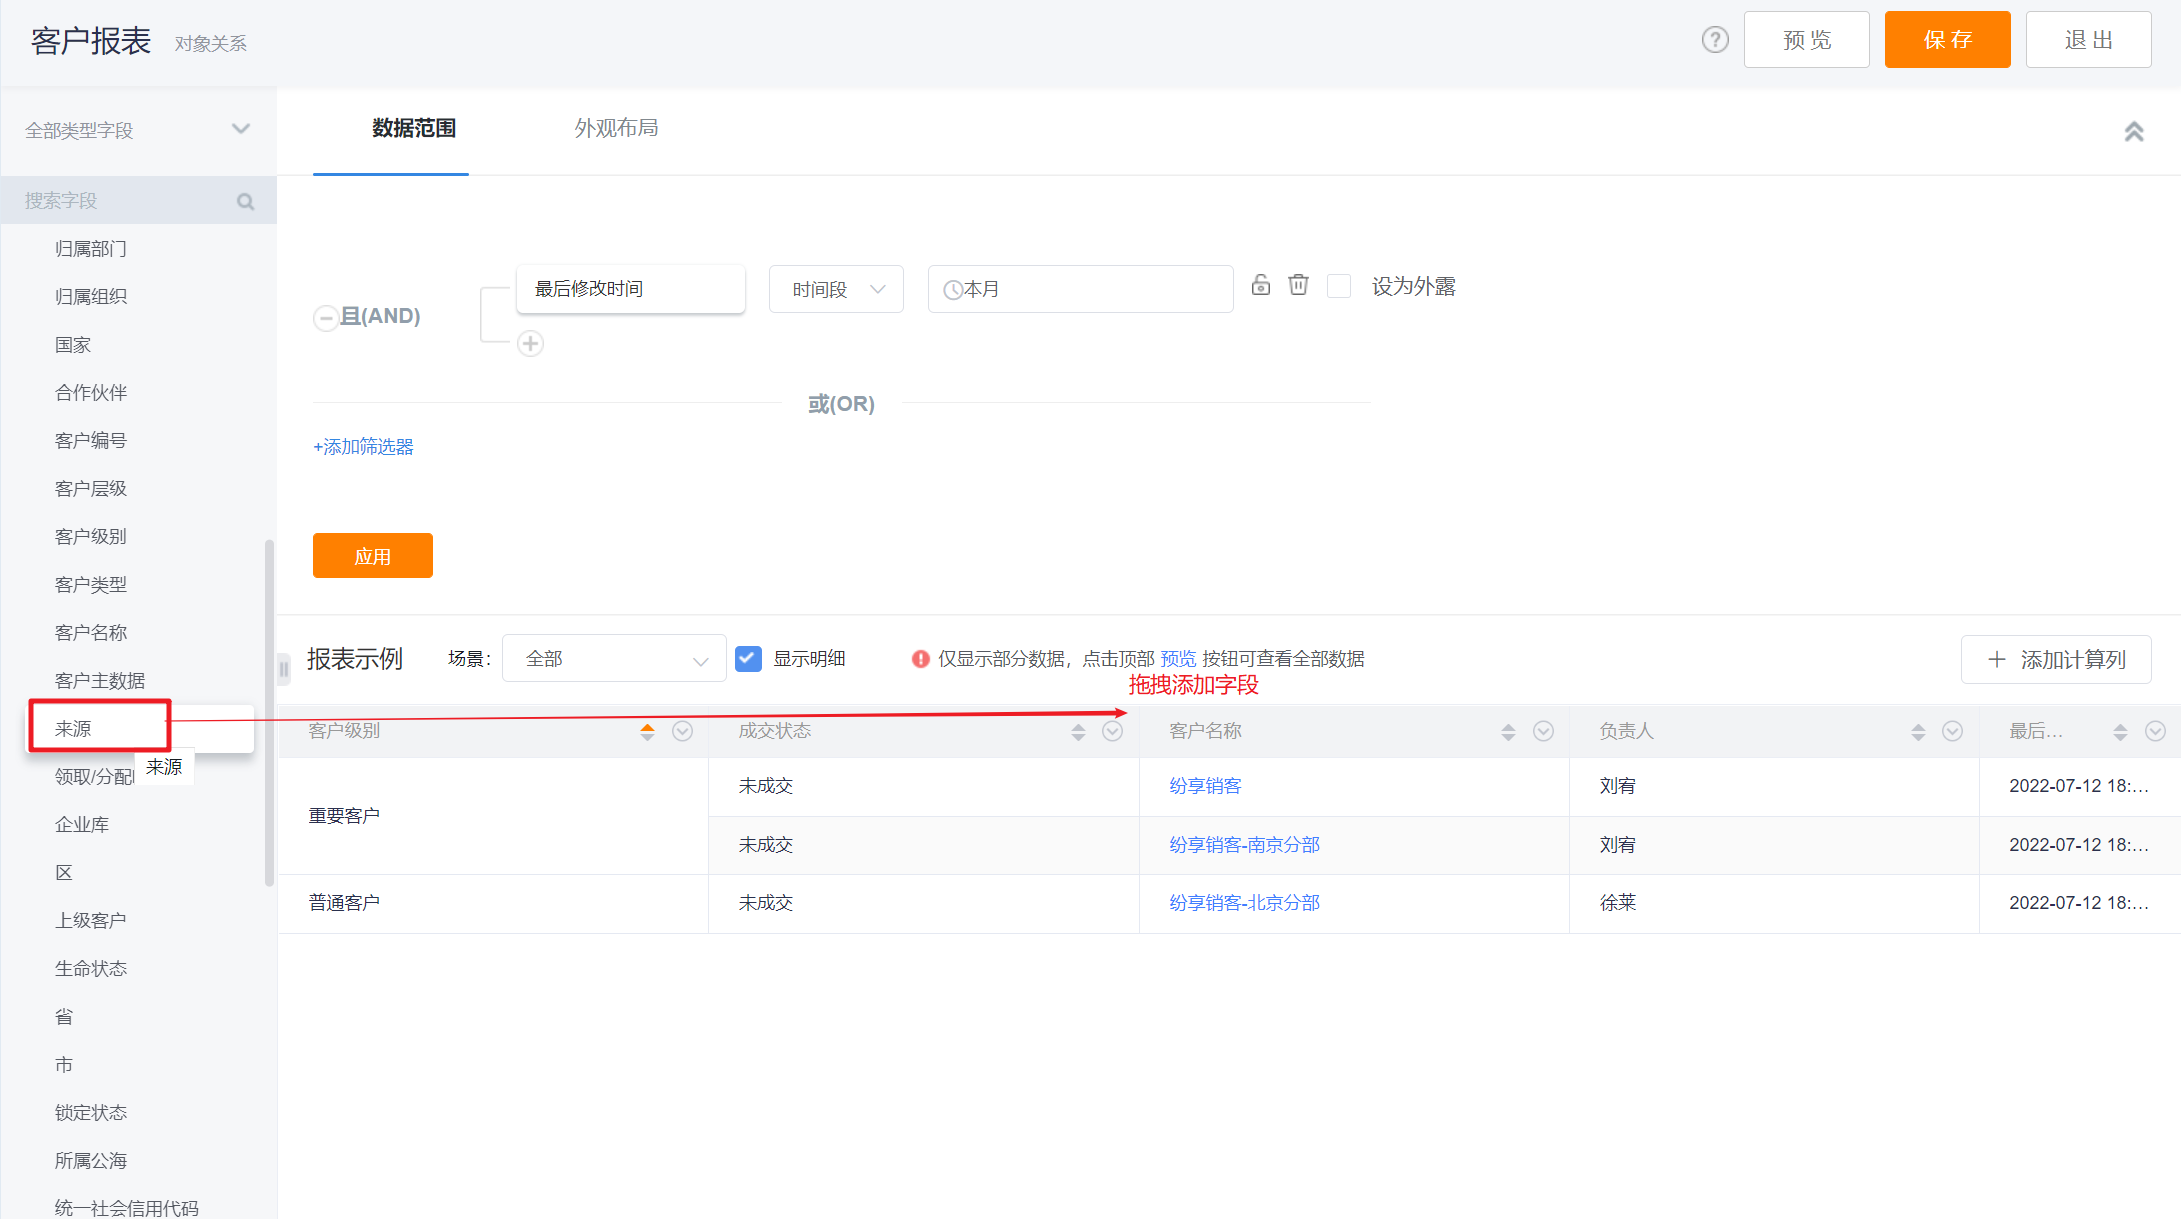
- Add Fields in Report: drag and drop to add, the new field will be added to the right of the column where the cursor is located.
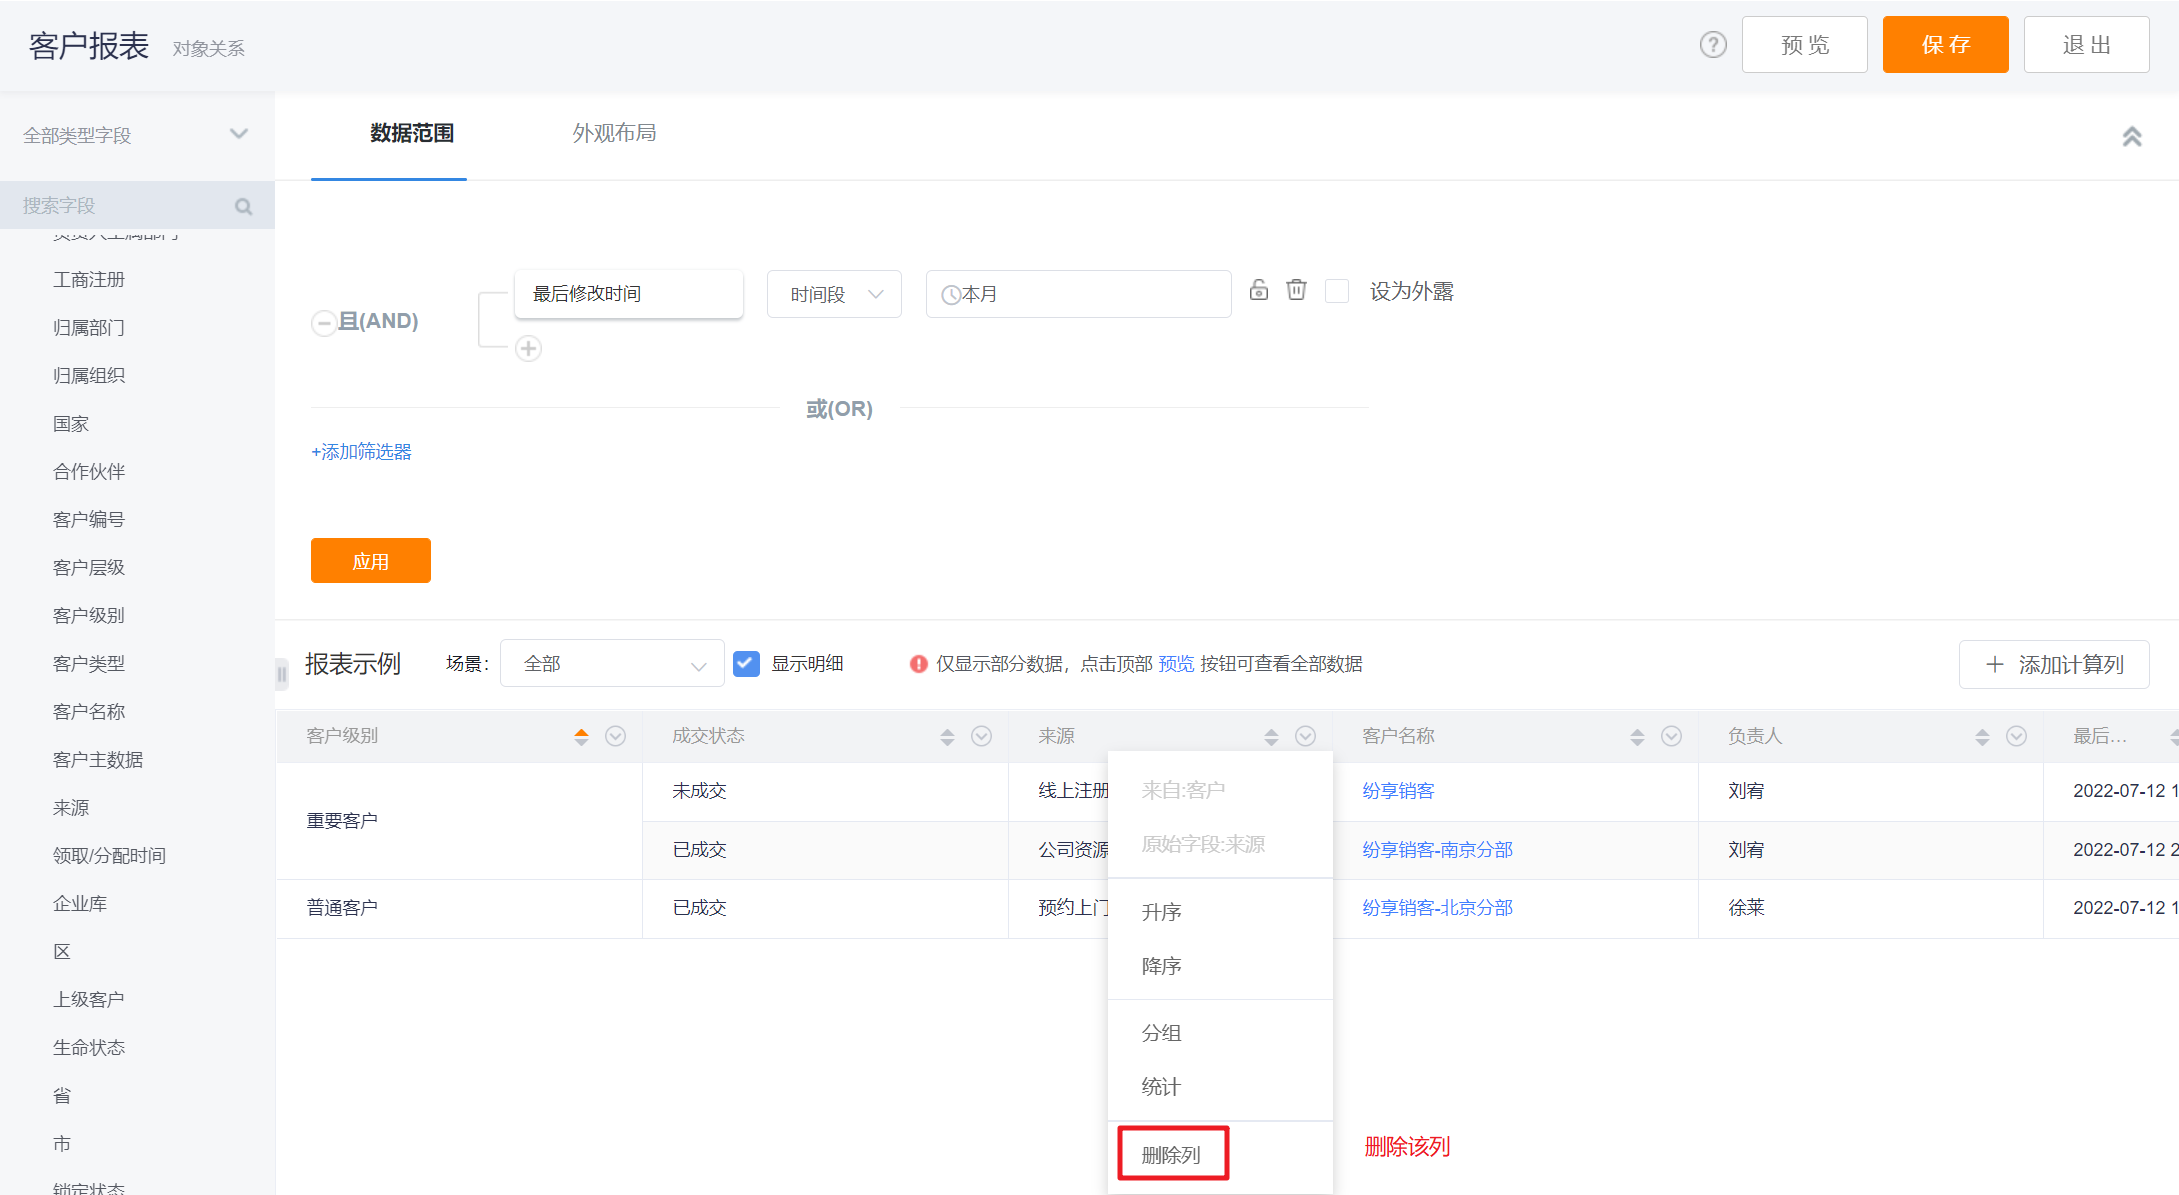
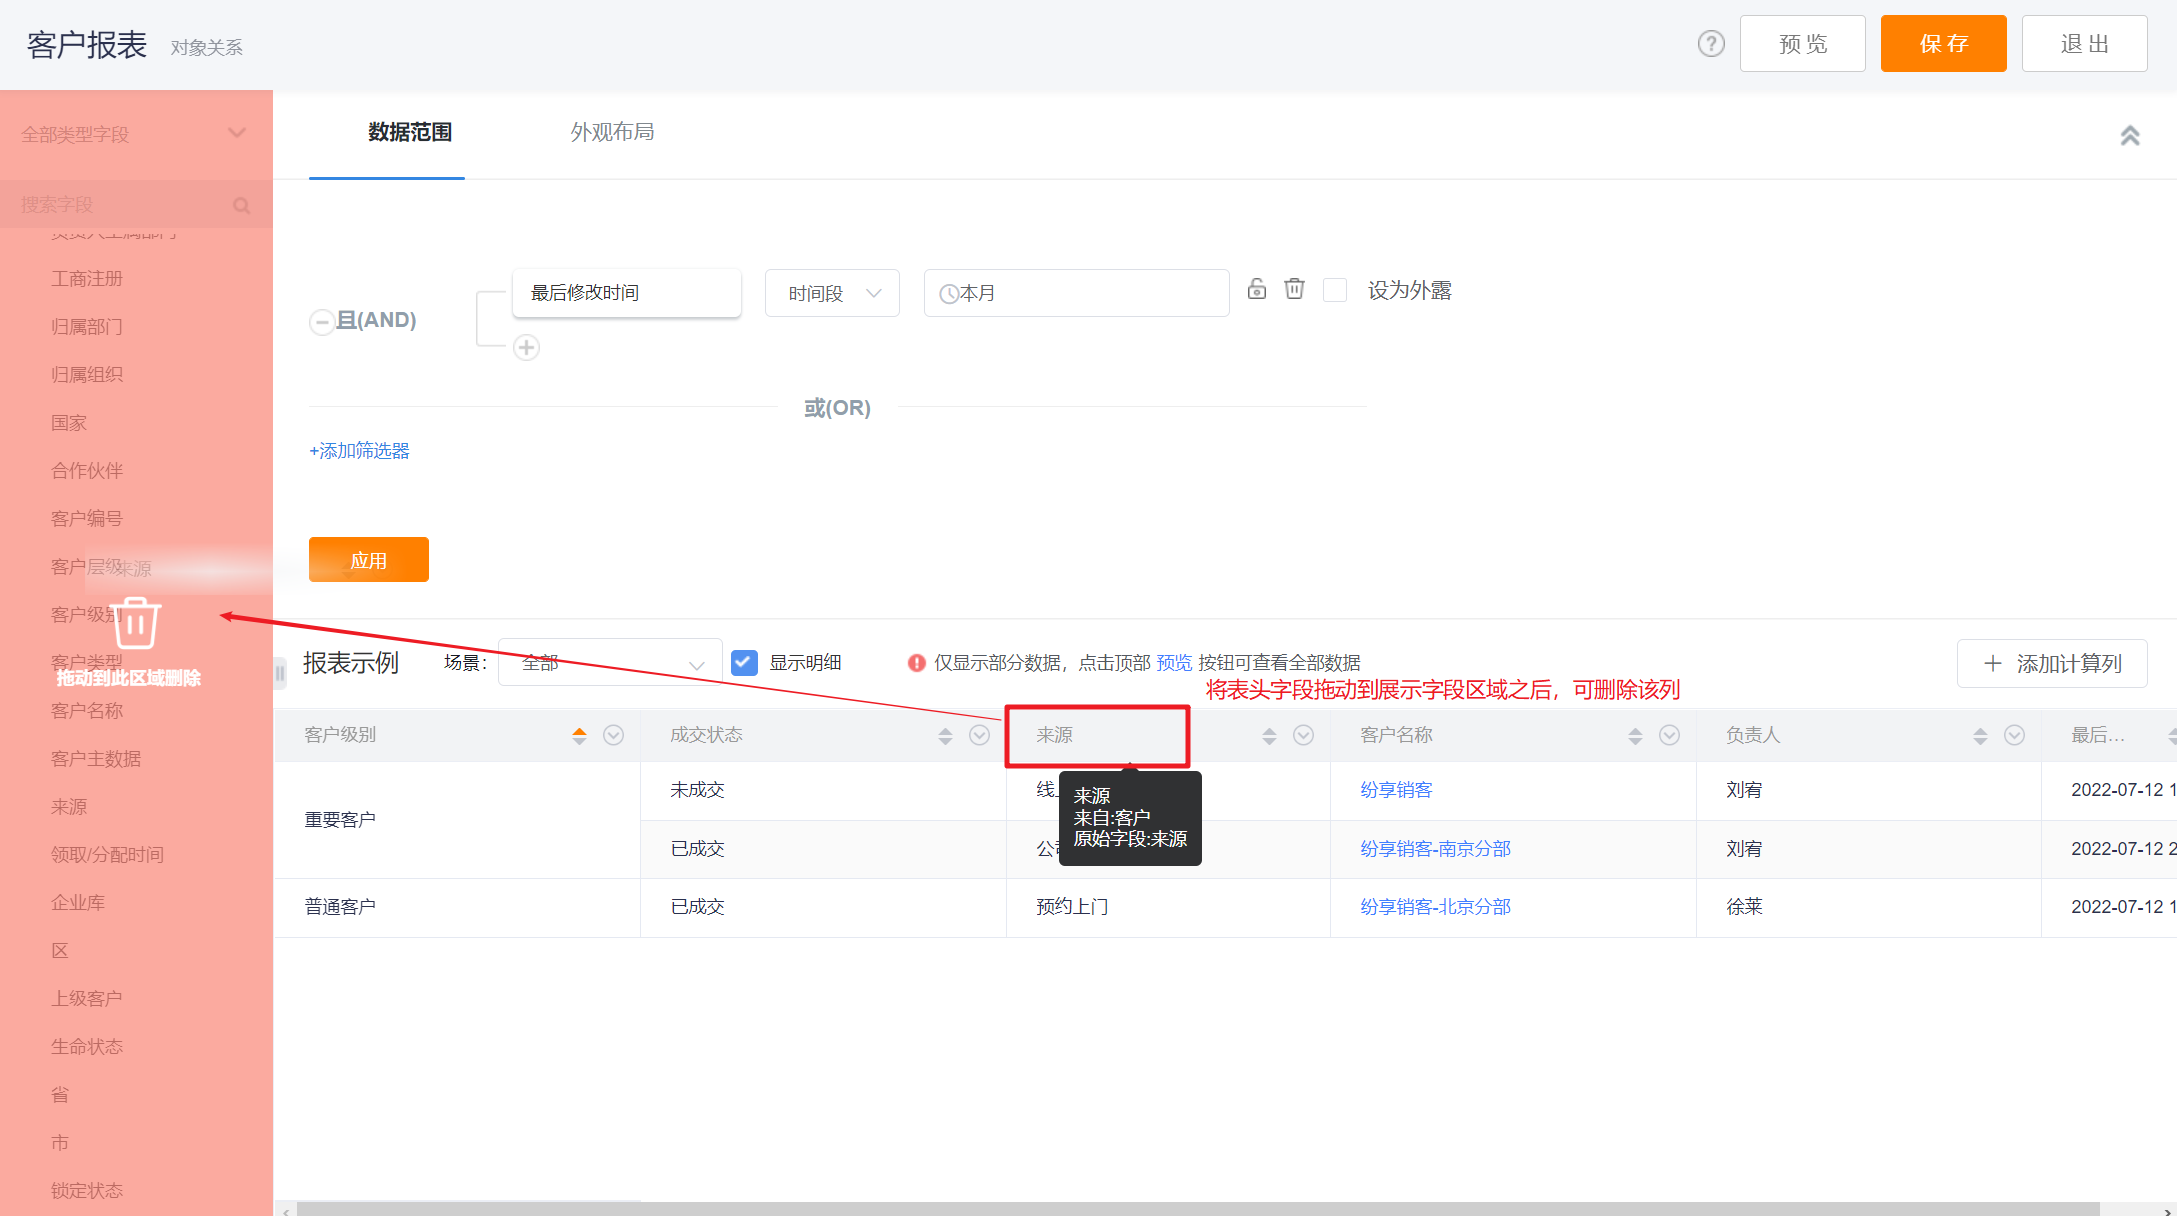
- Delete Fields in Report:
- First, you can choose the header drop-down-delete column;
- The second is to drag the field to the field list area, and click OK to delete.
- Adjust the order of the fields in the report: drag and drop to adjust, and the field will move to the right of the column where the cursor is located.
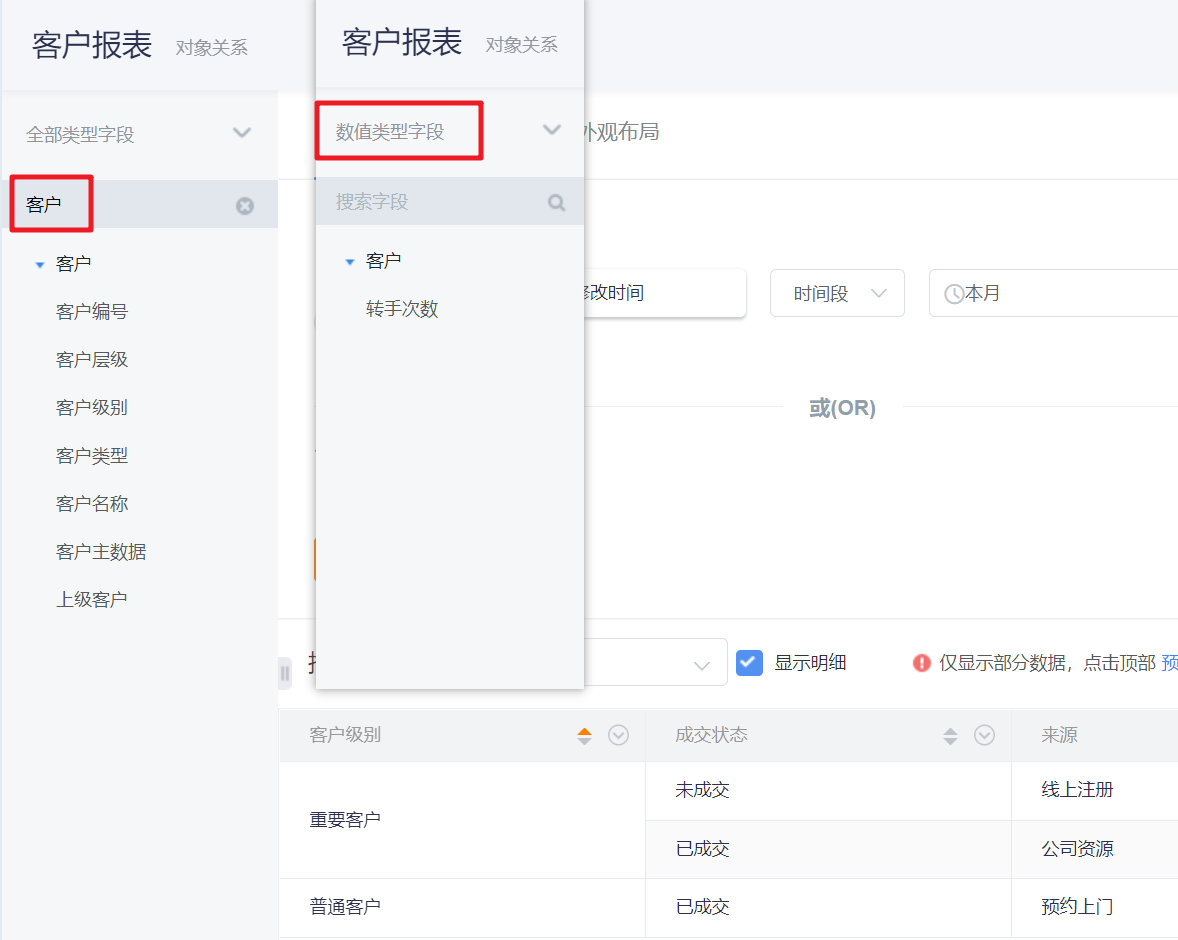
- Fields required for searching: In the optional area of the left field, you can classify by field type, or directly enter keywords for fuzzy query.
2.3 Field Settings
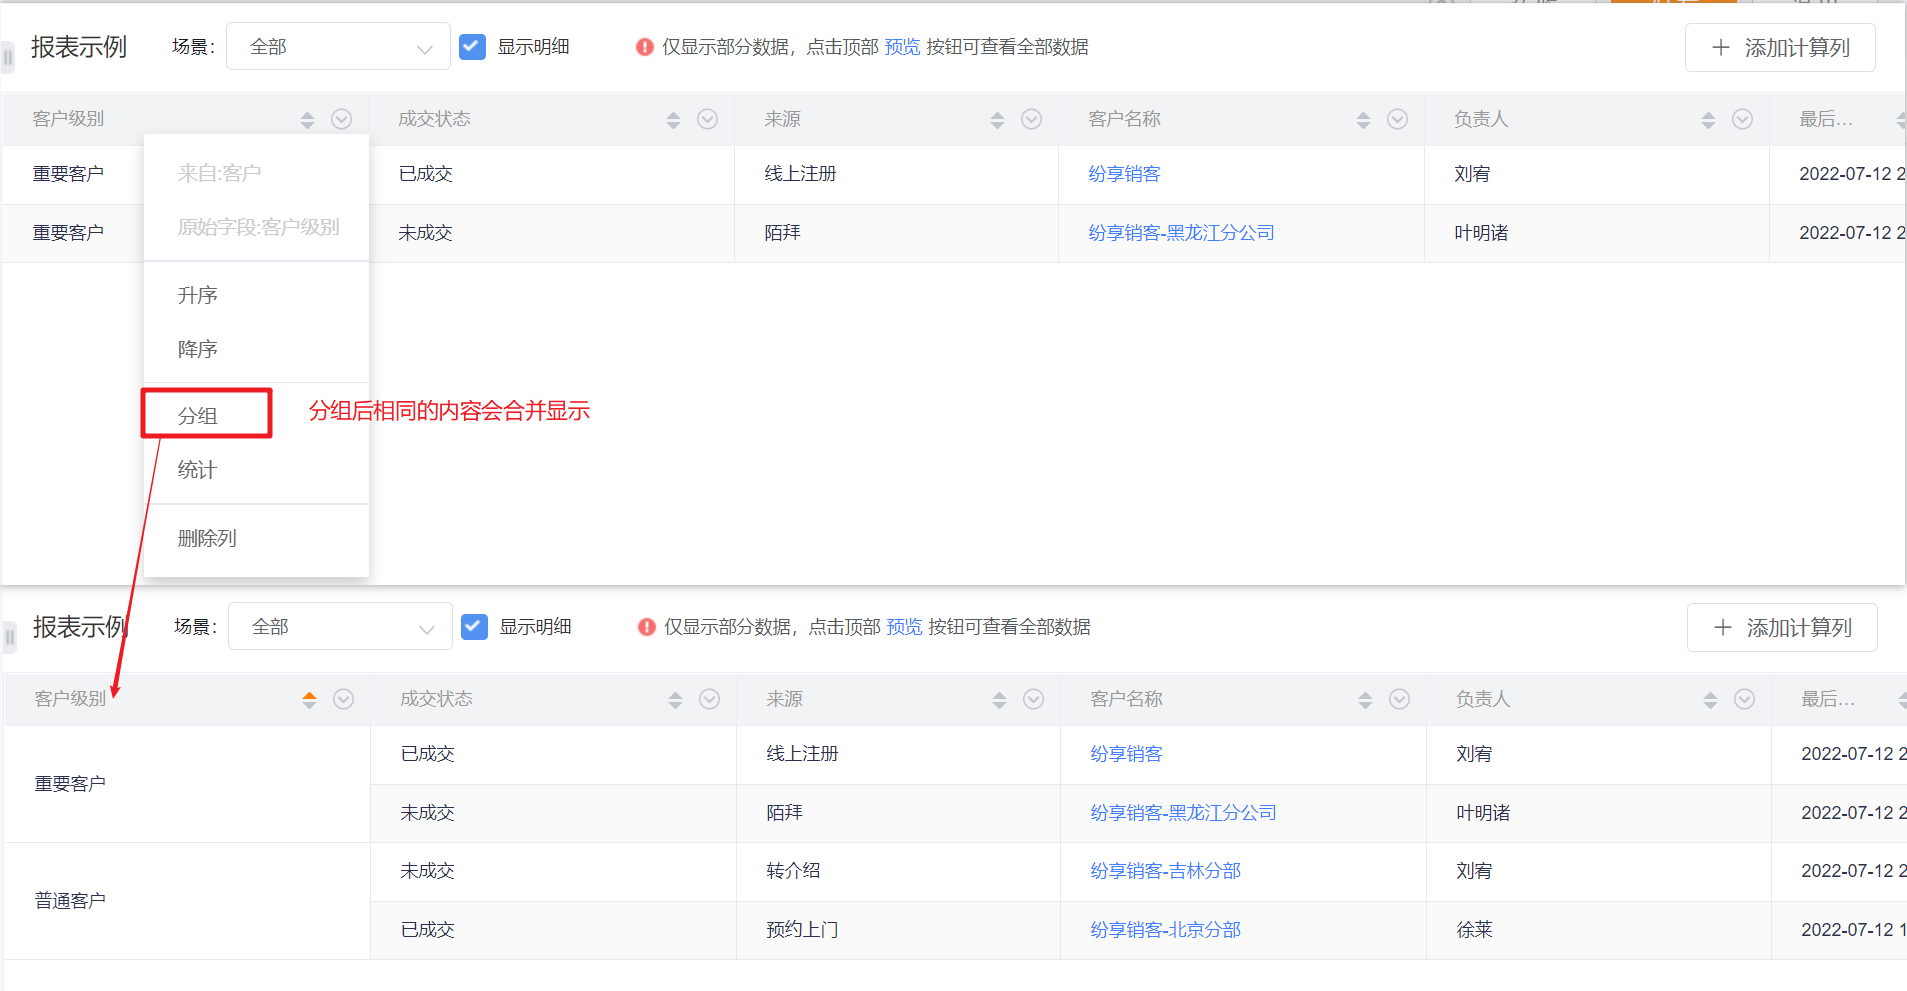
- Group: The drop-down setting of the table header will be combined and displayed after grouping.
- When there are multiple groups, the last set will be the next level group by default, and you can drag and drop the column header to adjust.
- Notes: Up to five layers of grouping are supported.
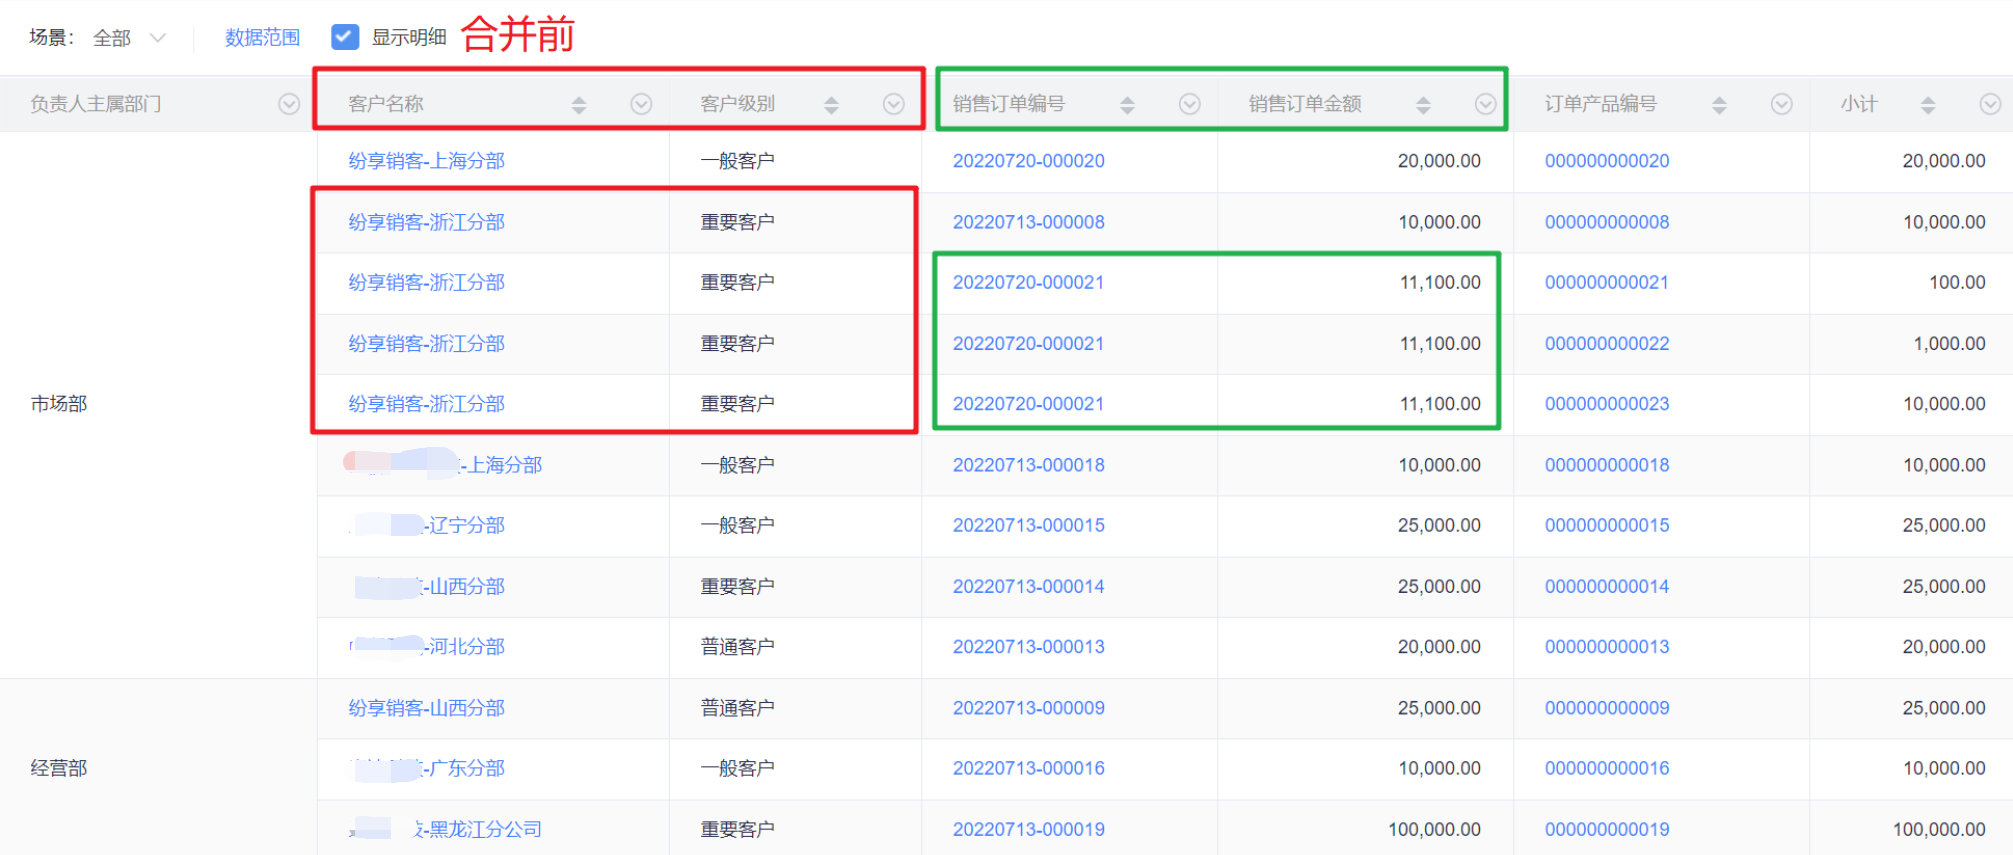
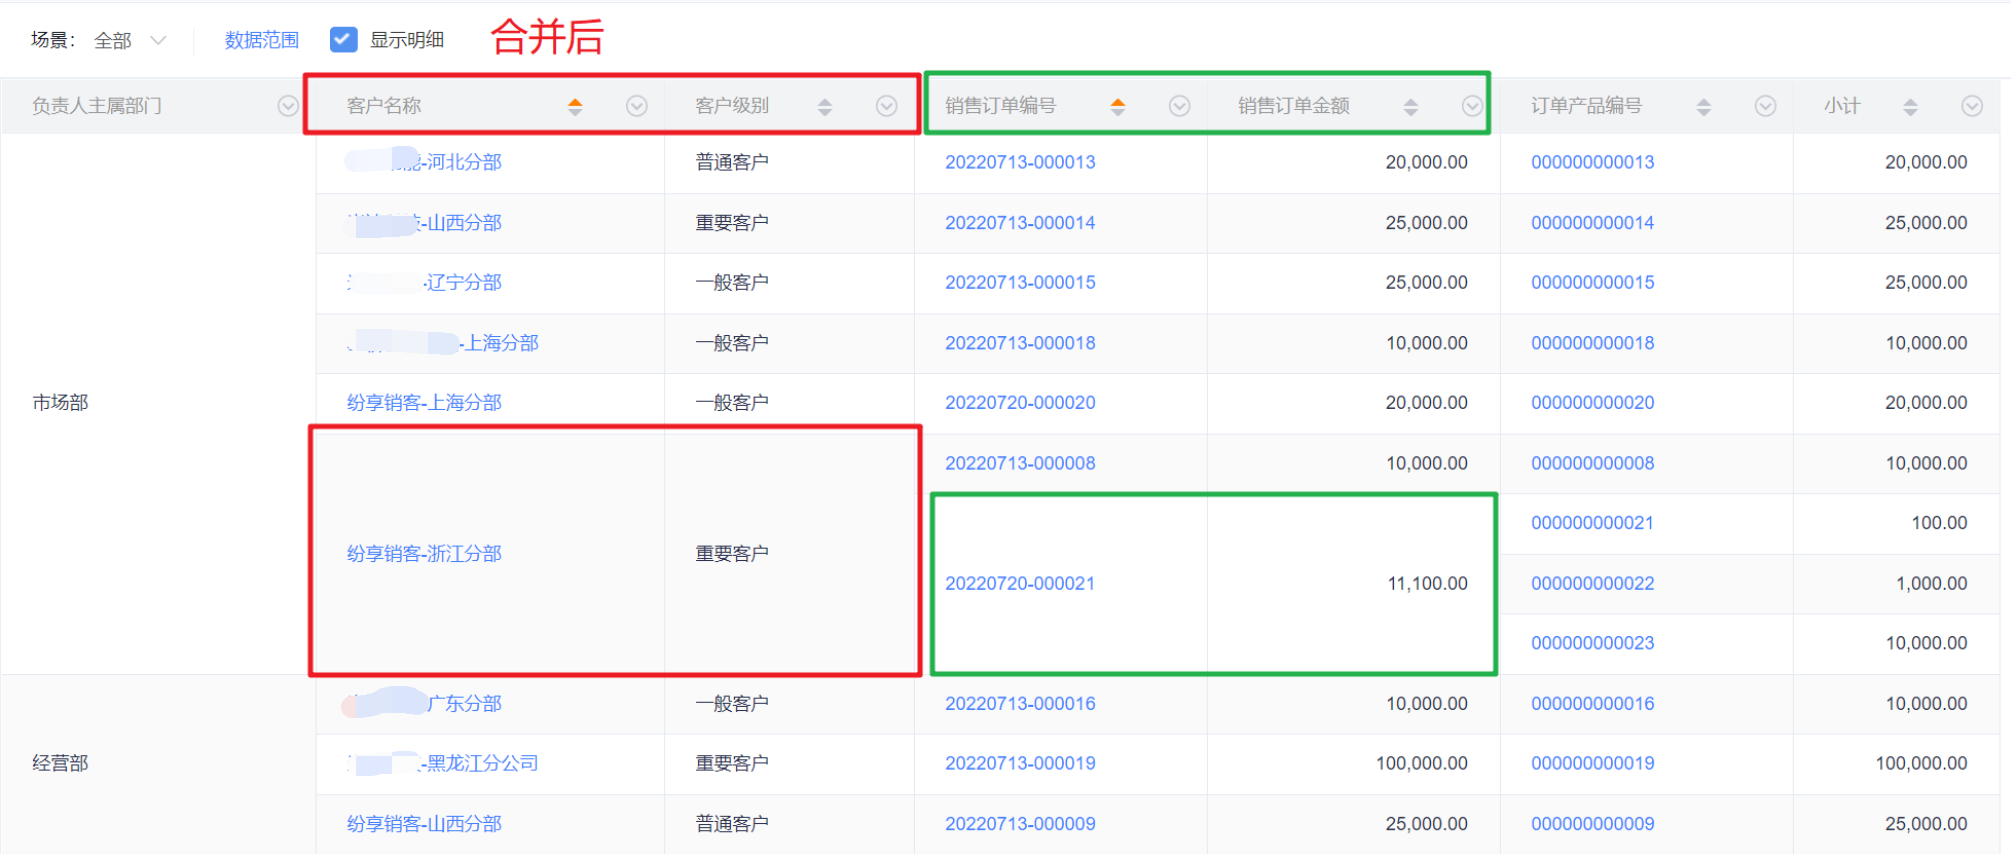
- Merge: When there are 1-party and multi-party objects analyzed at the same time in the report, multiple pieces of data from multiple parties will be displayed, resulting in repeated display of 1-party data. When this situation exists, edit the report, and select Merge in the drop-down list of 1-party main attributes , the same piece of data can be combined and displayed to make the table clearer and easier to understand (it can be understood as similar to merging cells in Excel)
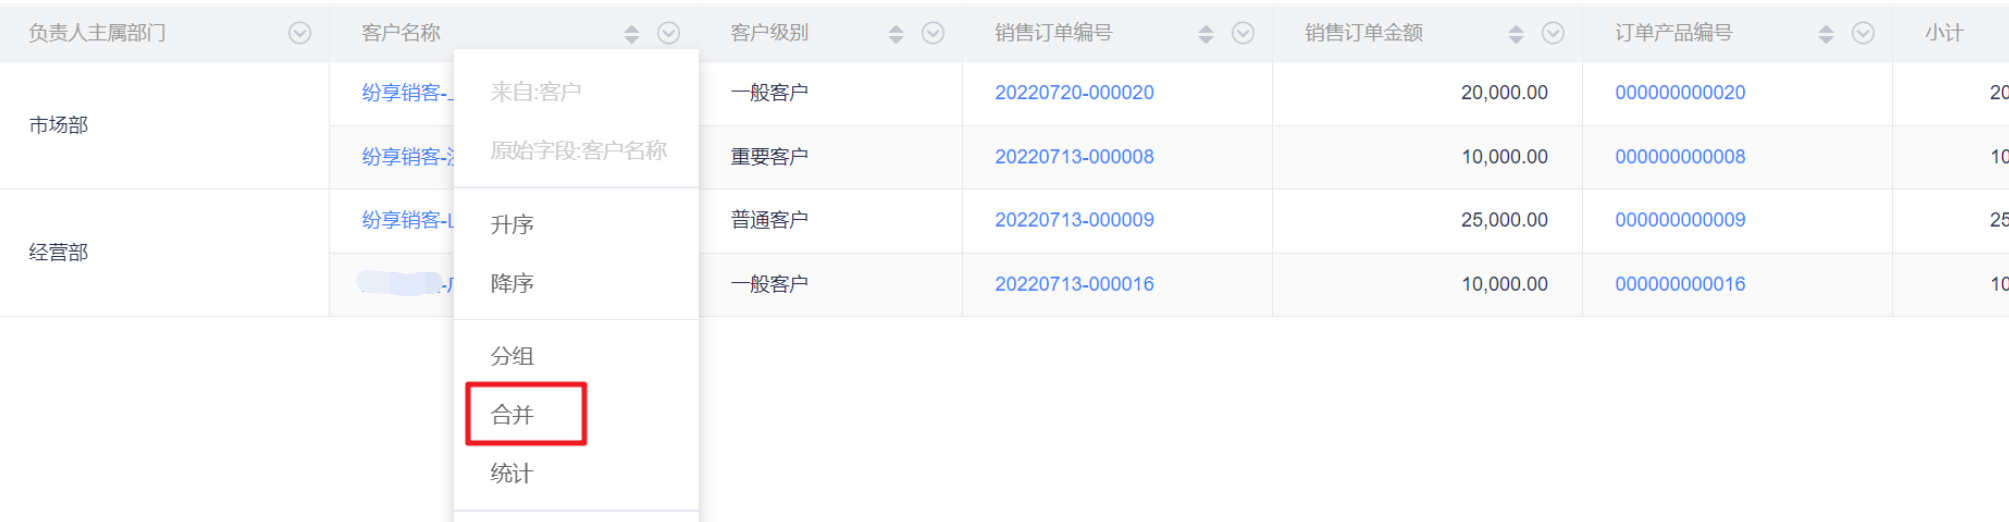
- Example: When accounts and orders are analyzed together, when a customer has multiple orders, the same account will be displayed repeatedly. Similarly, when an order has multiple order products, the same order will be displayed repeatedly; when configuring the report, you can In the drop-down operation of the account name, select the merge operation, then the field data of the same account will be displayed as one merged cell. Similarly, if you select merge in the order number drop-down of the order, the same order will be merged and displayed as one
- Group and merge are two relatively similar field processing methods. The differences and connections are as follows:
| Differences | Group | Merge |
| Solving Scene | Group data with the same value, further based on group statistics (sums, counts, etc.) | When there is a one-to-many relationship, only the same piece of data is displayed in a merged cell |
| Operation Entry | any field | Only "one" type fields of "one-to-many" can be merged |
| Same Data | Same value but different data ID will also be grouped | Values are the same but data IDs are different and will not be merged |
| Statistics Row (Sub-total, Total) | After grouping, the statistical field will increase | no stat line |
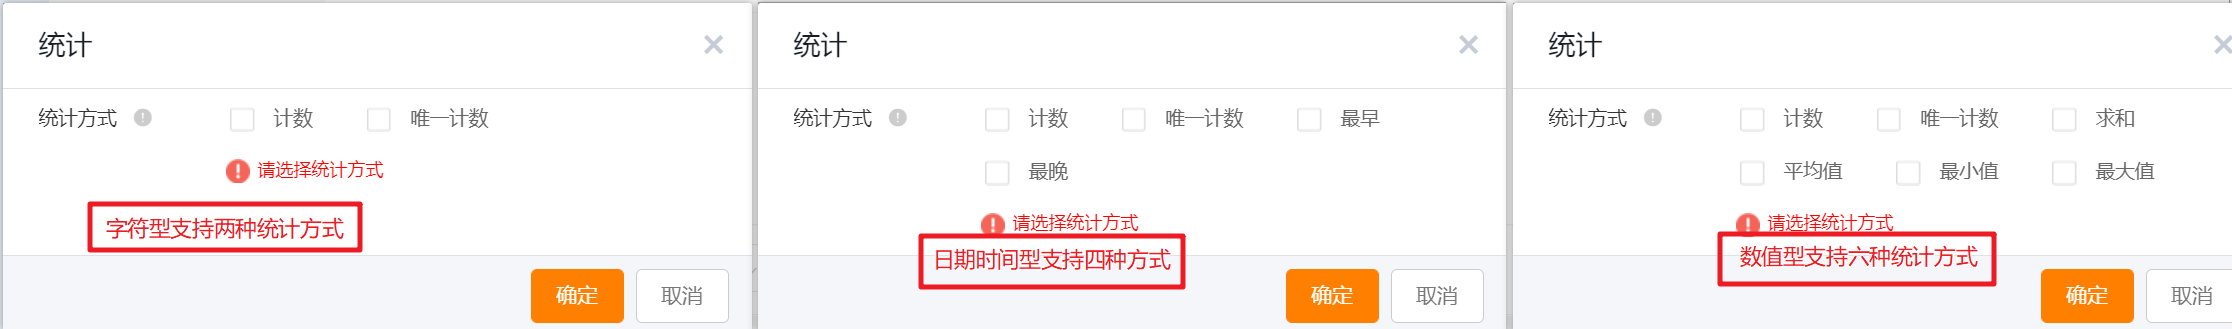
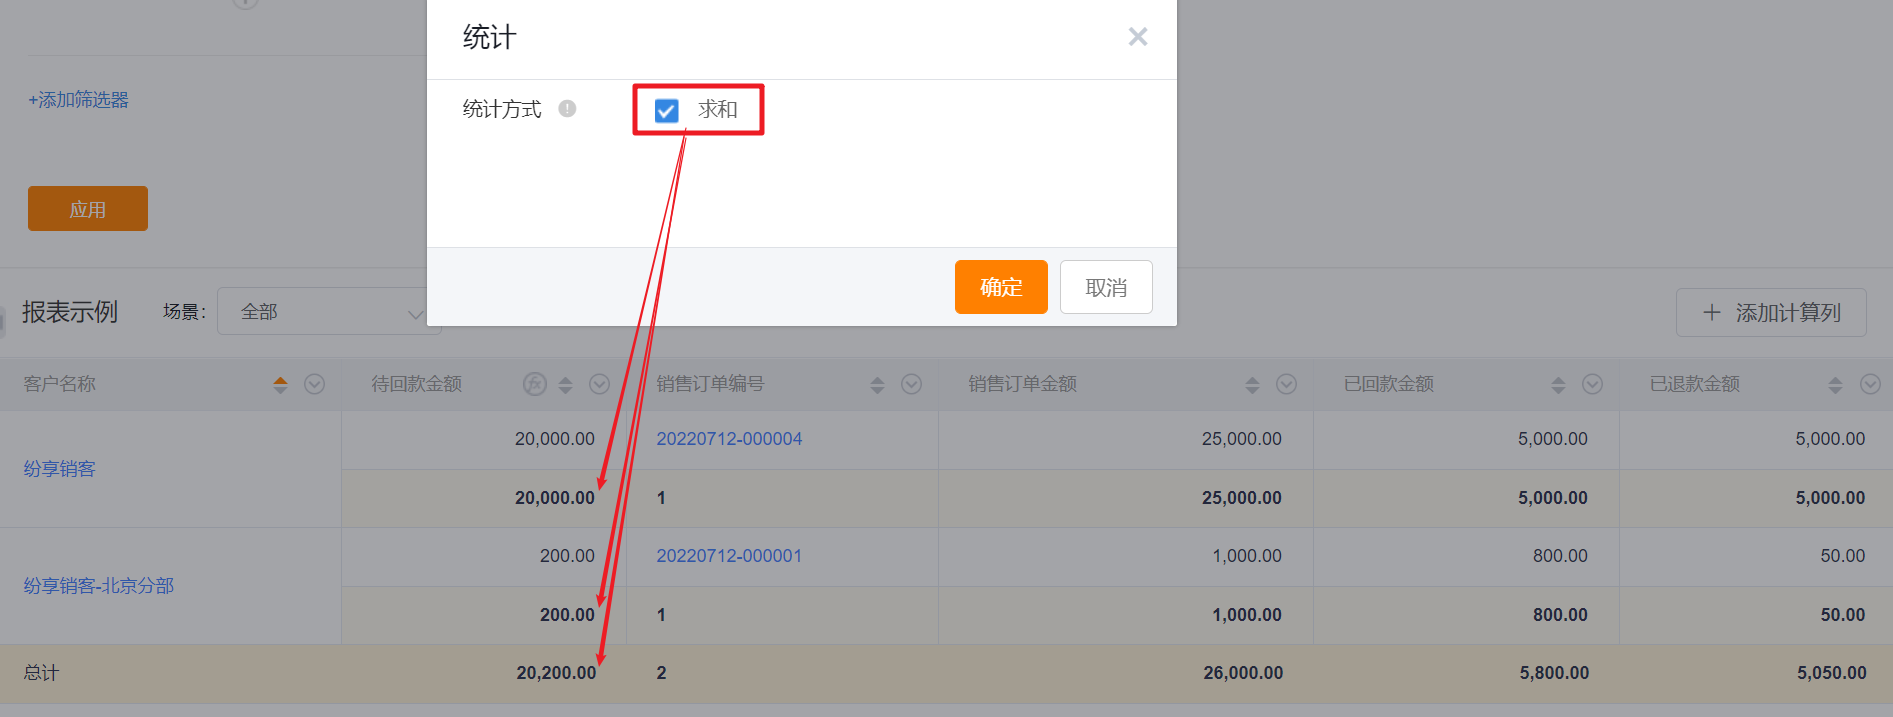
- Statistics: The drop-down setting of the table header will perform summary statistics according to grouping and layer by layer.
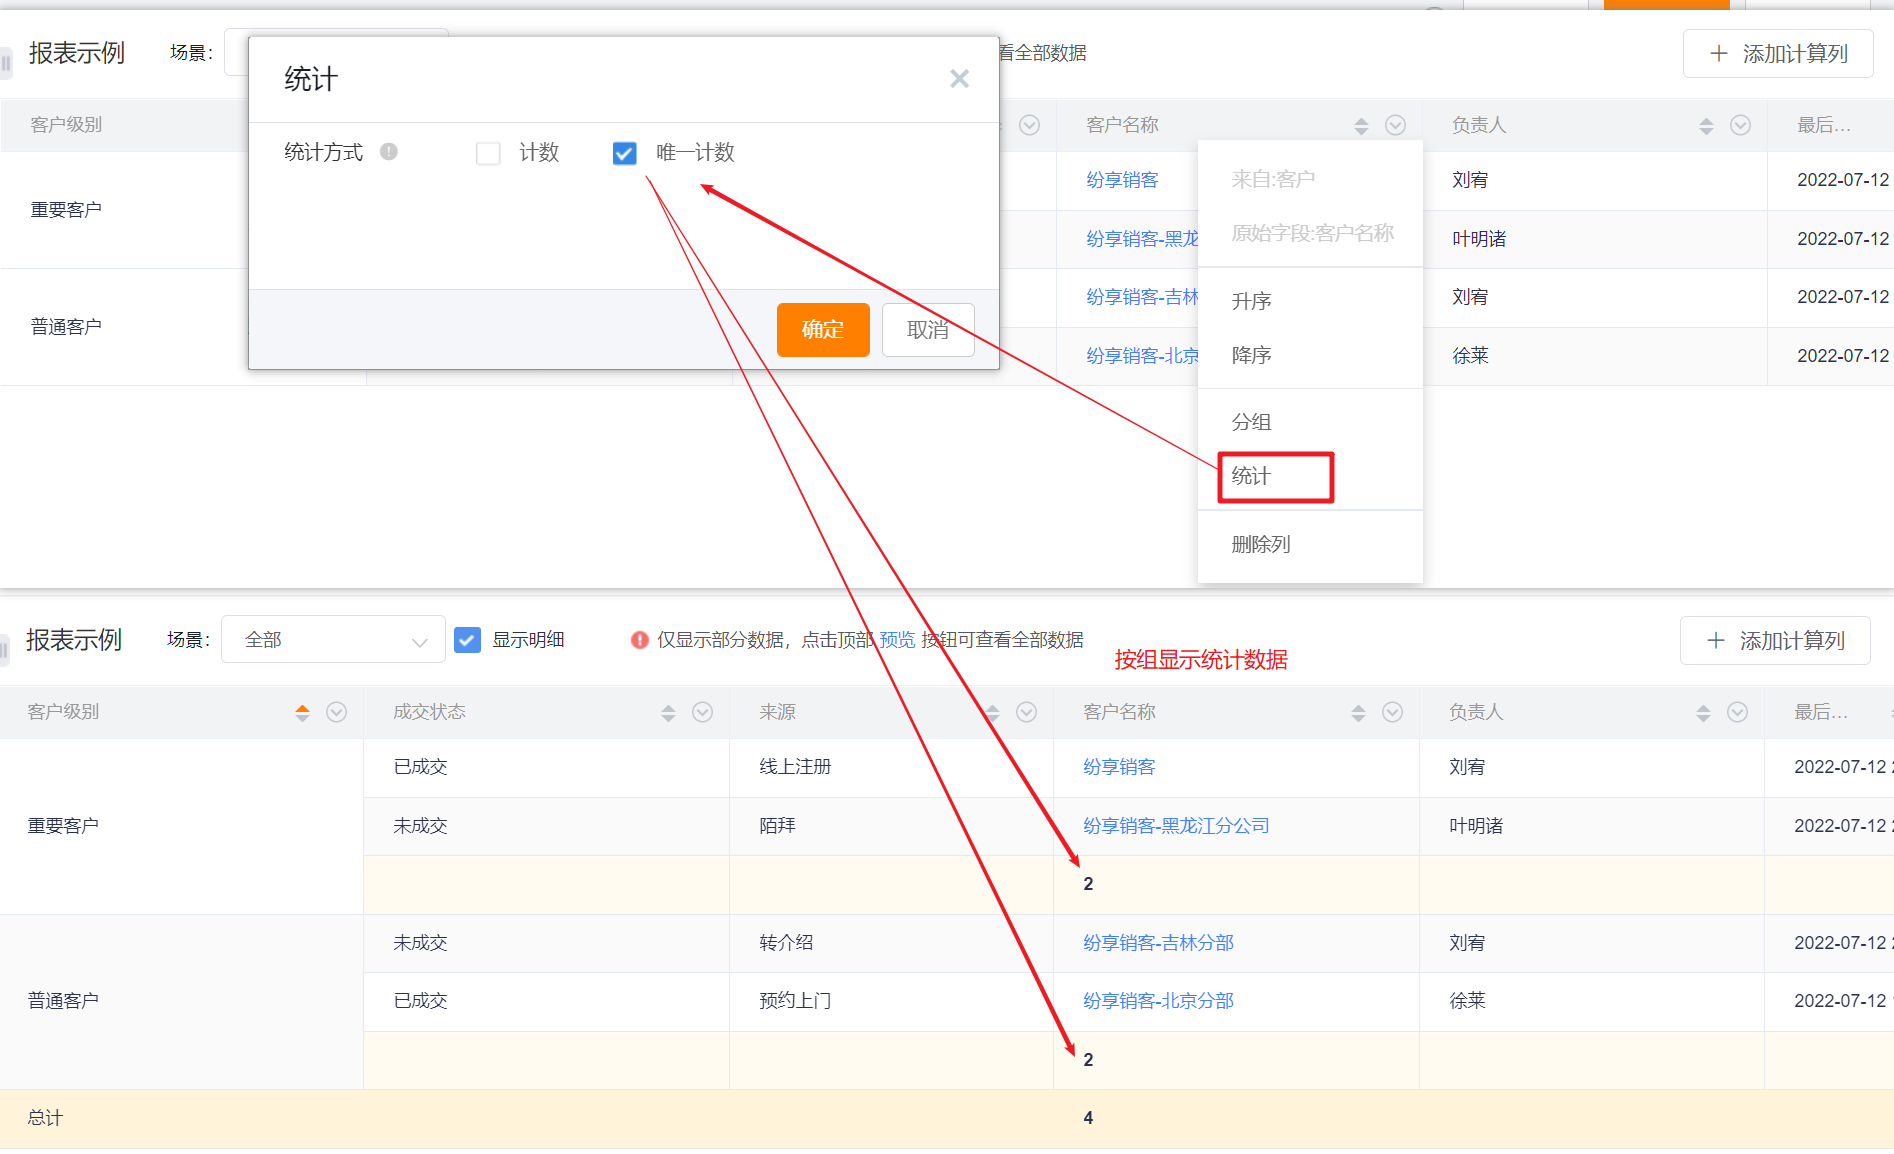
- Different statistical methods can be set according to different field types
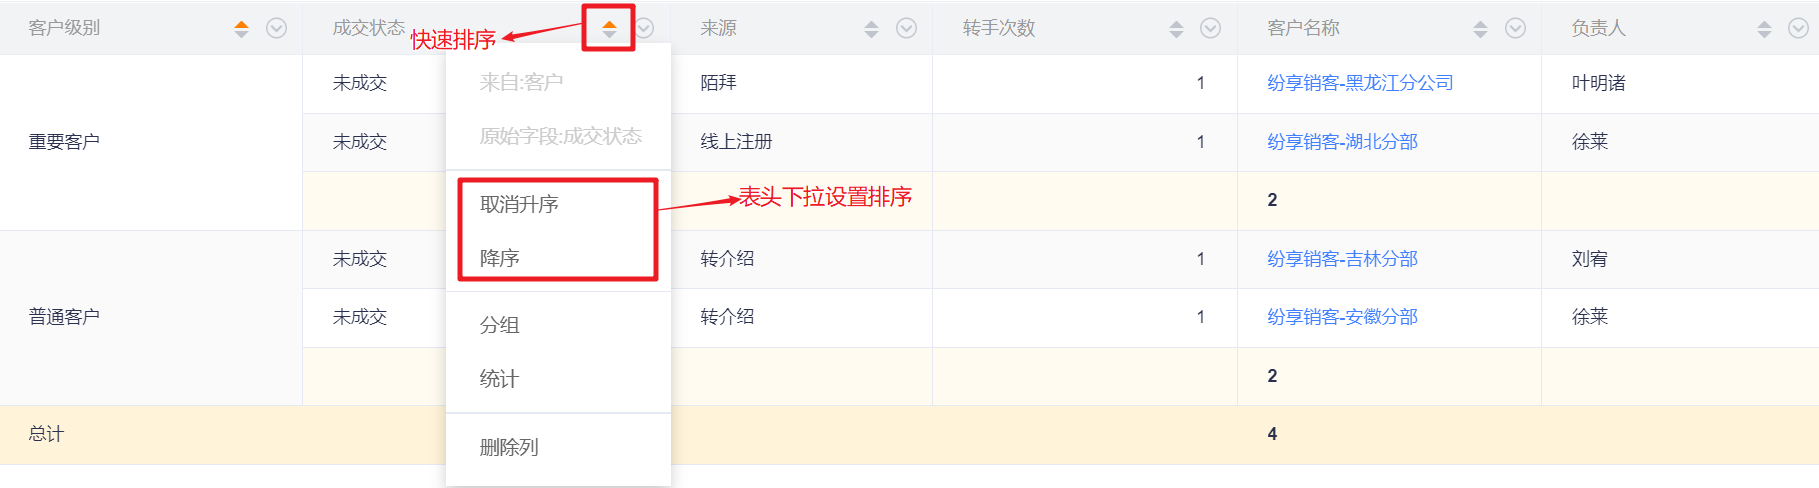
- Sorting:
- Use the header drop-down to set ascending, descending, and cancel sorting.
- Directly click on the header to quickly switch between ascending and descending order.
- Note: Grouping fields do not currently support unsorting, and the default is ascending.
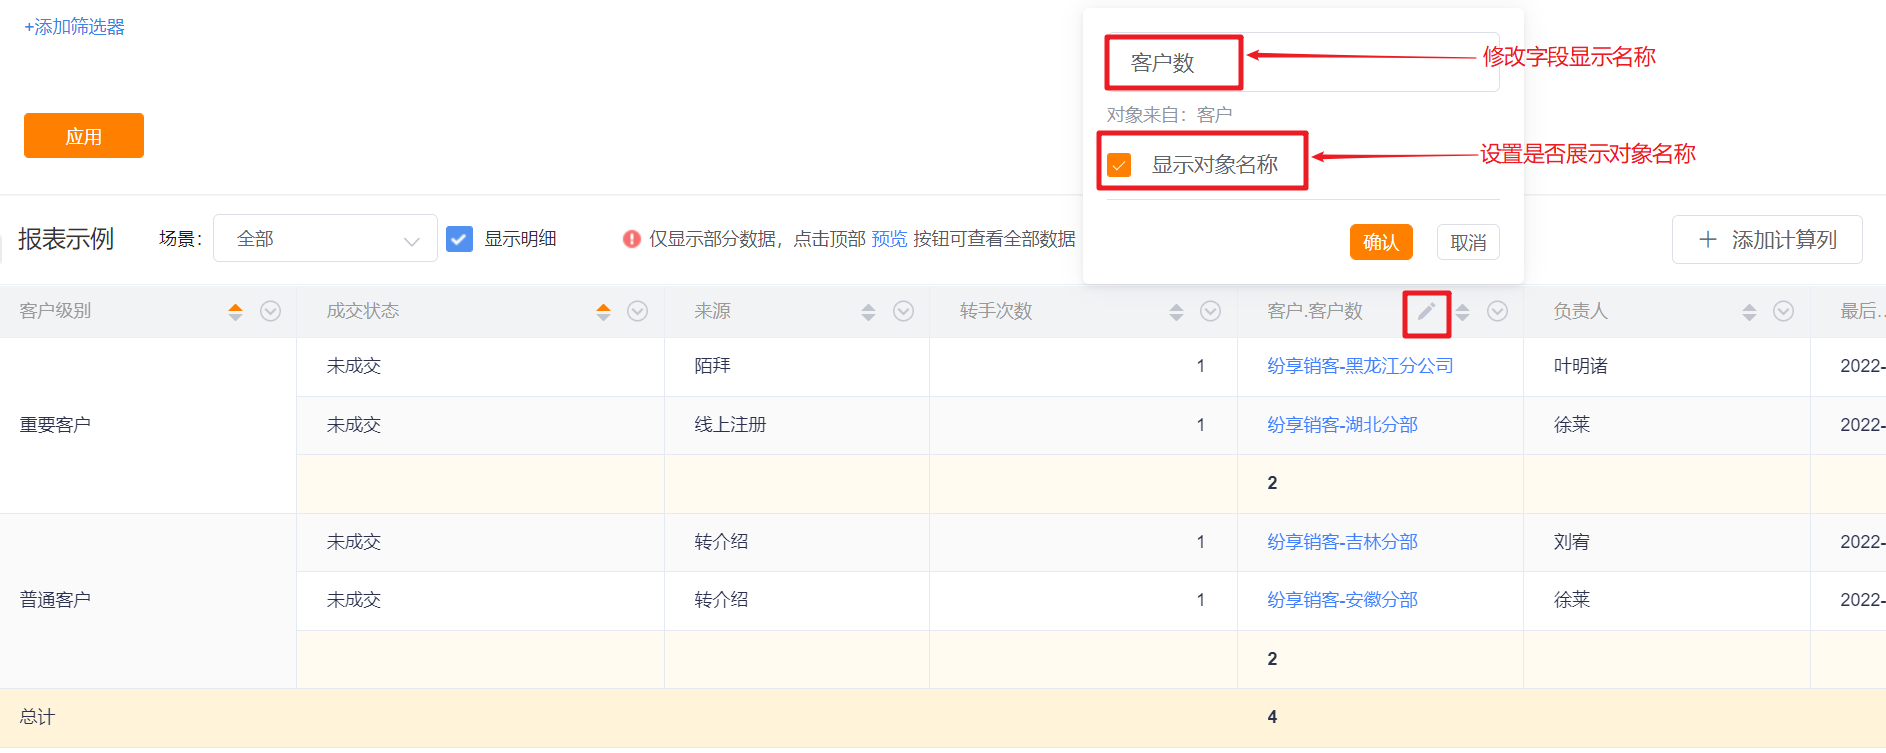
- Modify Header Display Name
- Modify the header field name.
- Display the object name.
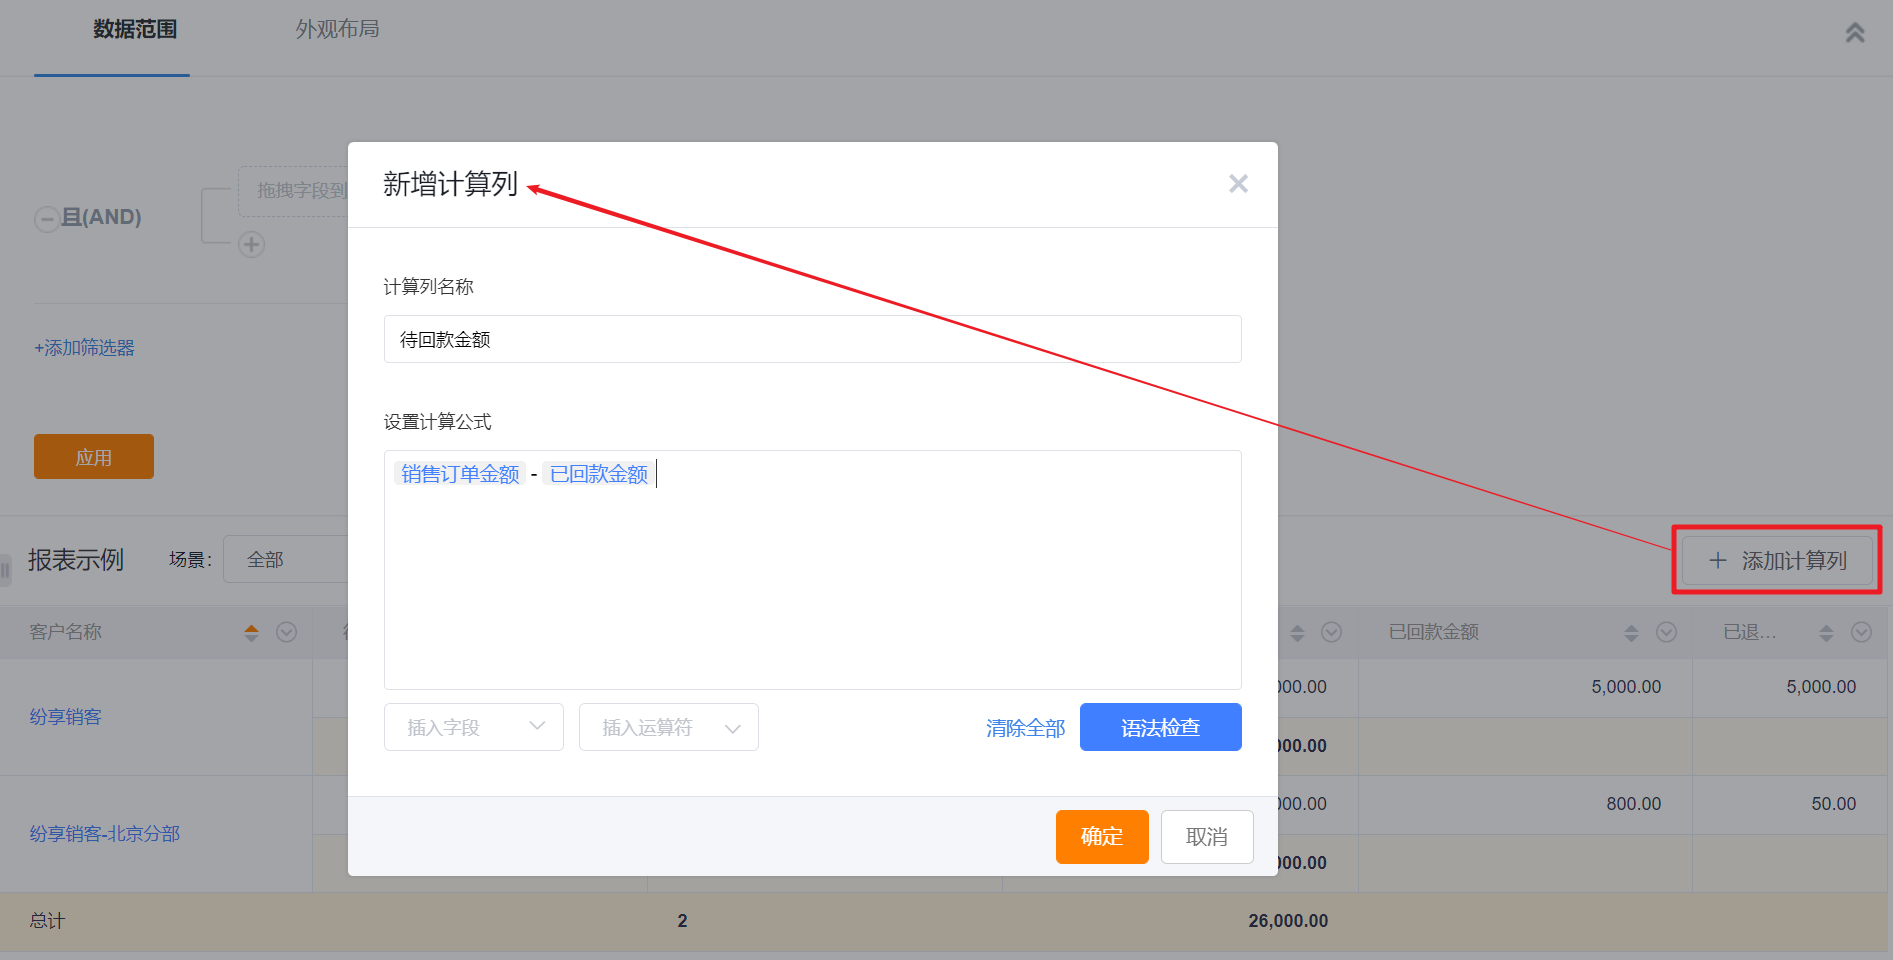
- Add Calculation Column
- After the calculation column is added, it will be displayed at the top of the detail column by default, and it can be dragged between the detail columns, but cannot be dragged into the grouping column.
- Each calculated column can only add up to 5 numeric fields in the report object.
- The added calculated column can also be further summed
2.4 Filter Scene
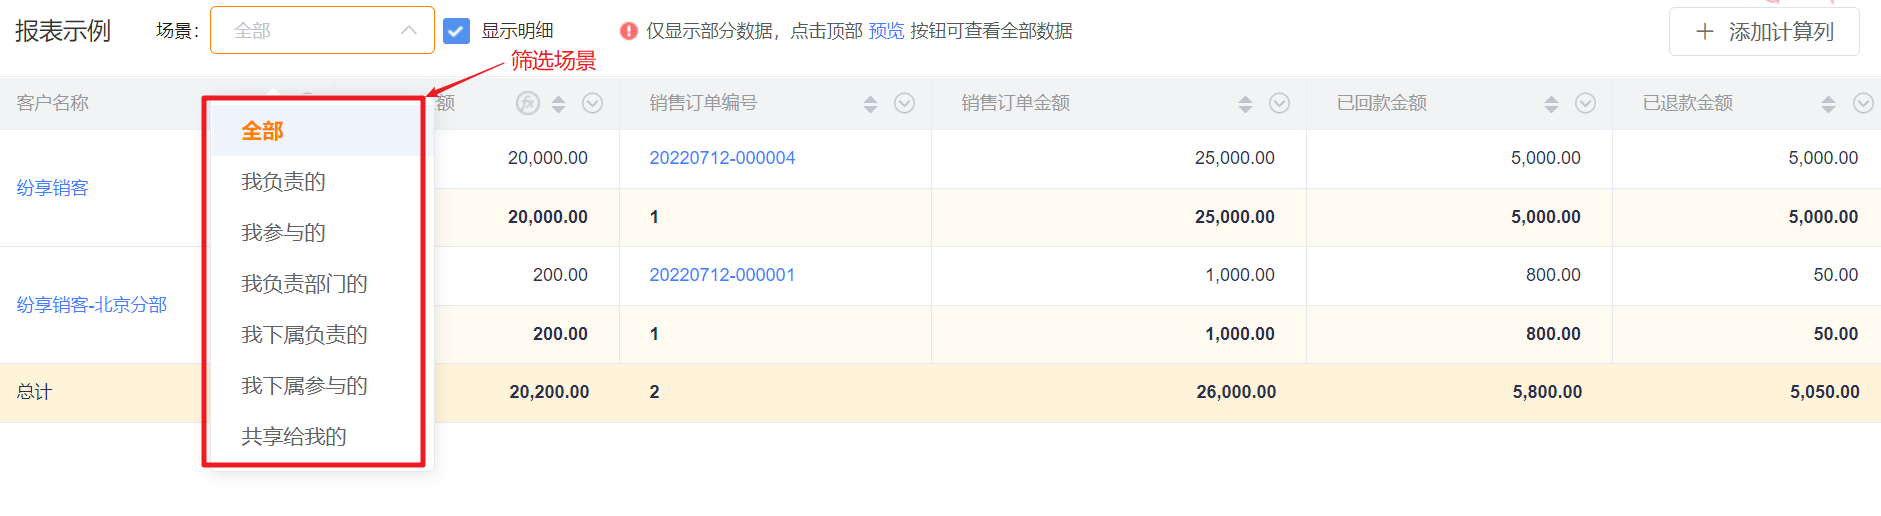
- BI pre-configures the filtering scene for each chart, and you can specify which scene label to use as the default value when viewing the report.
2.5 Data Range
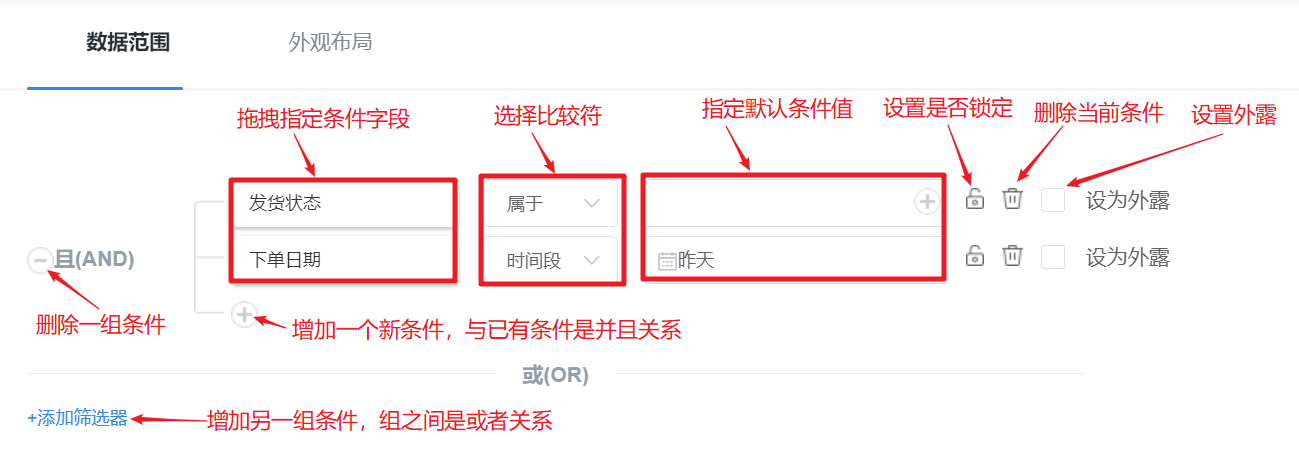
- The data range editing area is used to specify the filter conditions of the report.
- Conditional fields can be used by dragging and dropping from the optional field area on the left and from the report header.
- The comparator for the condition differs depending on the field type used.
- Locked conditions cannot be modified while viewing the report.
- Added conditions can be set to be exposed
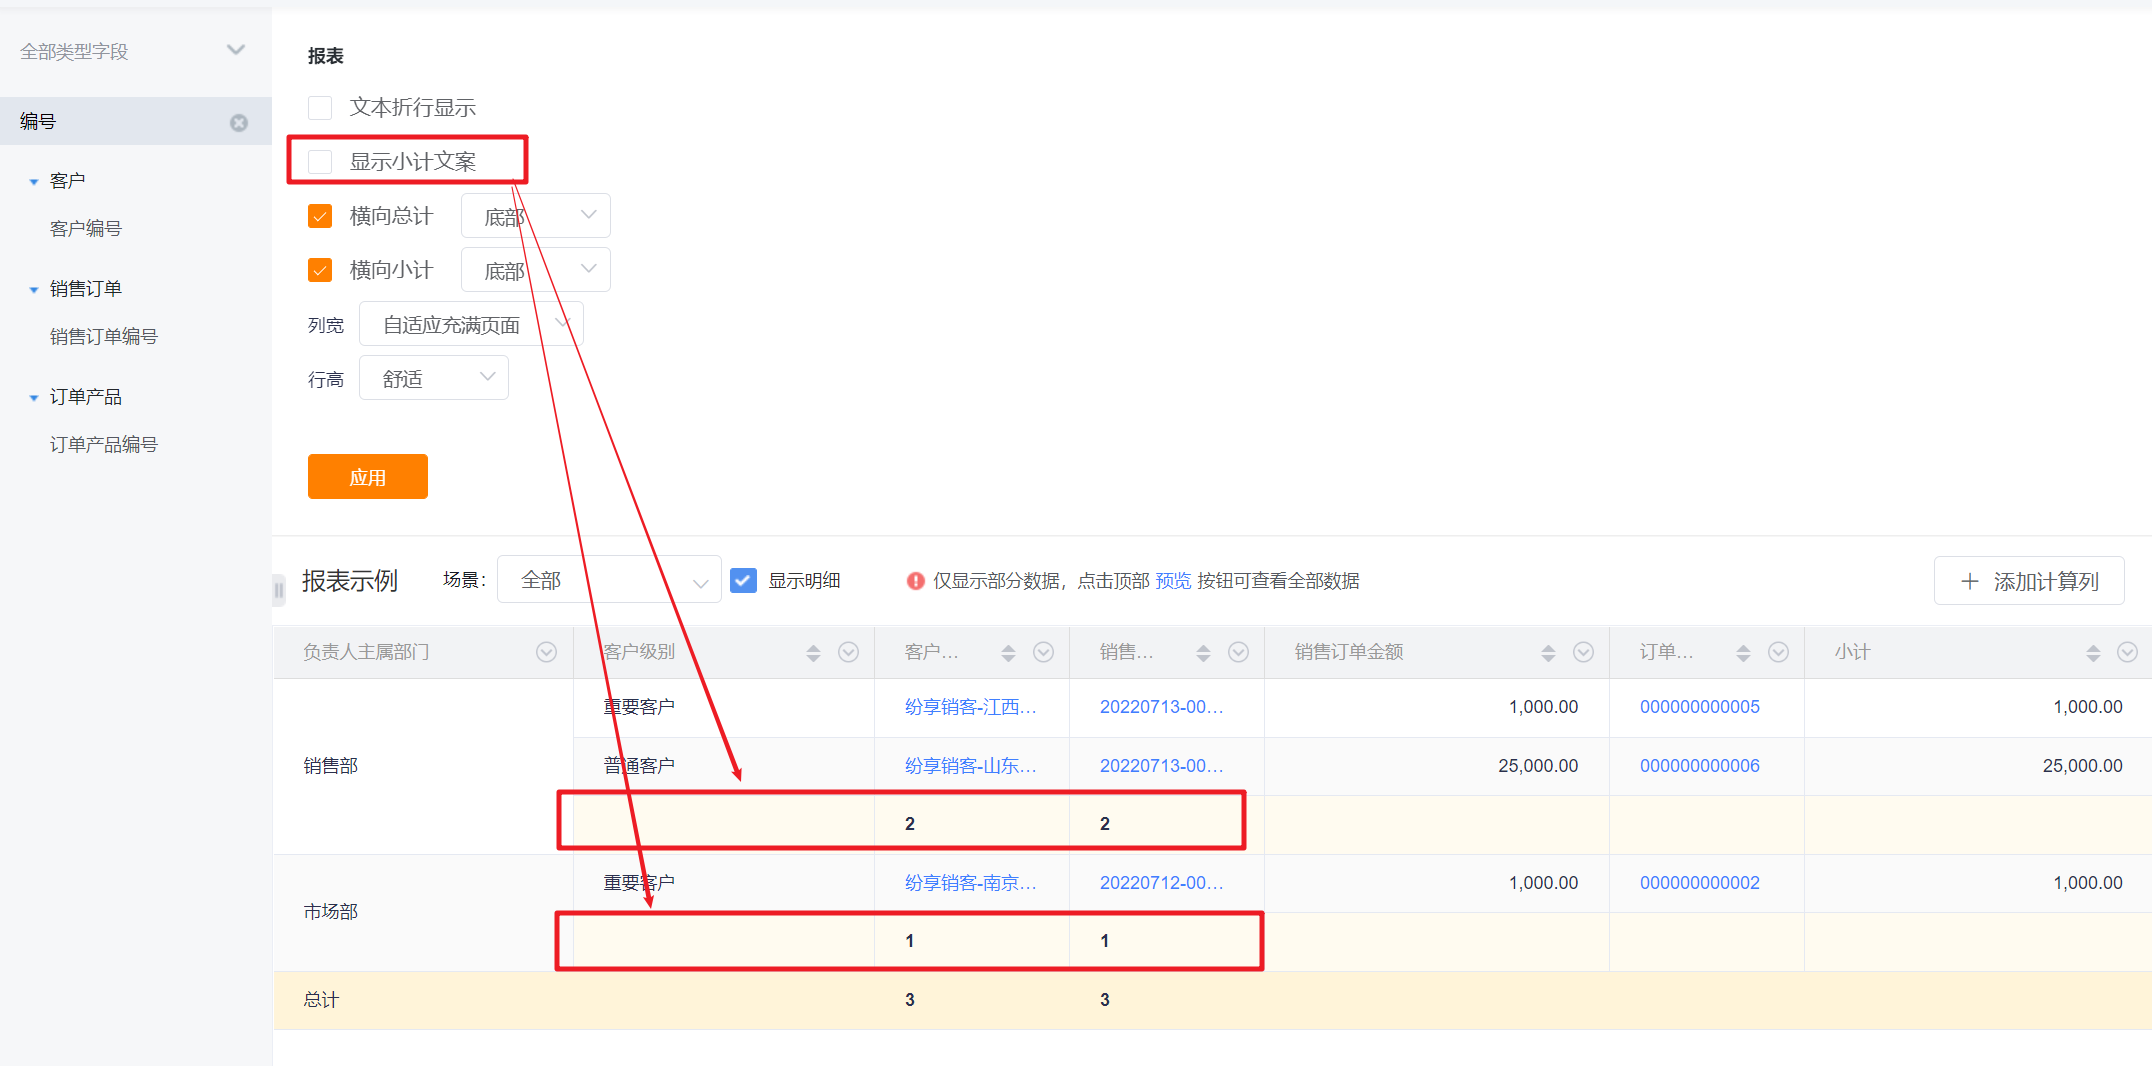
2.6 Appearance Layout
- Display subtotal copy: By default, the subtotal copy is not displayed. After checking, the subtotal copy will be displayed for the report with statistics
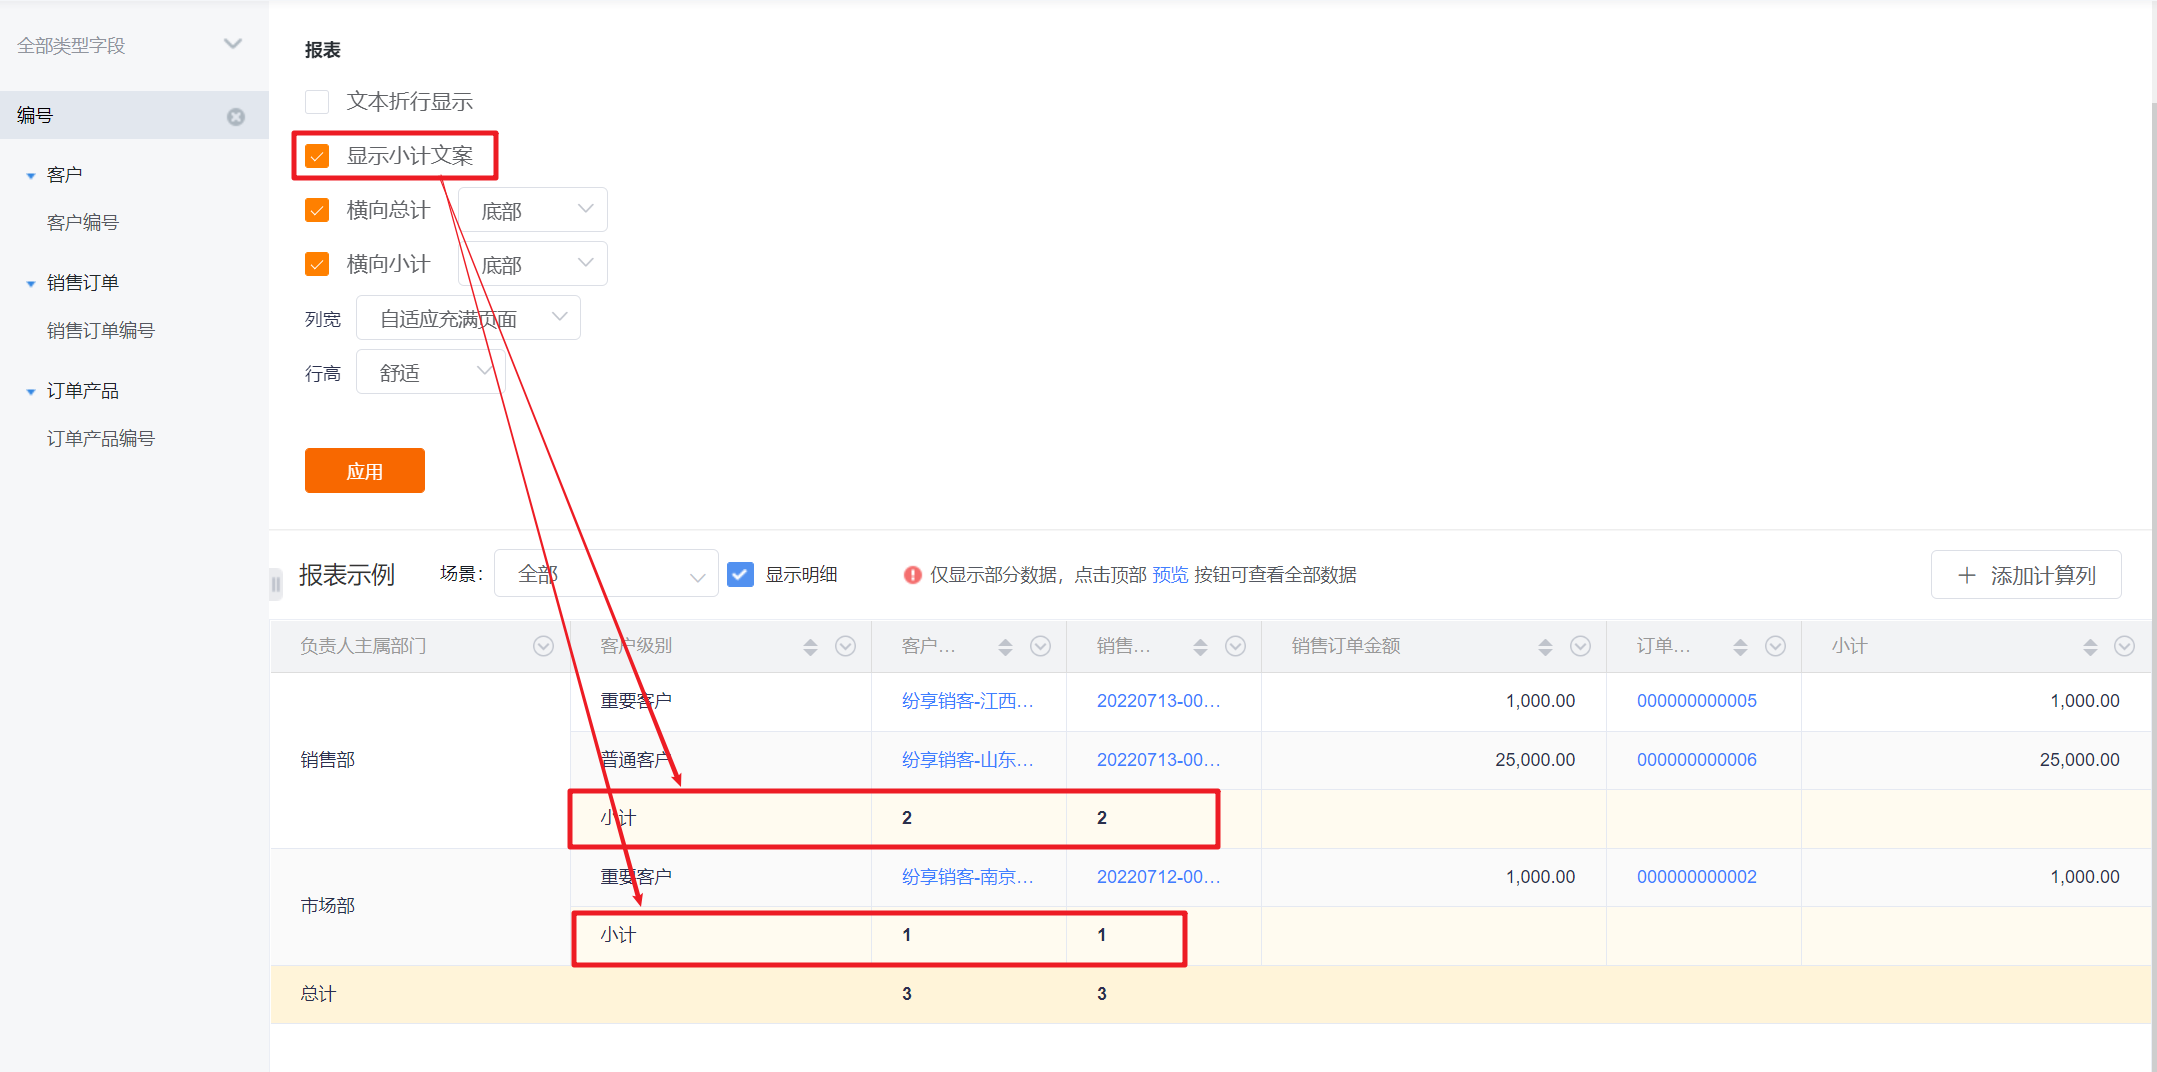
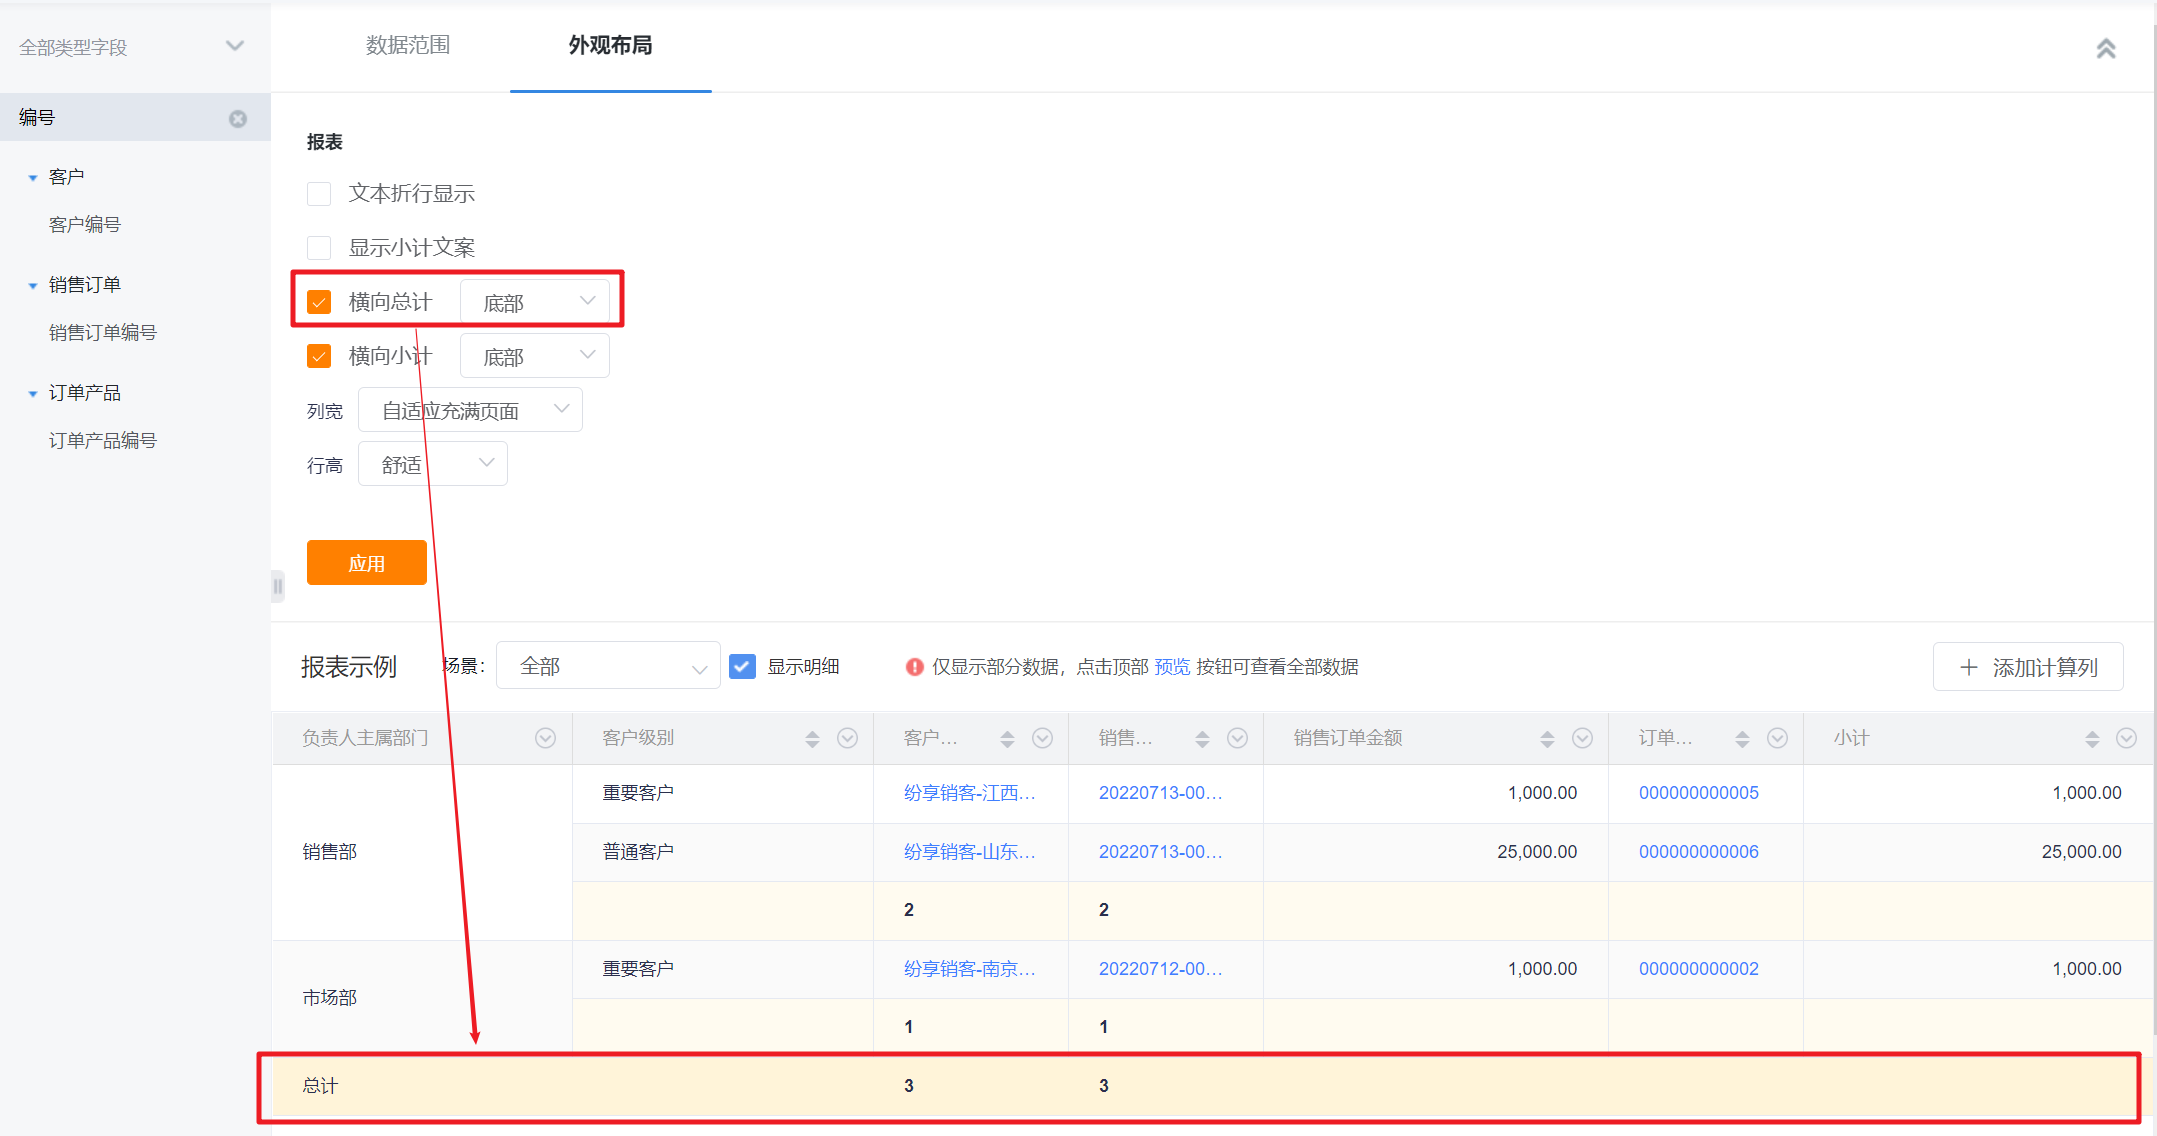
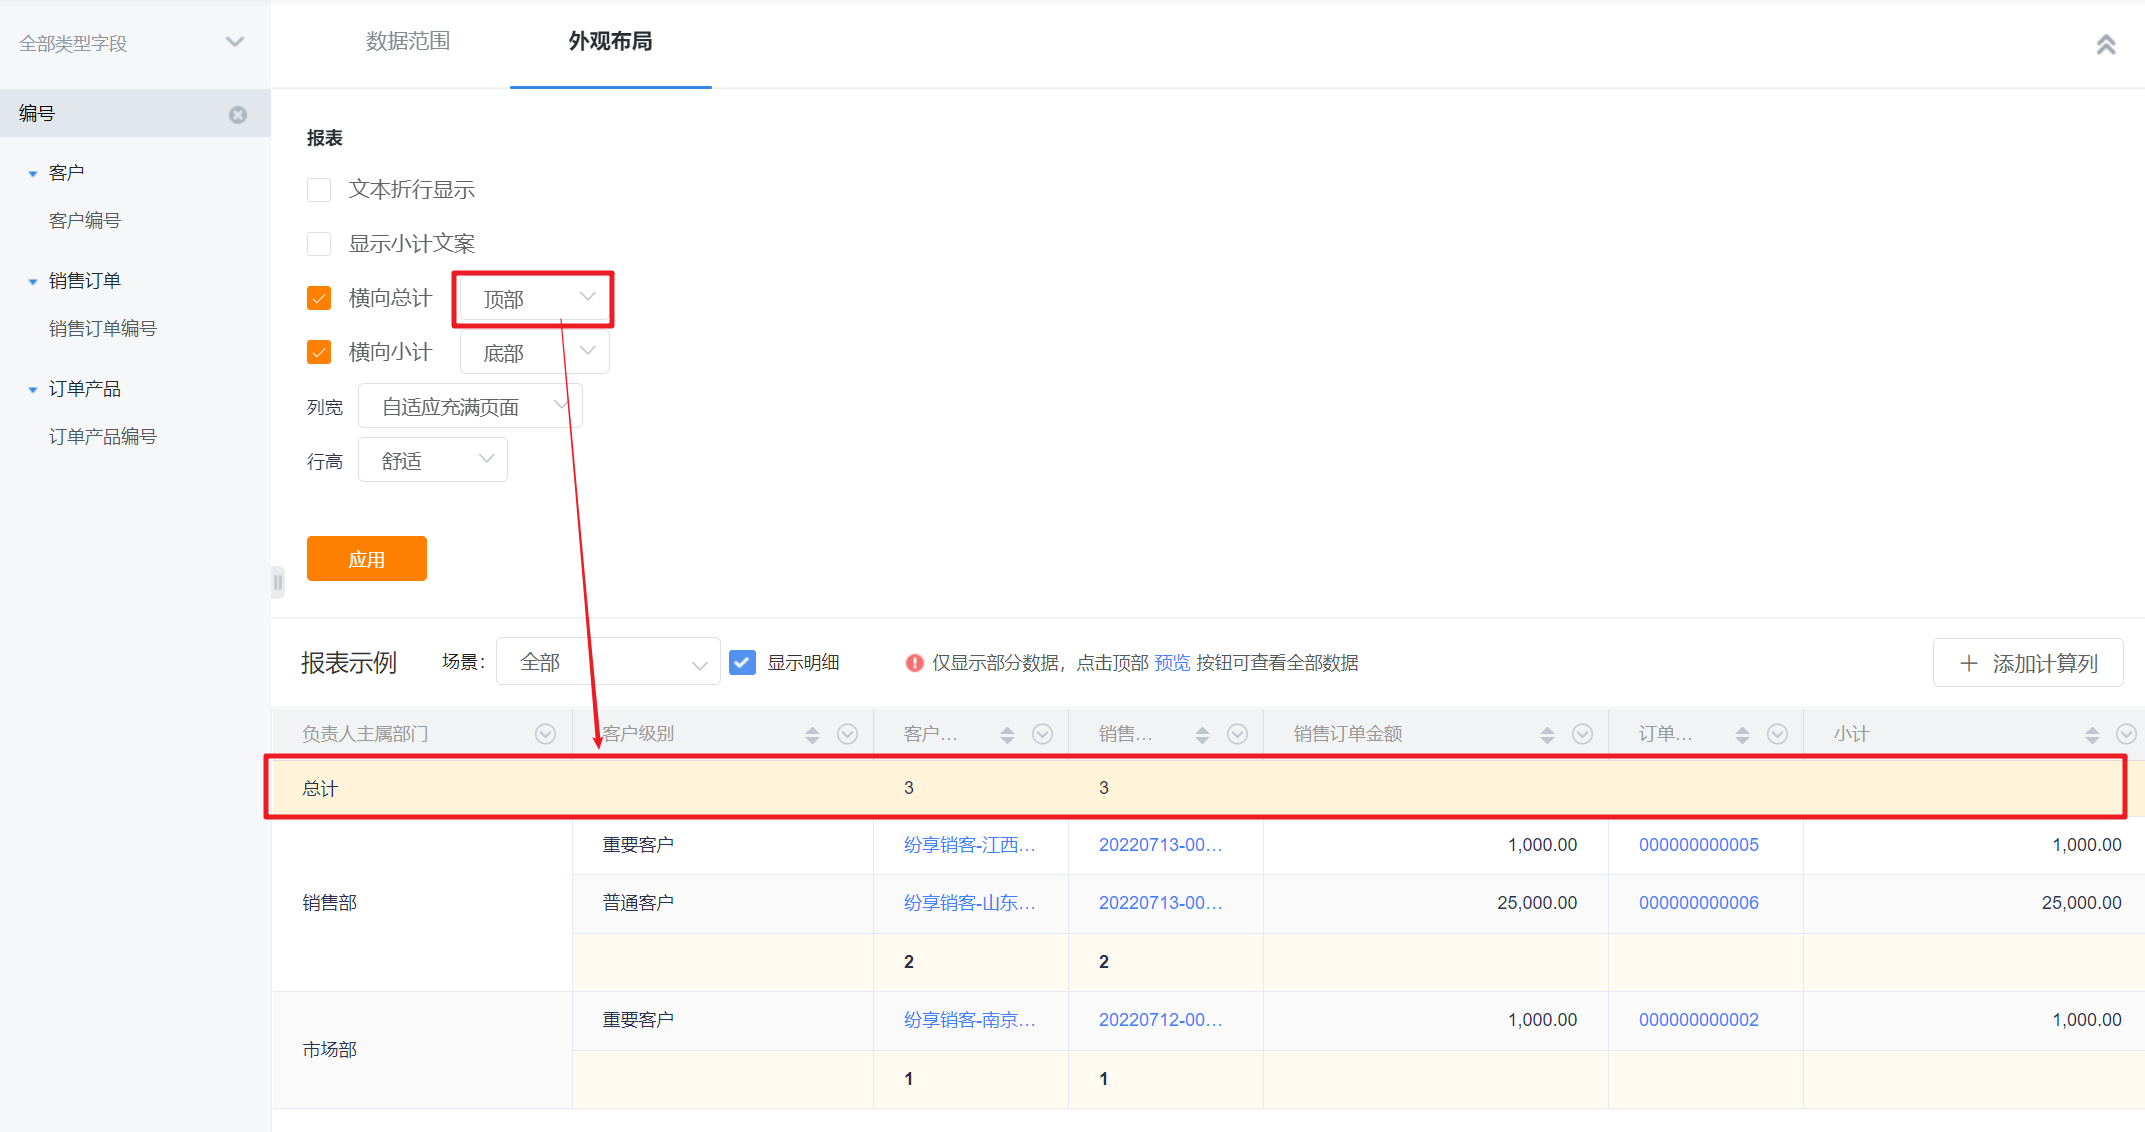
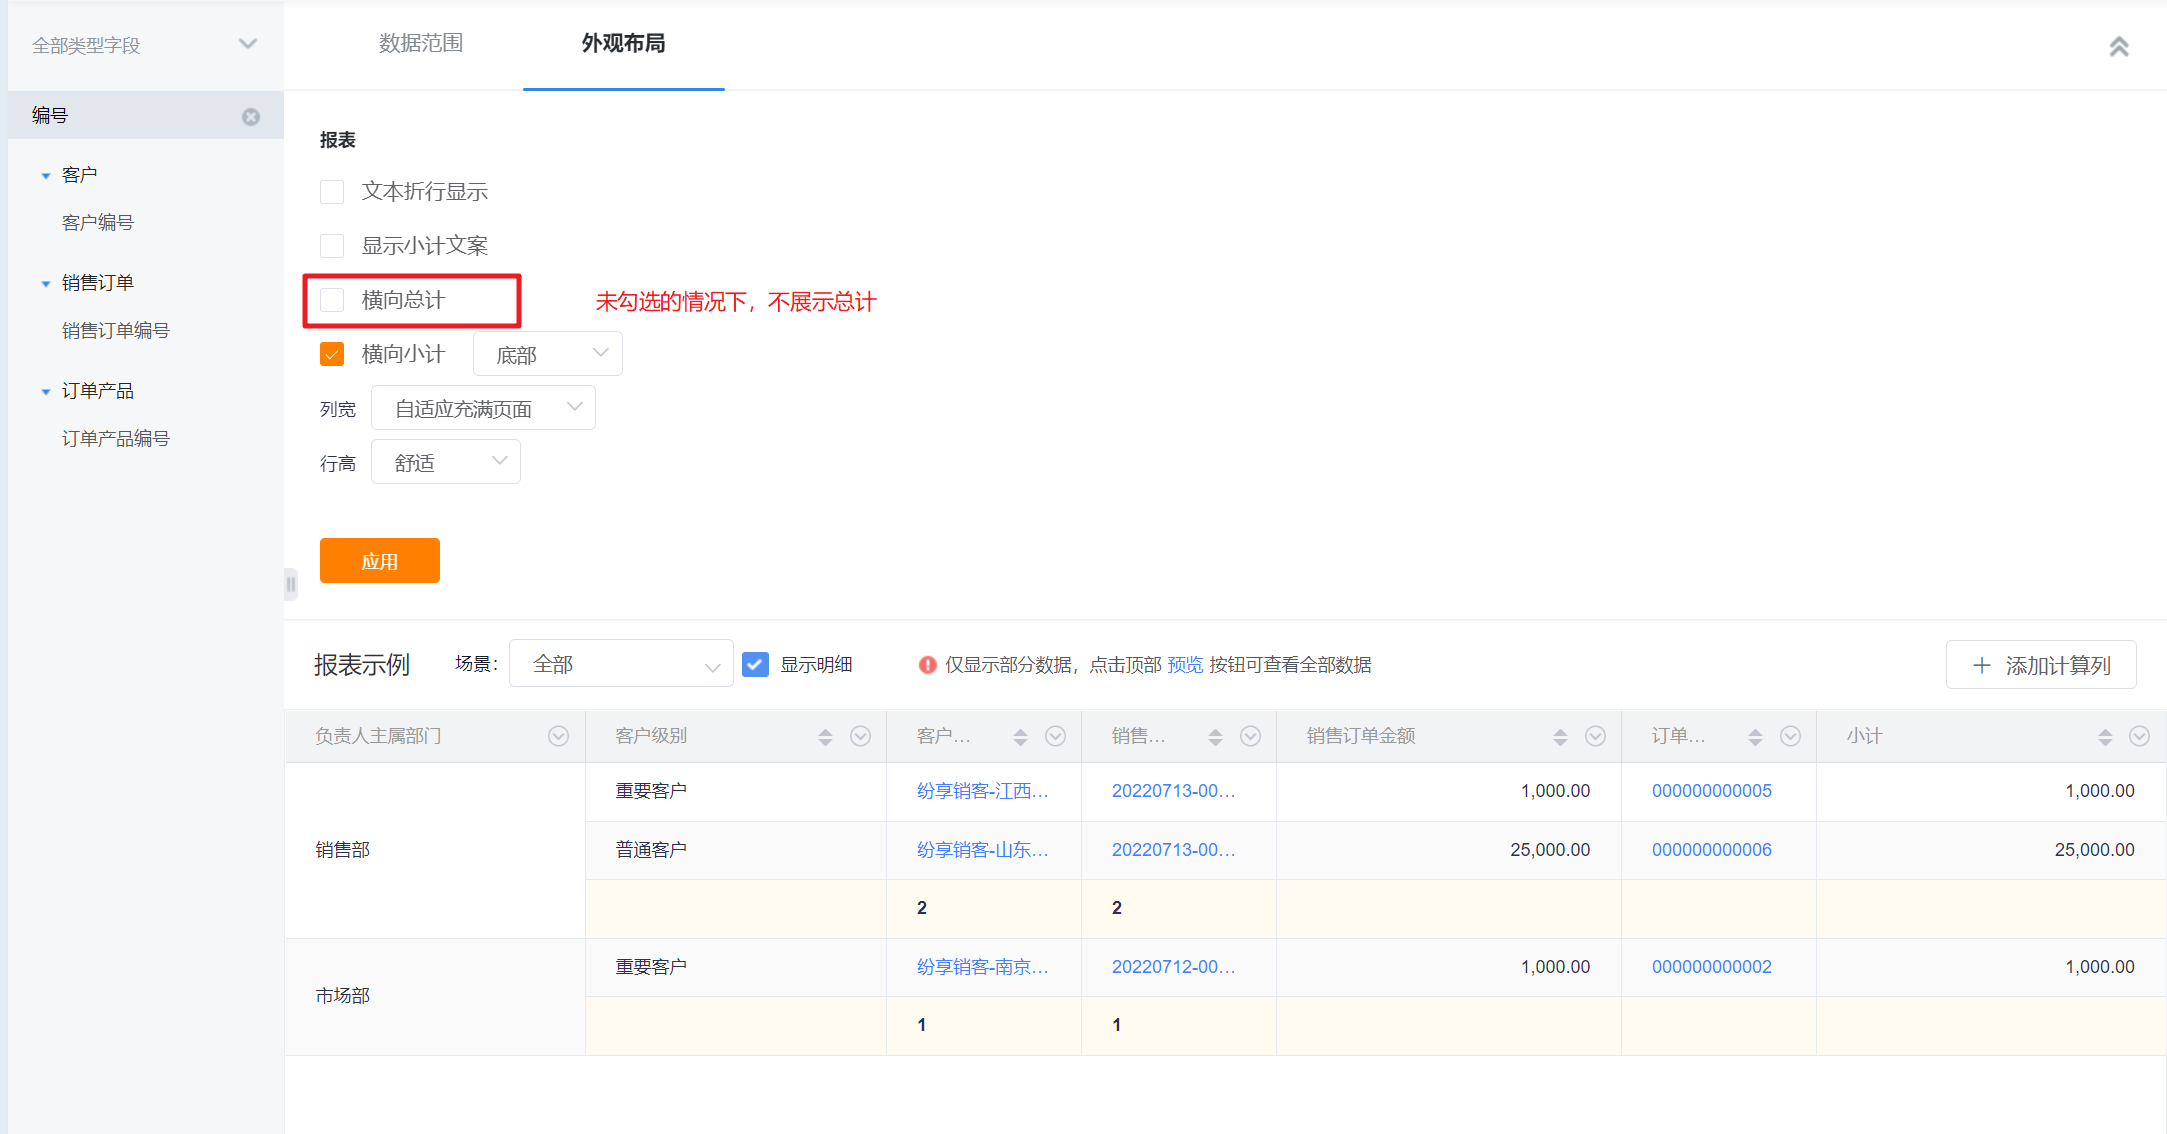
- Horizontal Total: Checked by default and displayed at the bottom, can be switched to displayed at the top or unchecked
- Horizontal Subtotal: Checked by default and displayed at the bottom, can be switched to displayed at the top or unchecked (the specific effect is the same as "horizontal total")
- If the display subtotal is not checked, the "display subtotal text" configuration cannot be set
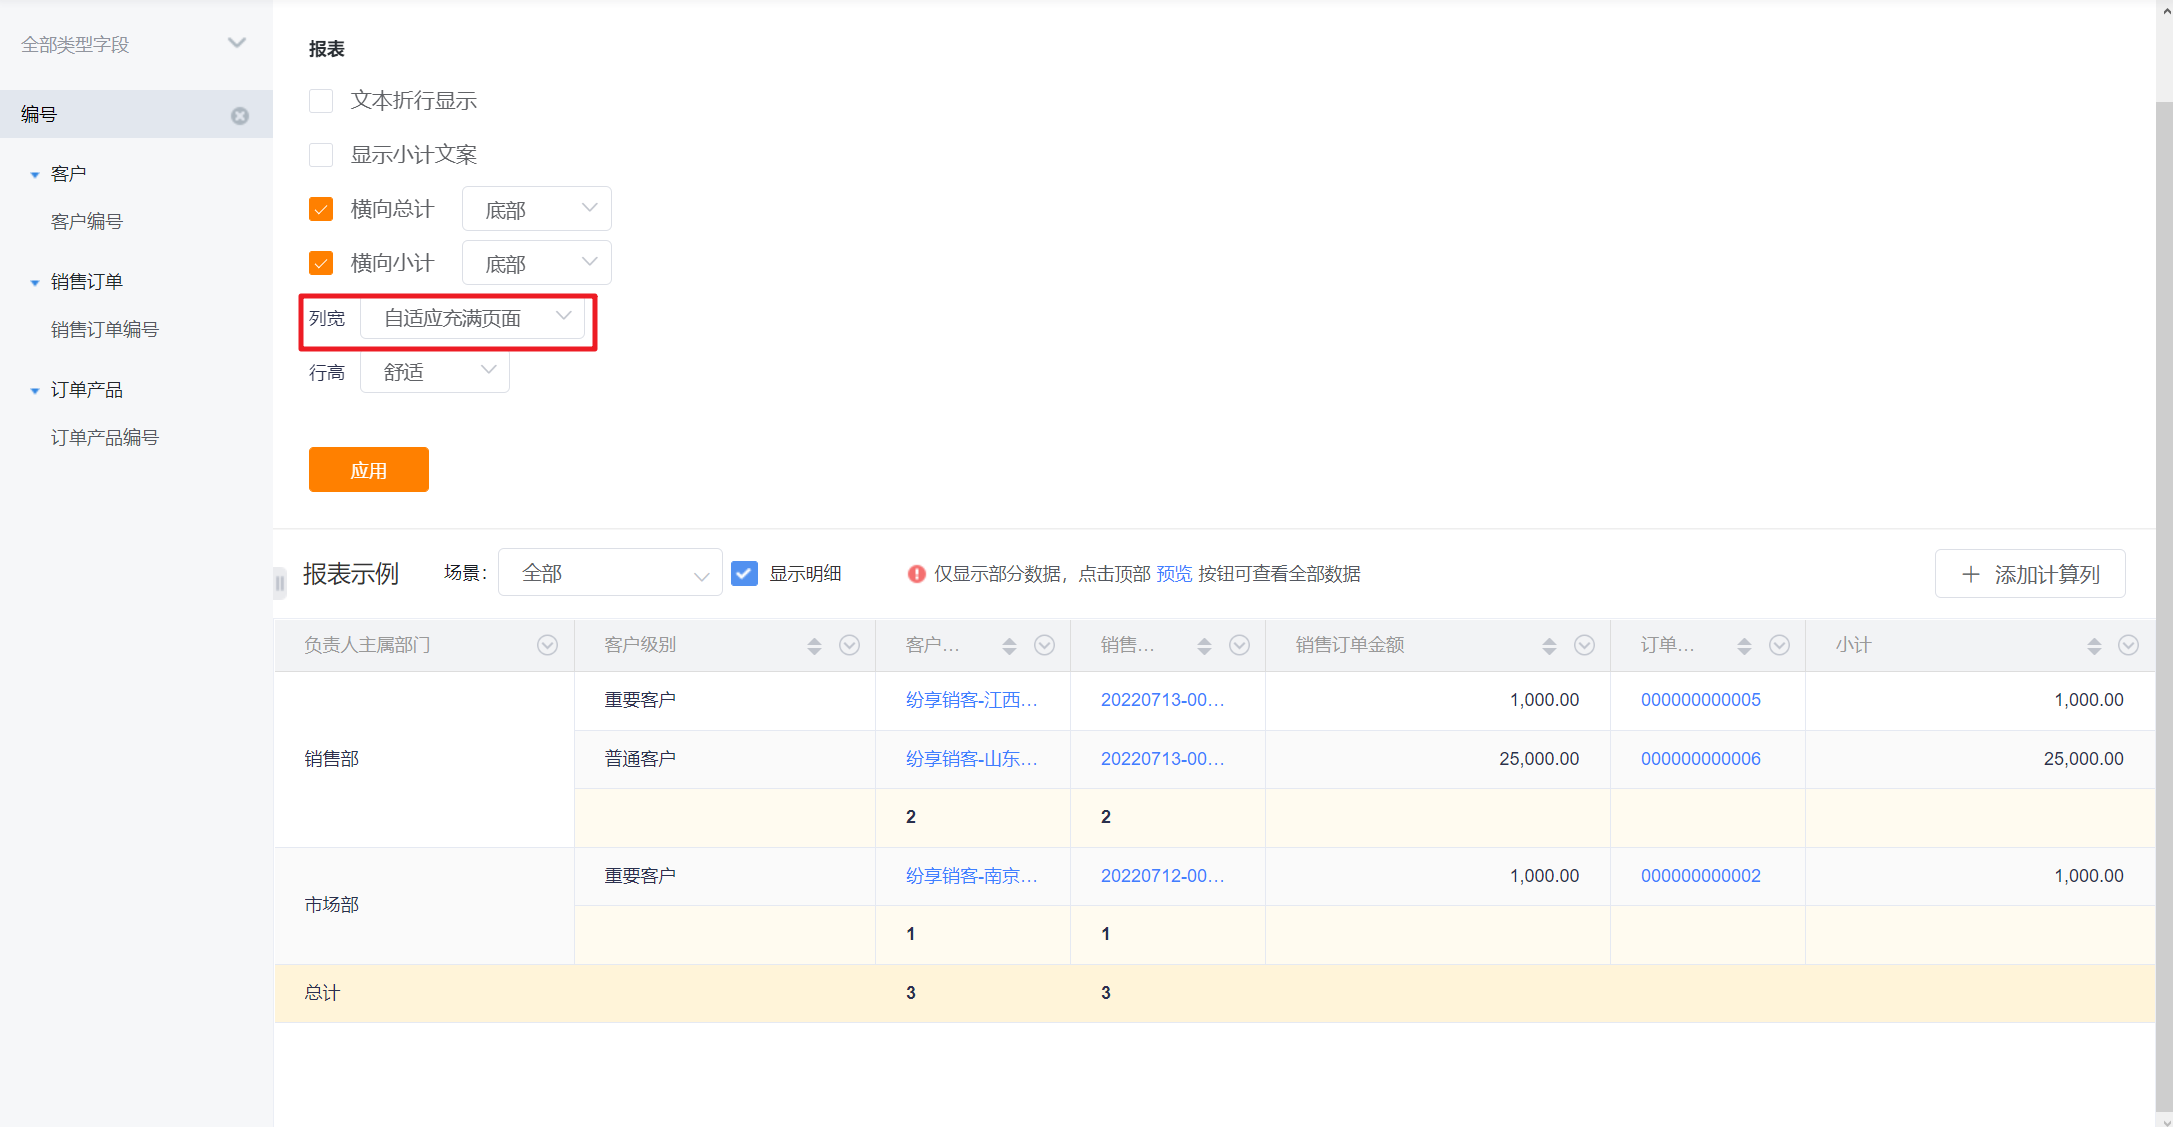
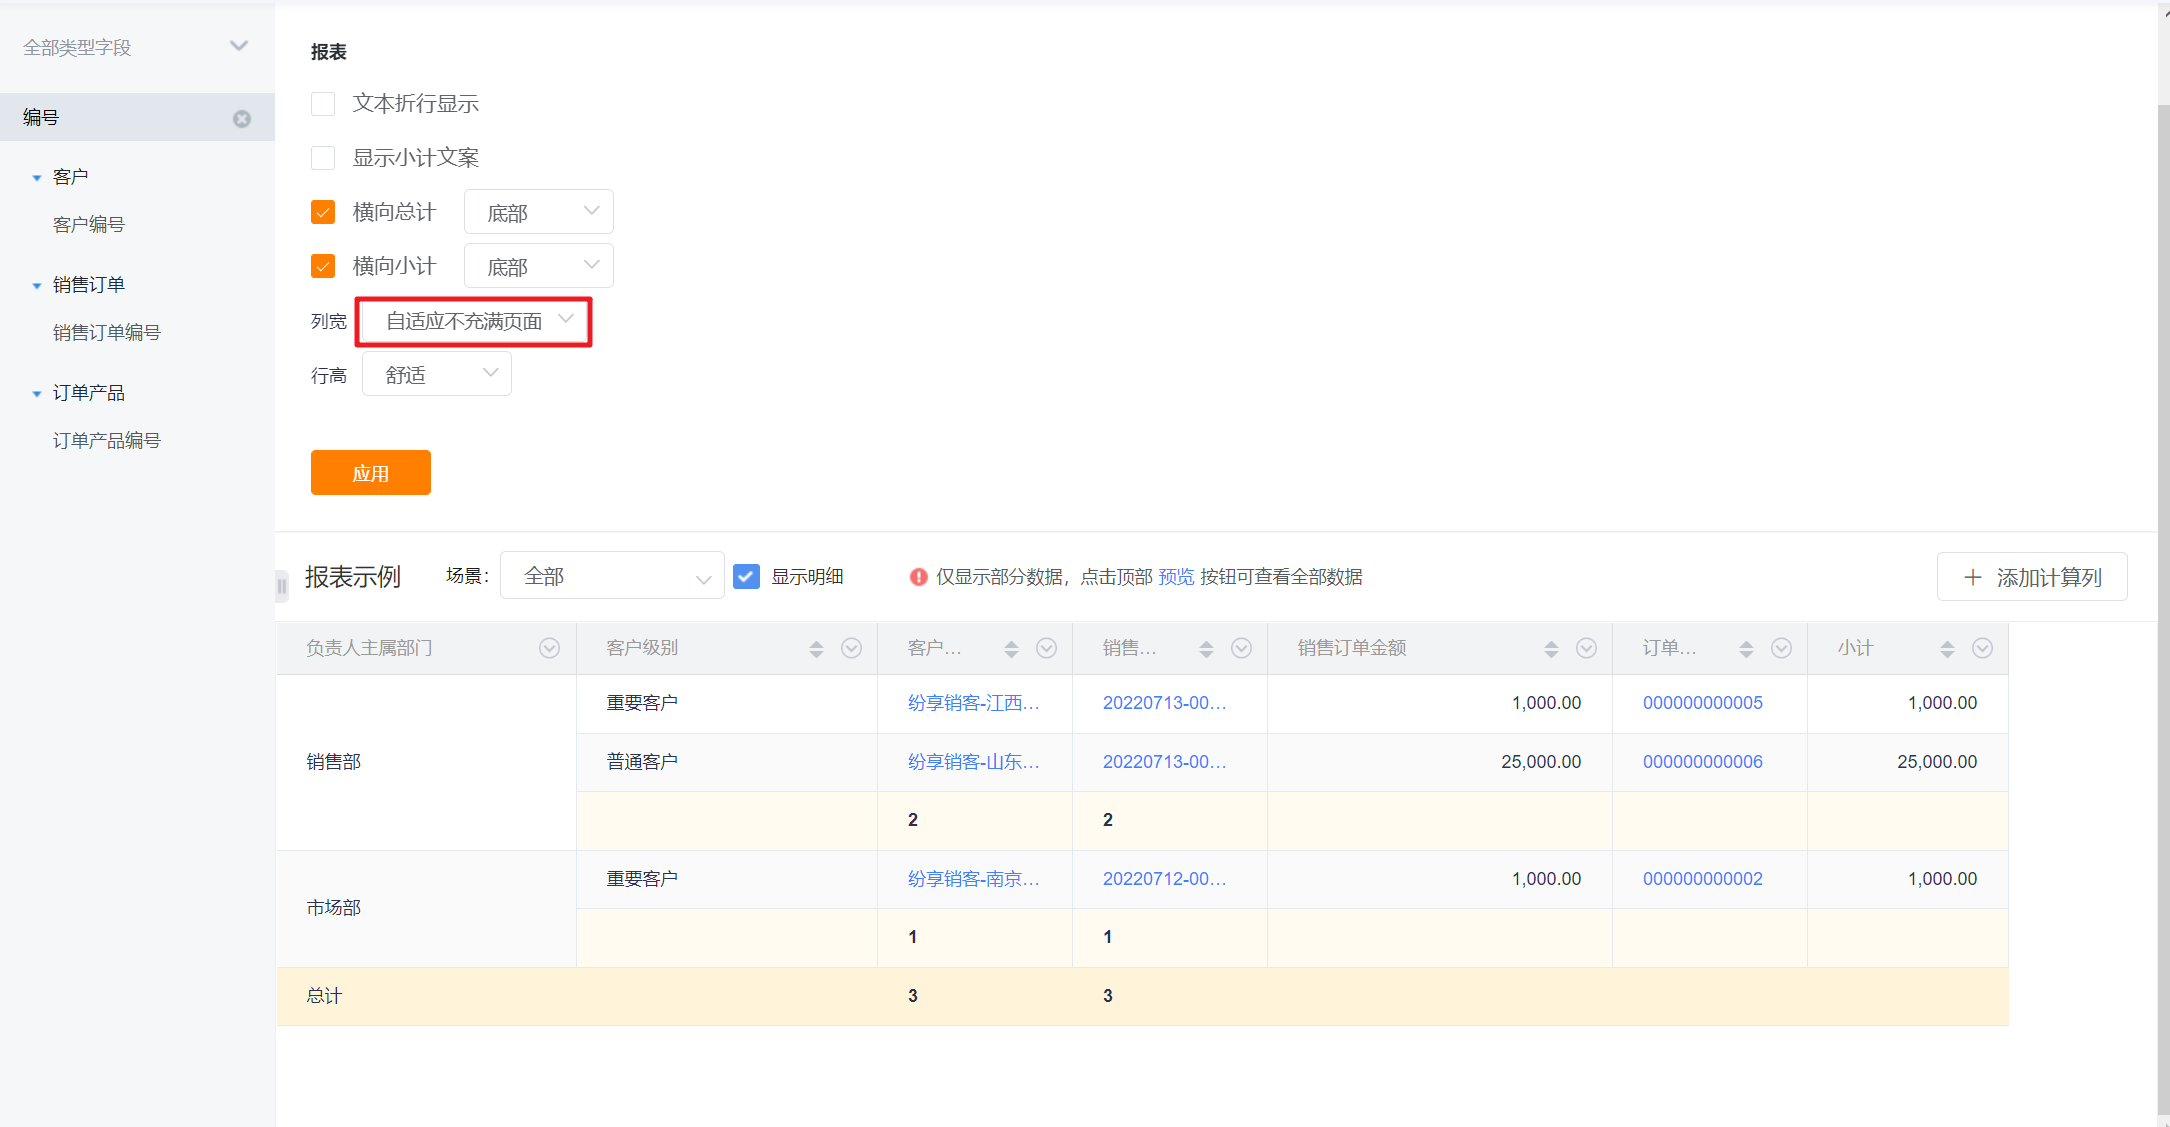
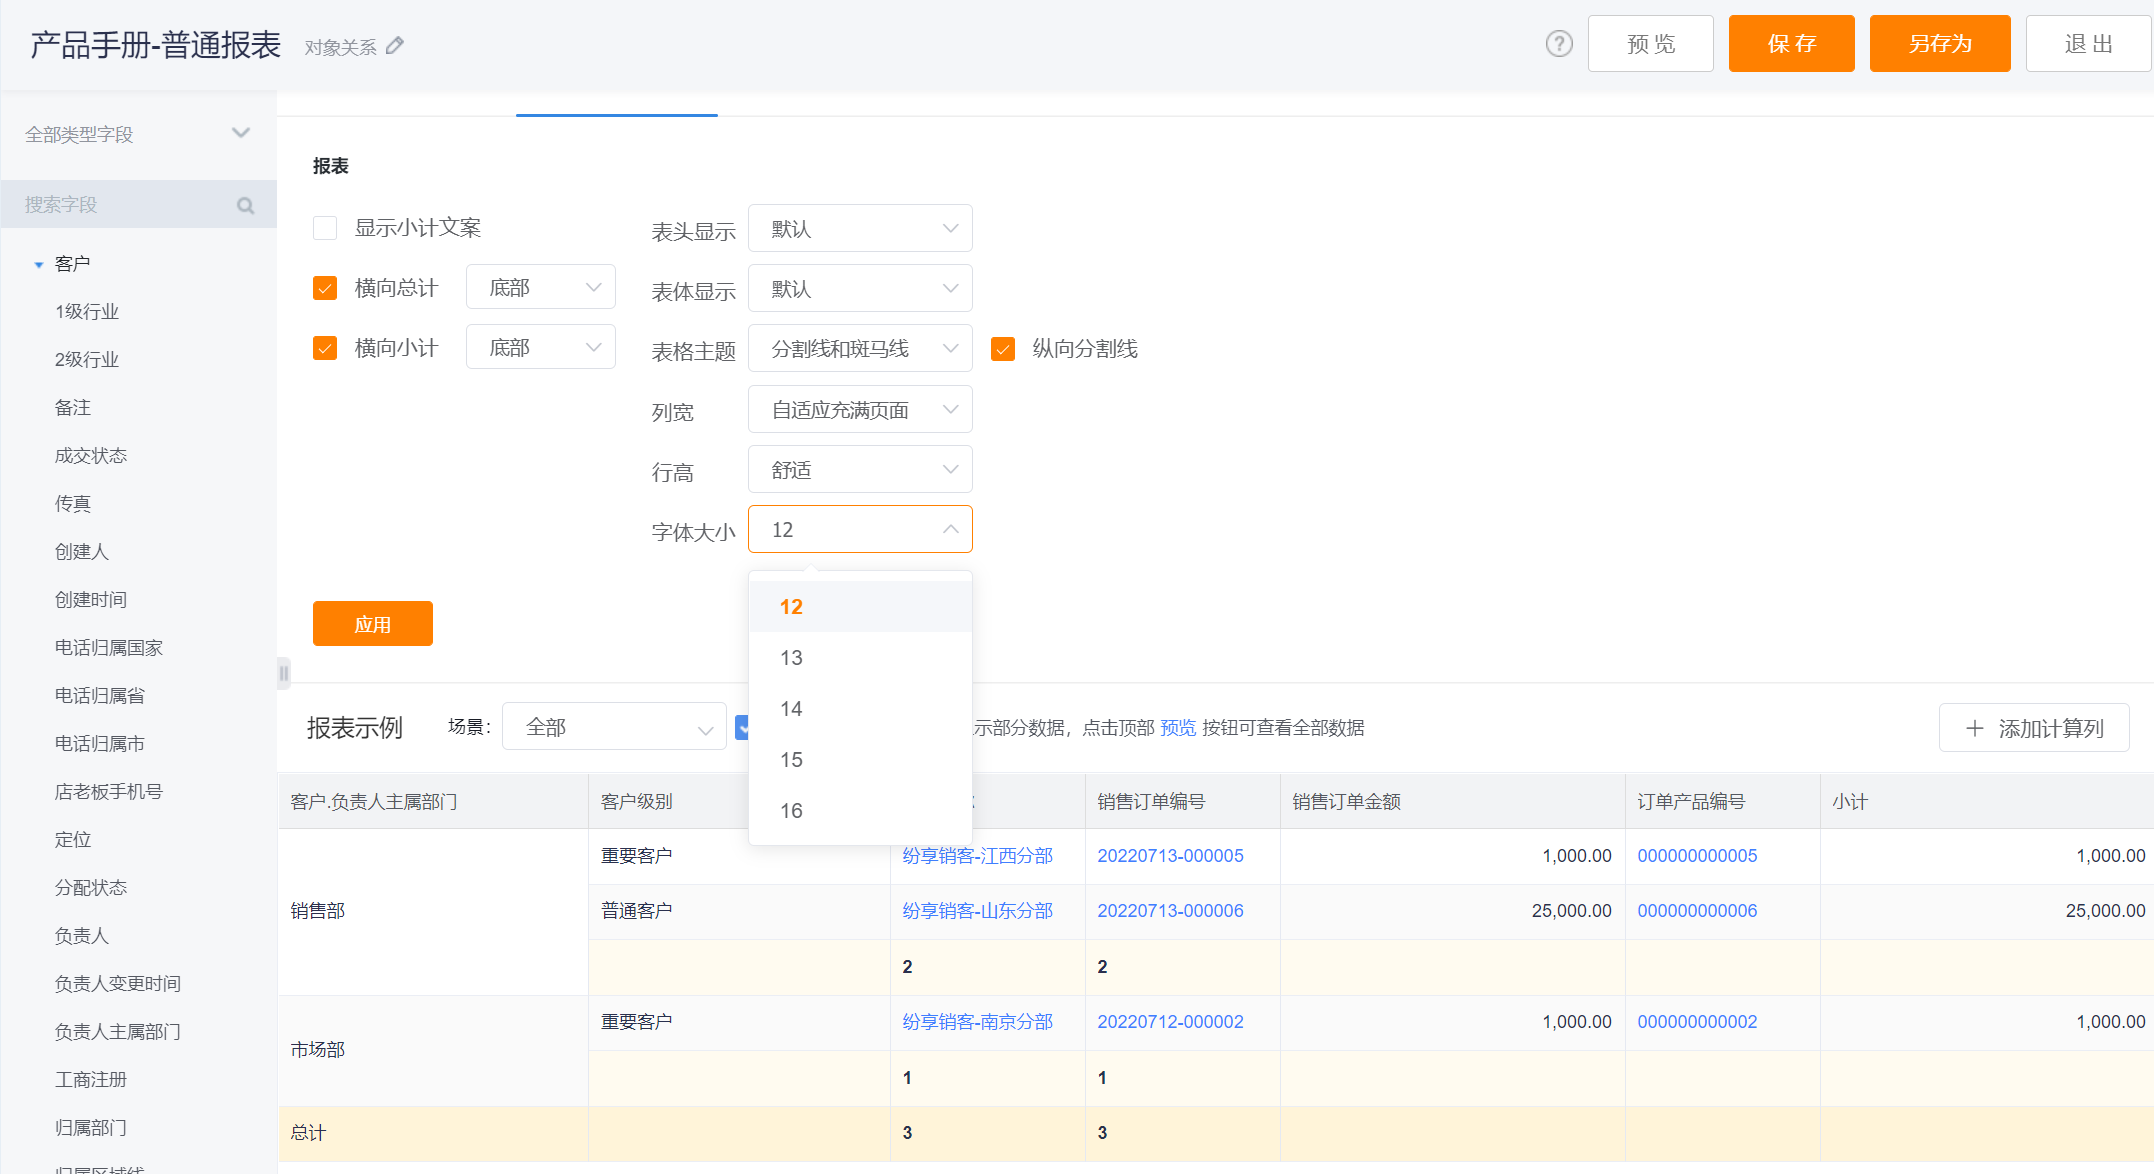
- Column Width: the default adaptive full page, can be adjusted to not fill the page
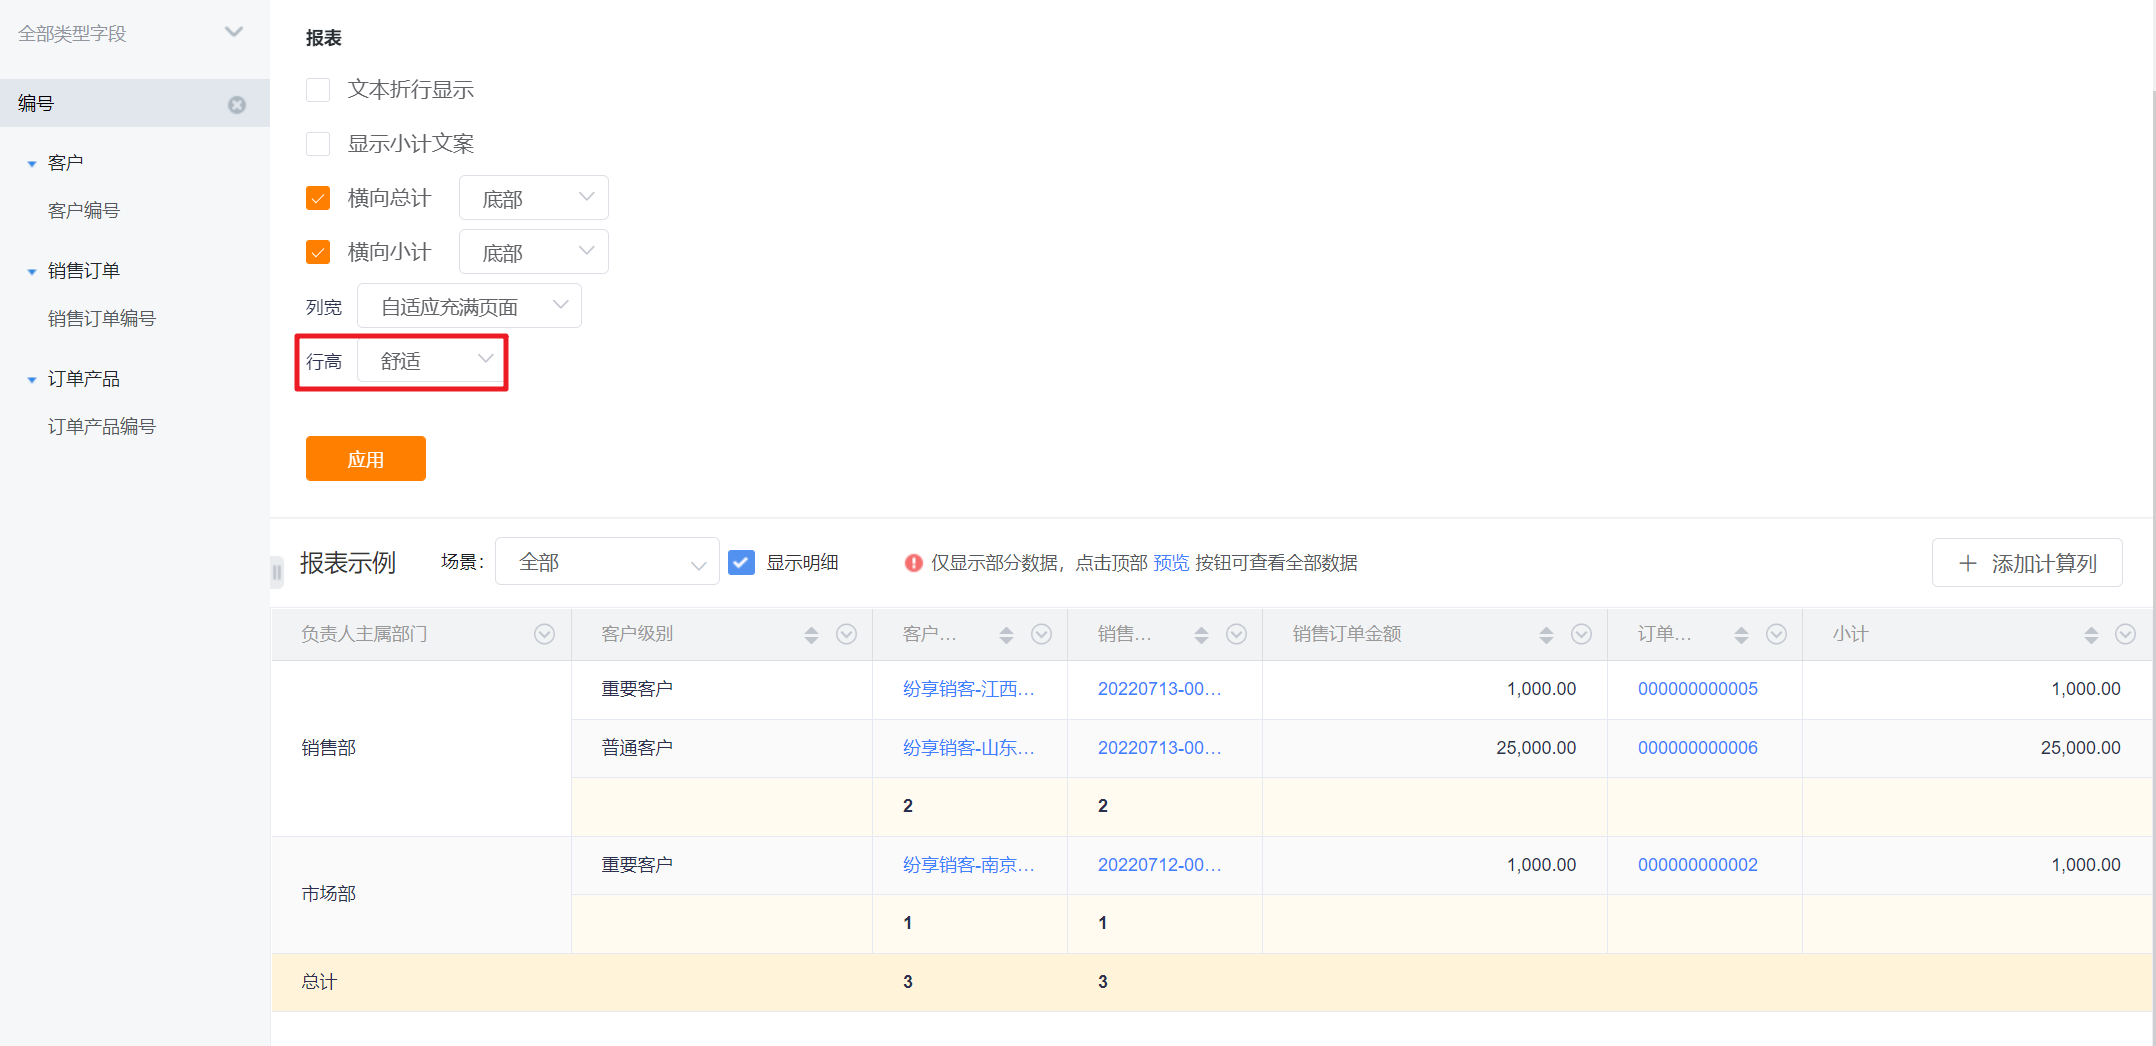
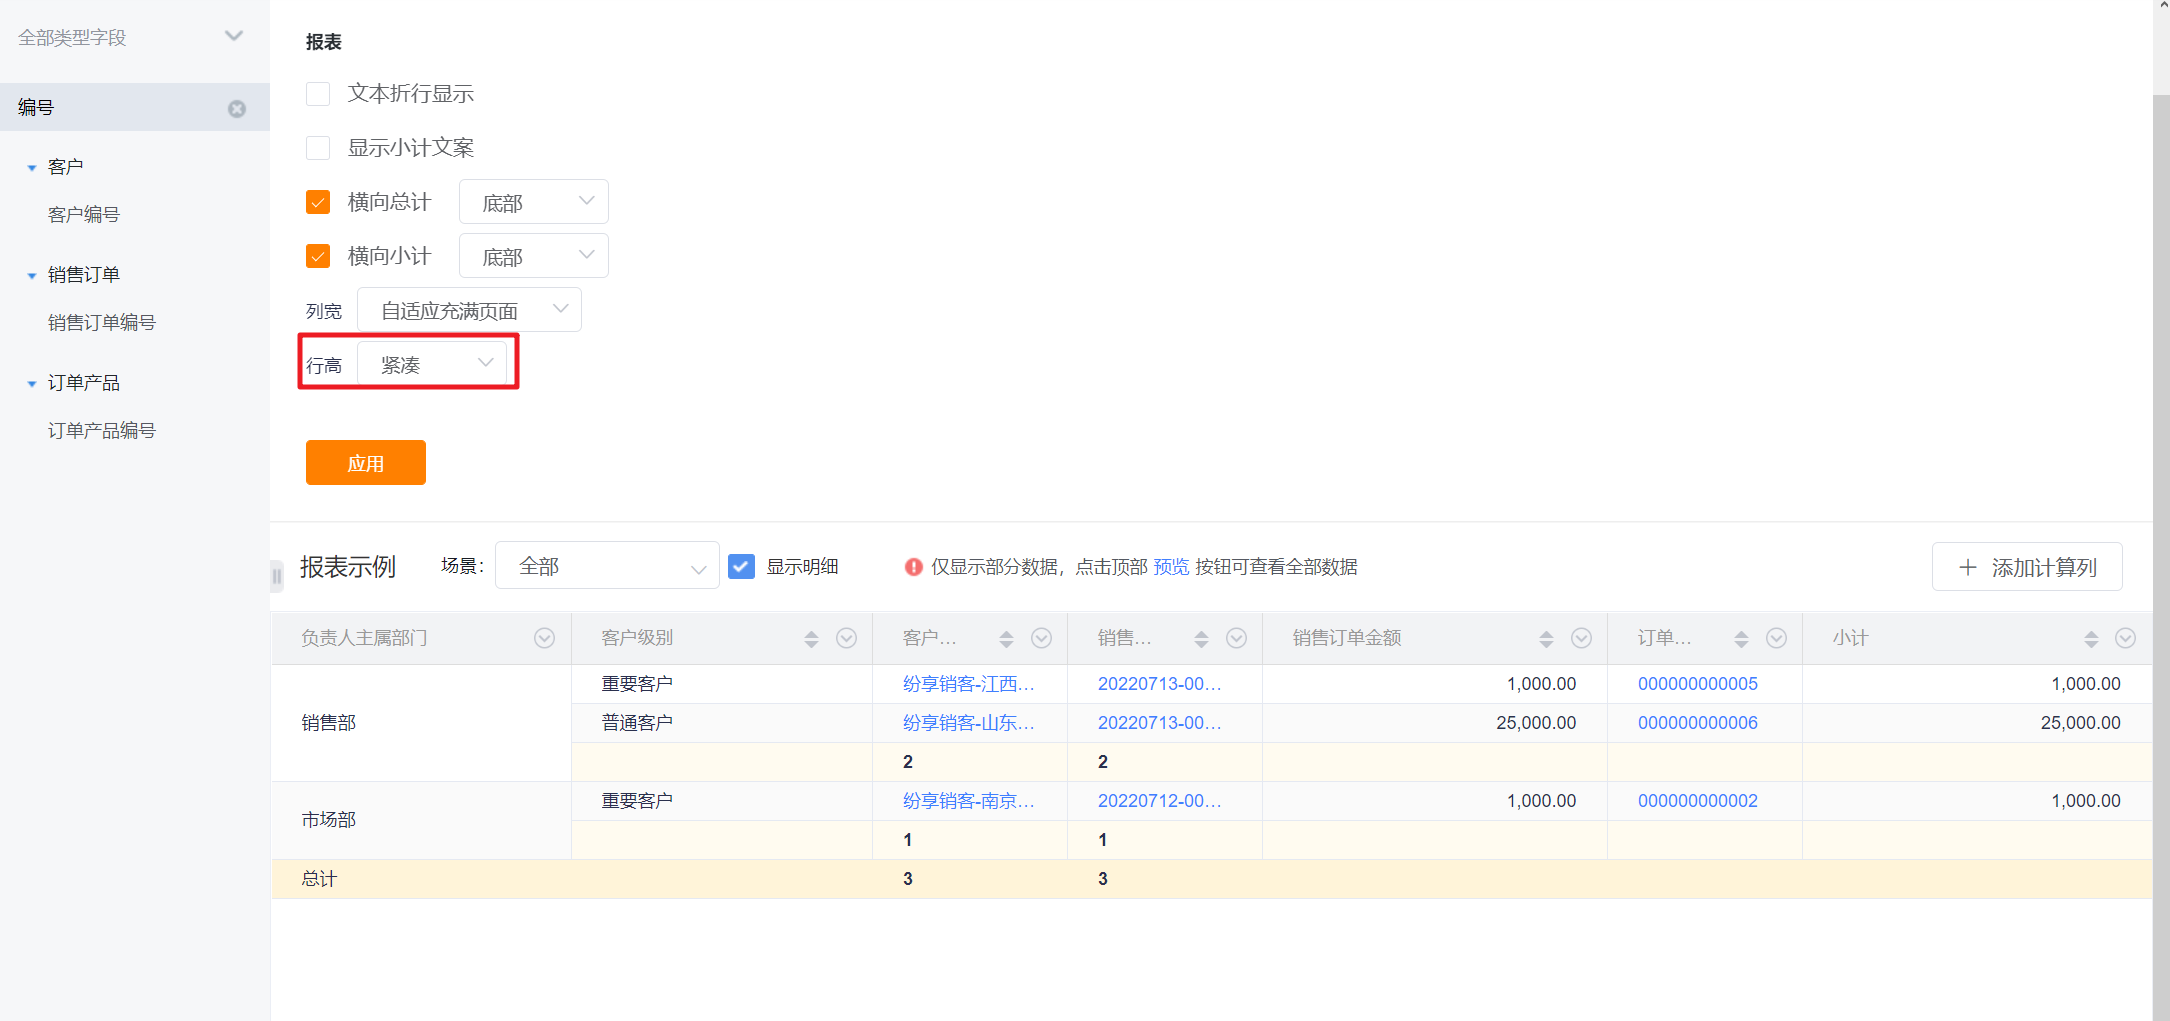
- Row Height: the default is comfortable, it can be adjusted to compact
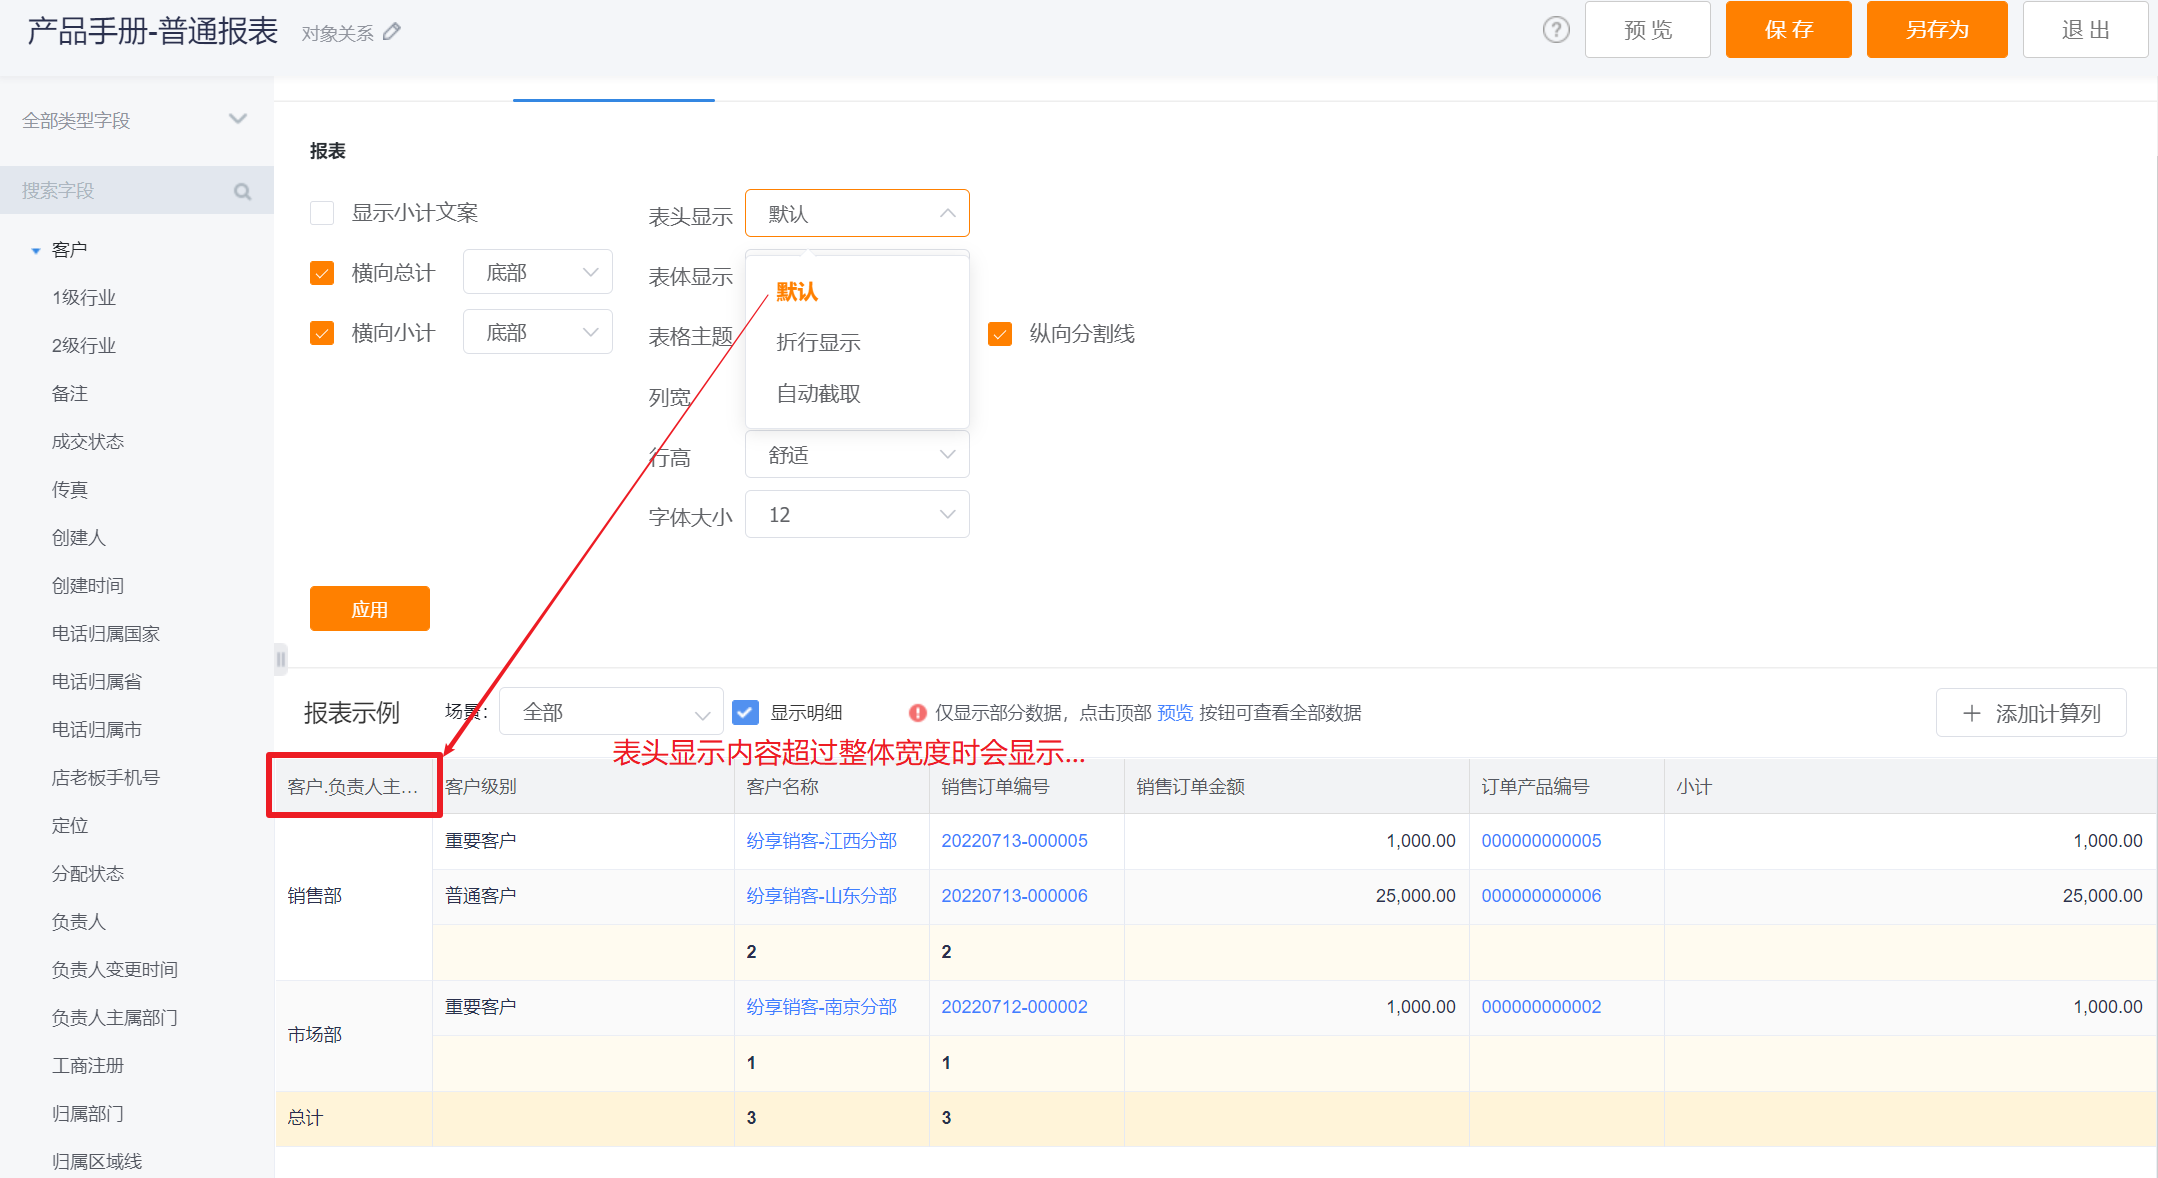
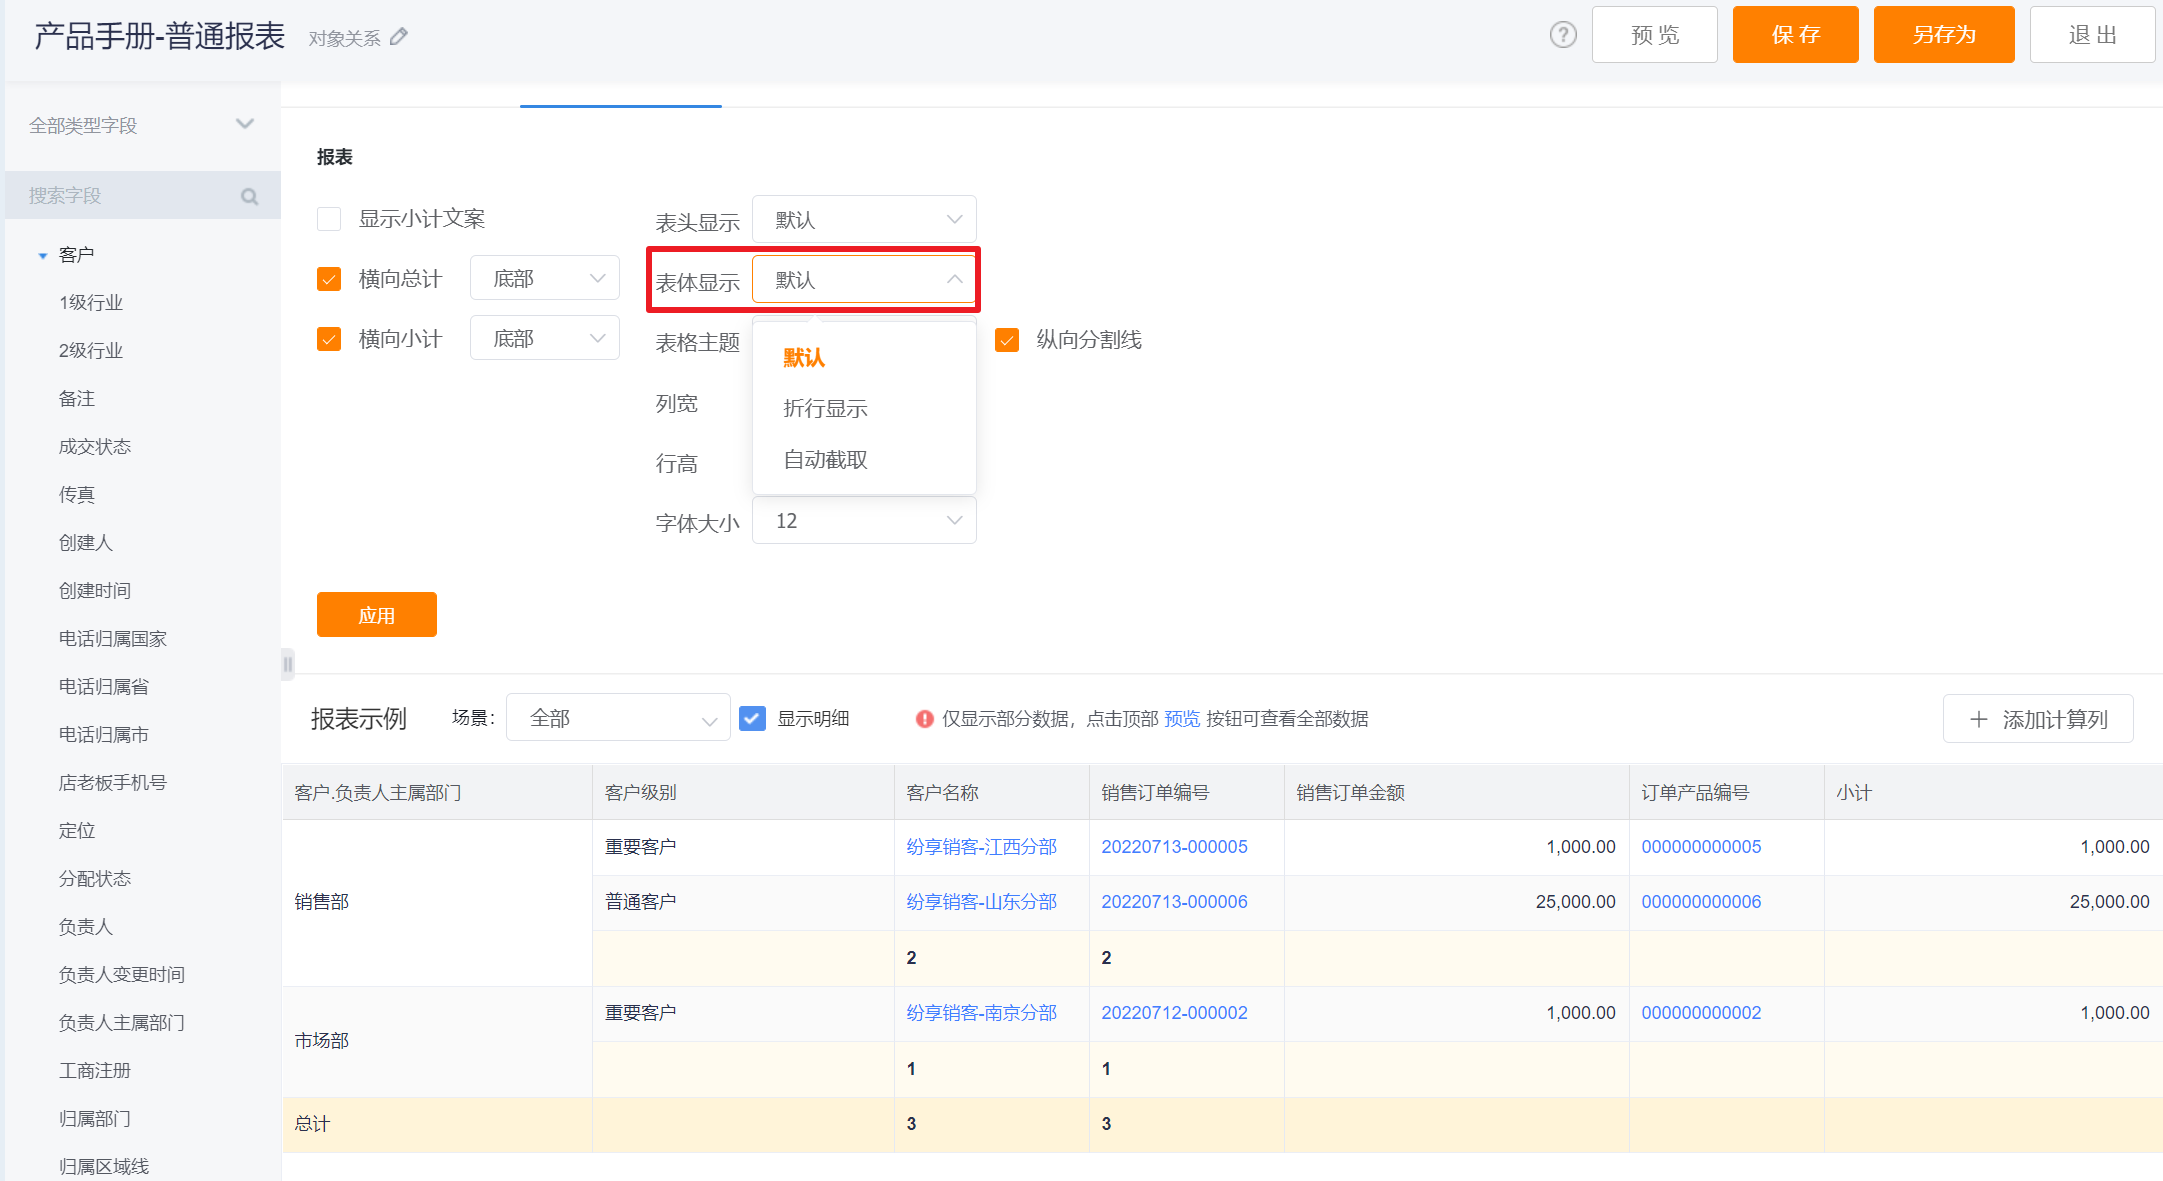
- Header Display: For the setting of the table header, by default, it can be switched to folded line display and automatic interception
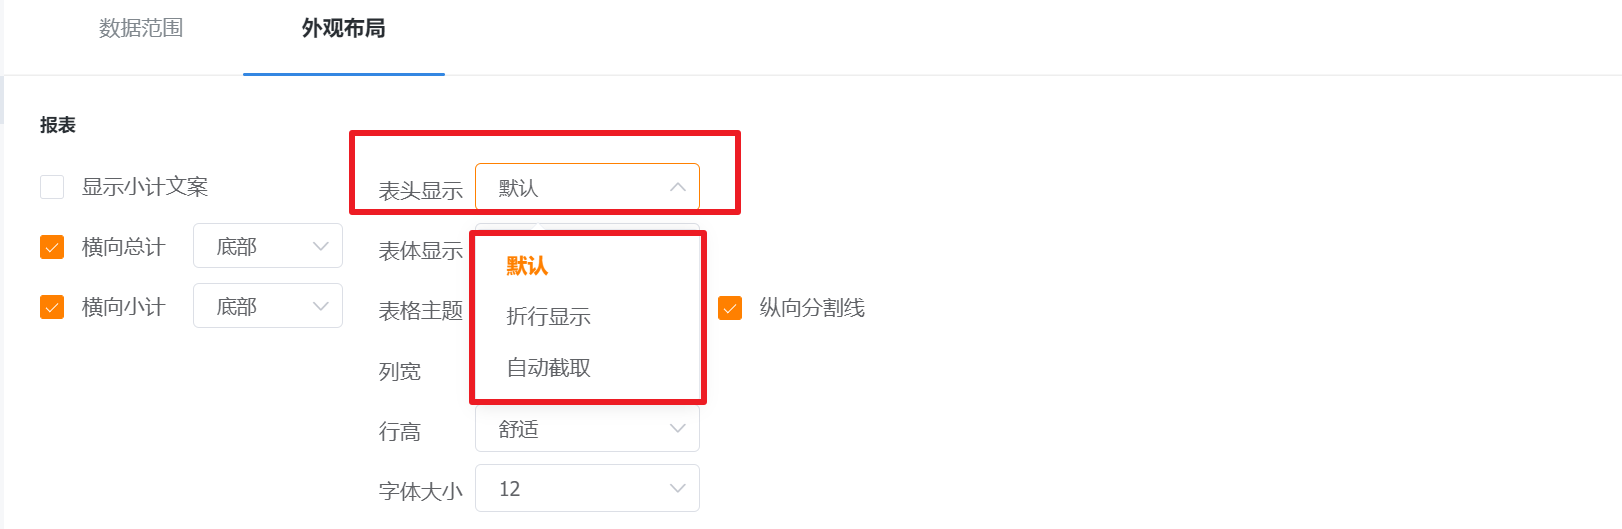
- Default: Same as the existing report display logic, display according to the overall width of the table, when the content exceeds the table width, display...
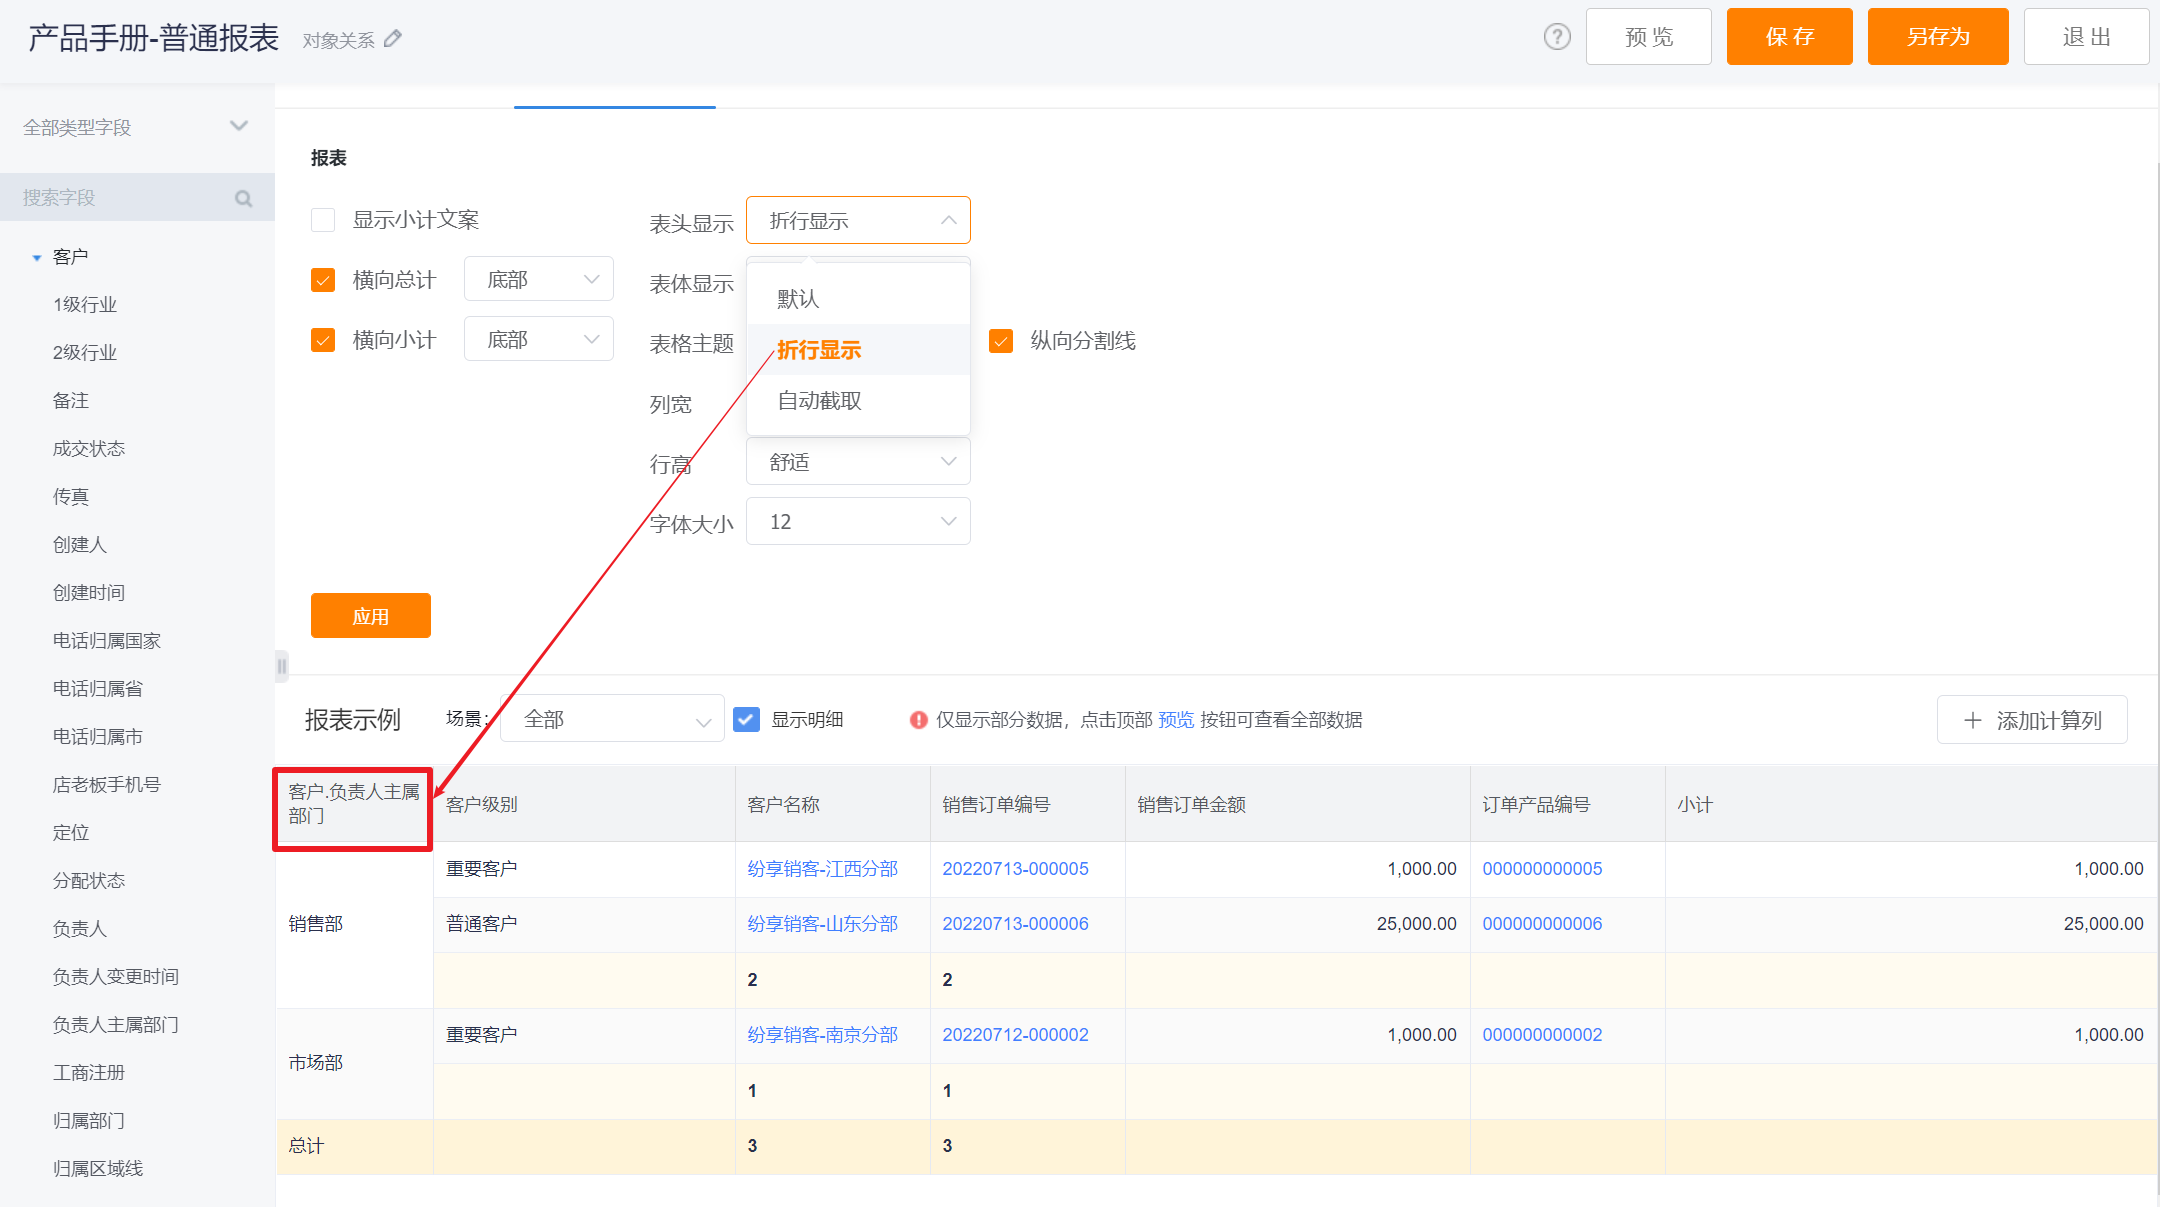
- Line-break Display: display according to the overall width of the table, when the content exceeds the width of the table, it will be displayed in a folded line
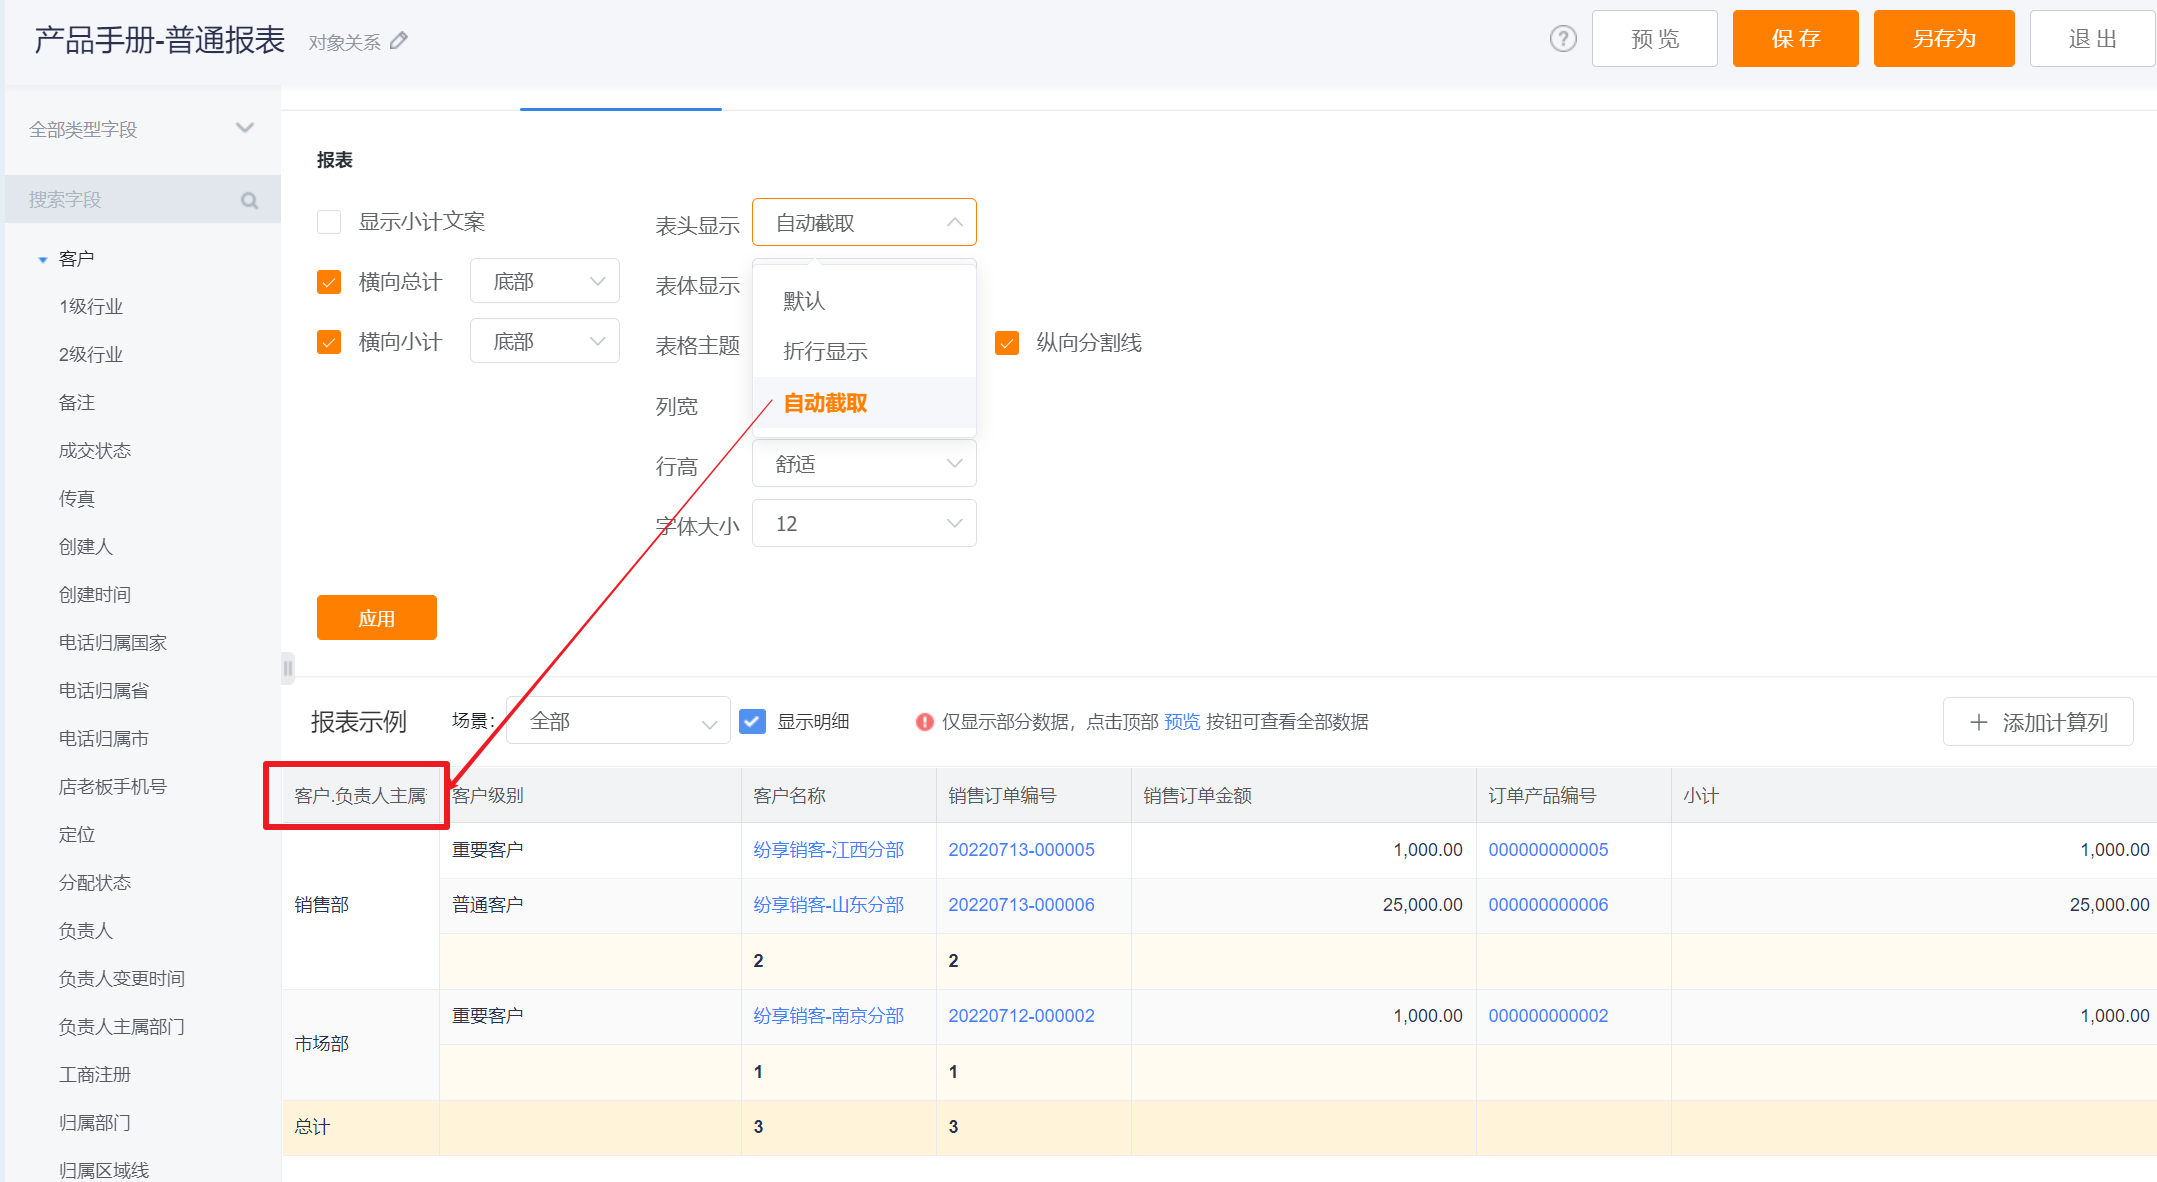
- Automatic Interception: display according to the overall width of the table, when the content exceeds the width of the table, automatic interception does not display the following content
- The body display is the same as the header configuration, please refer to [Header Display] for details
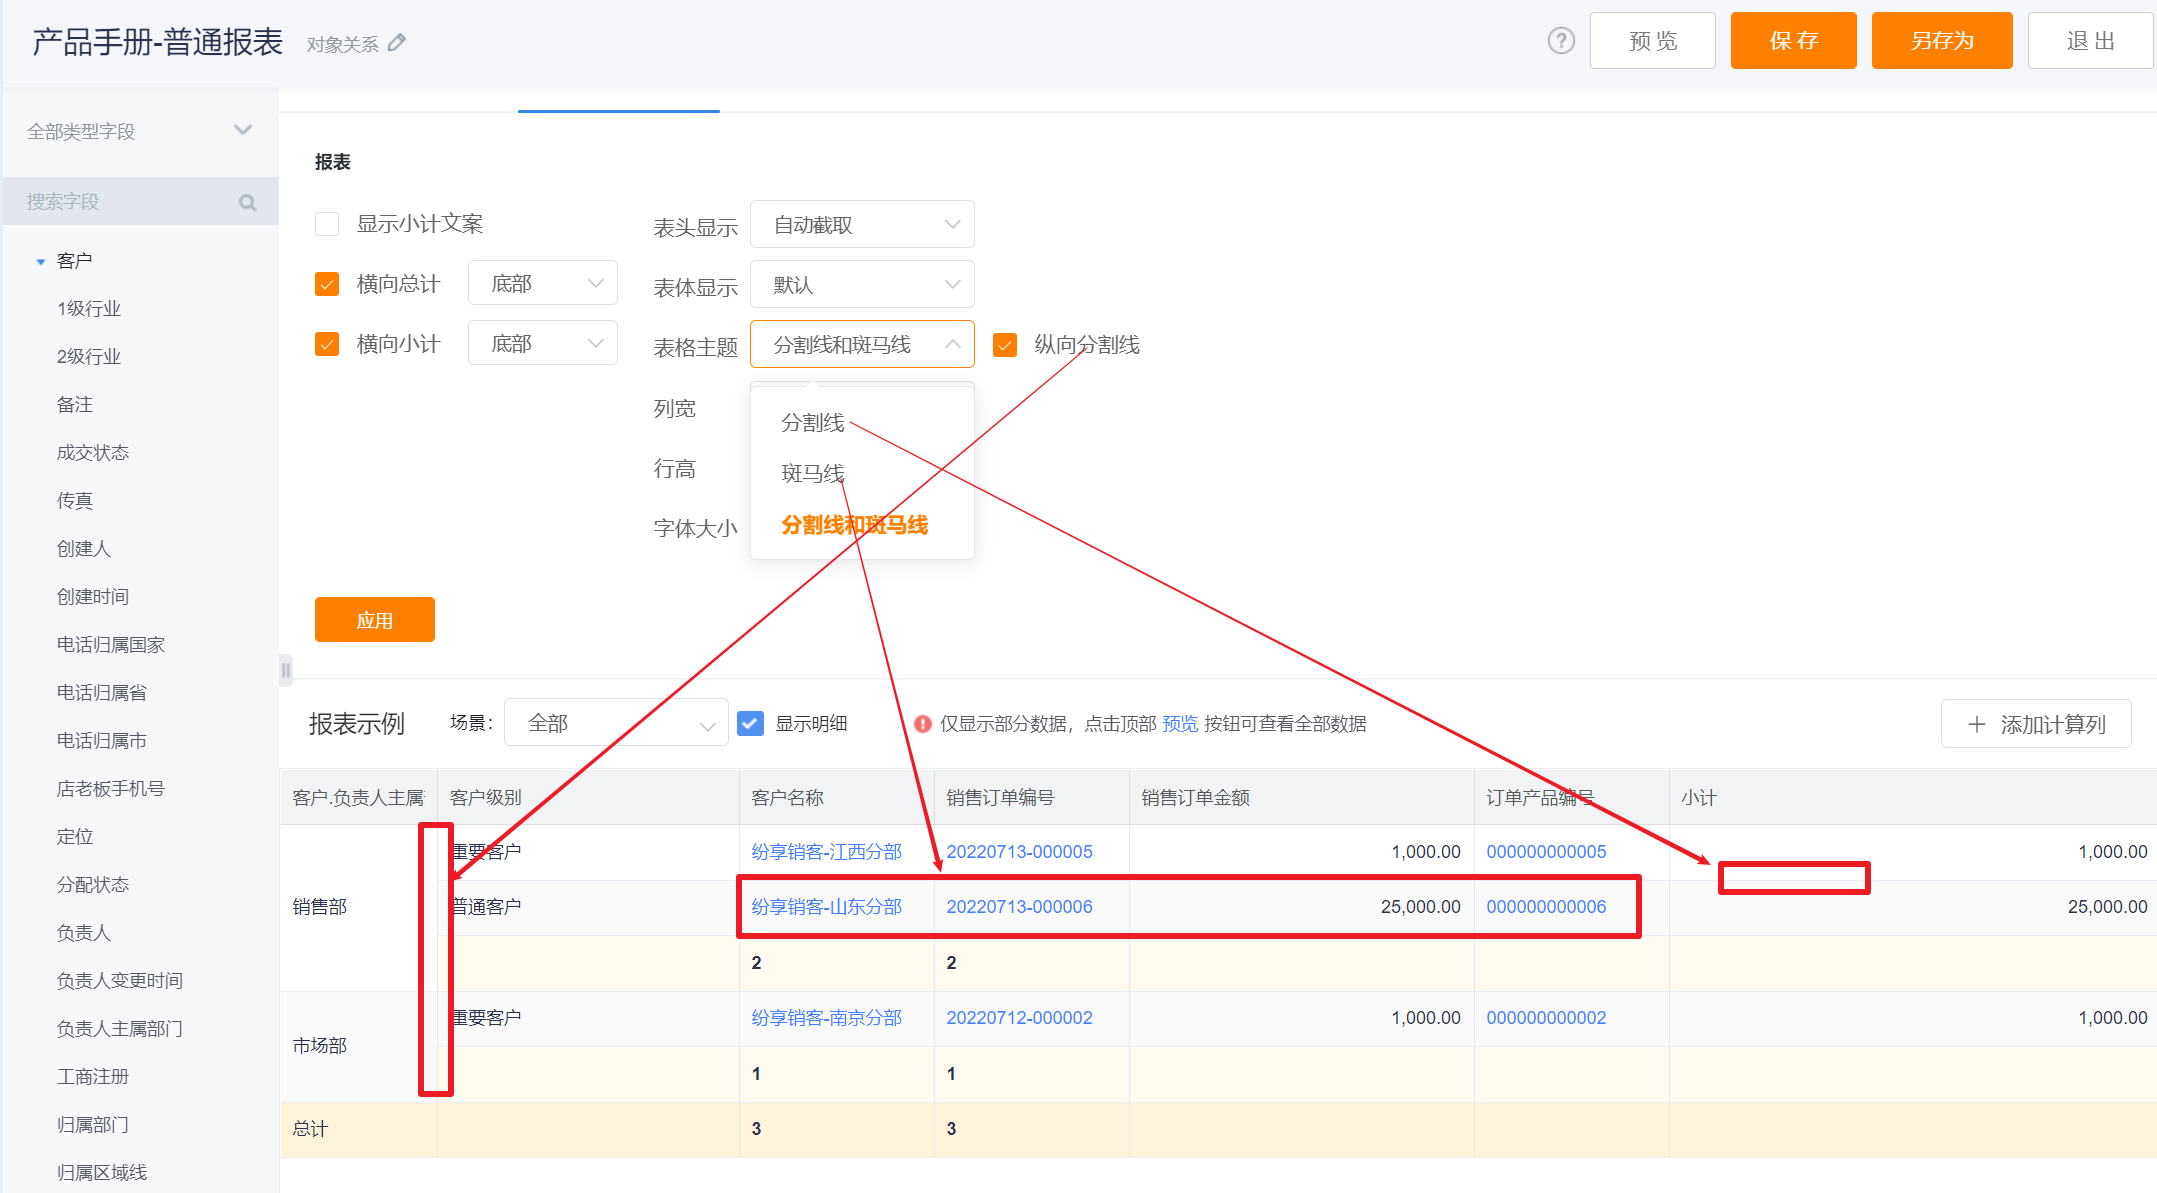
- Table Theme: For the setting of the overall display style of the table, users can configure whether to display dividing lines, zebra crossings, and vertical dividing lines. The default is to display split lines and zebra crossing, and at the same time check Show Vertical Split Line
- Split Line & Zebra Crossing: Split line and zebra crossing are displayed at the same time
- Split Line: only display the separation line
- Zebra Crossing: only display zebra crossing
- Vertical Split Line: When the split line is displayed, you can further set whether to display the vertical split line. When configuring the zebra crossing, the vertical split line will not be displayed
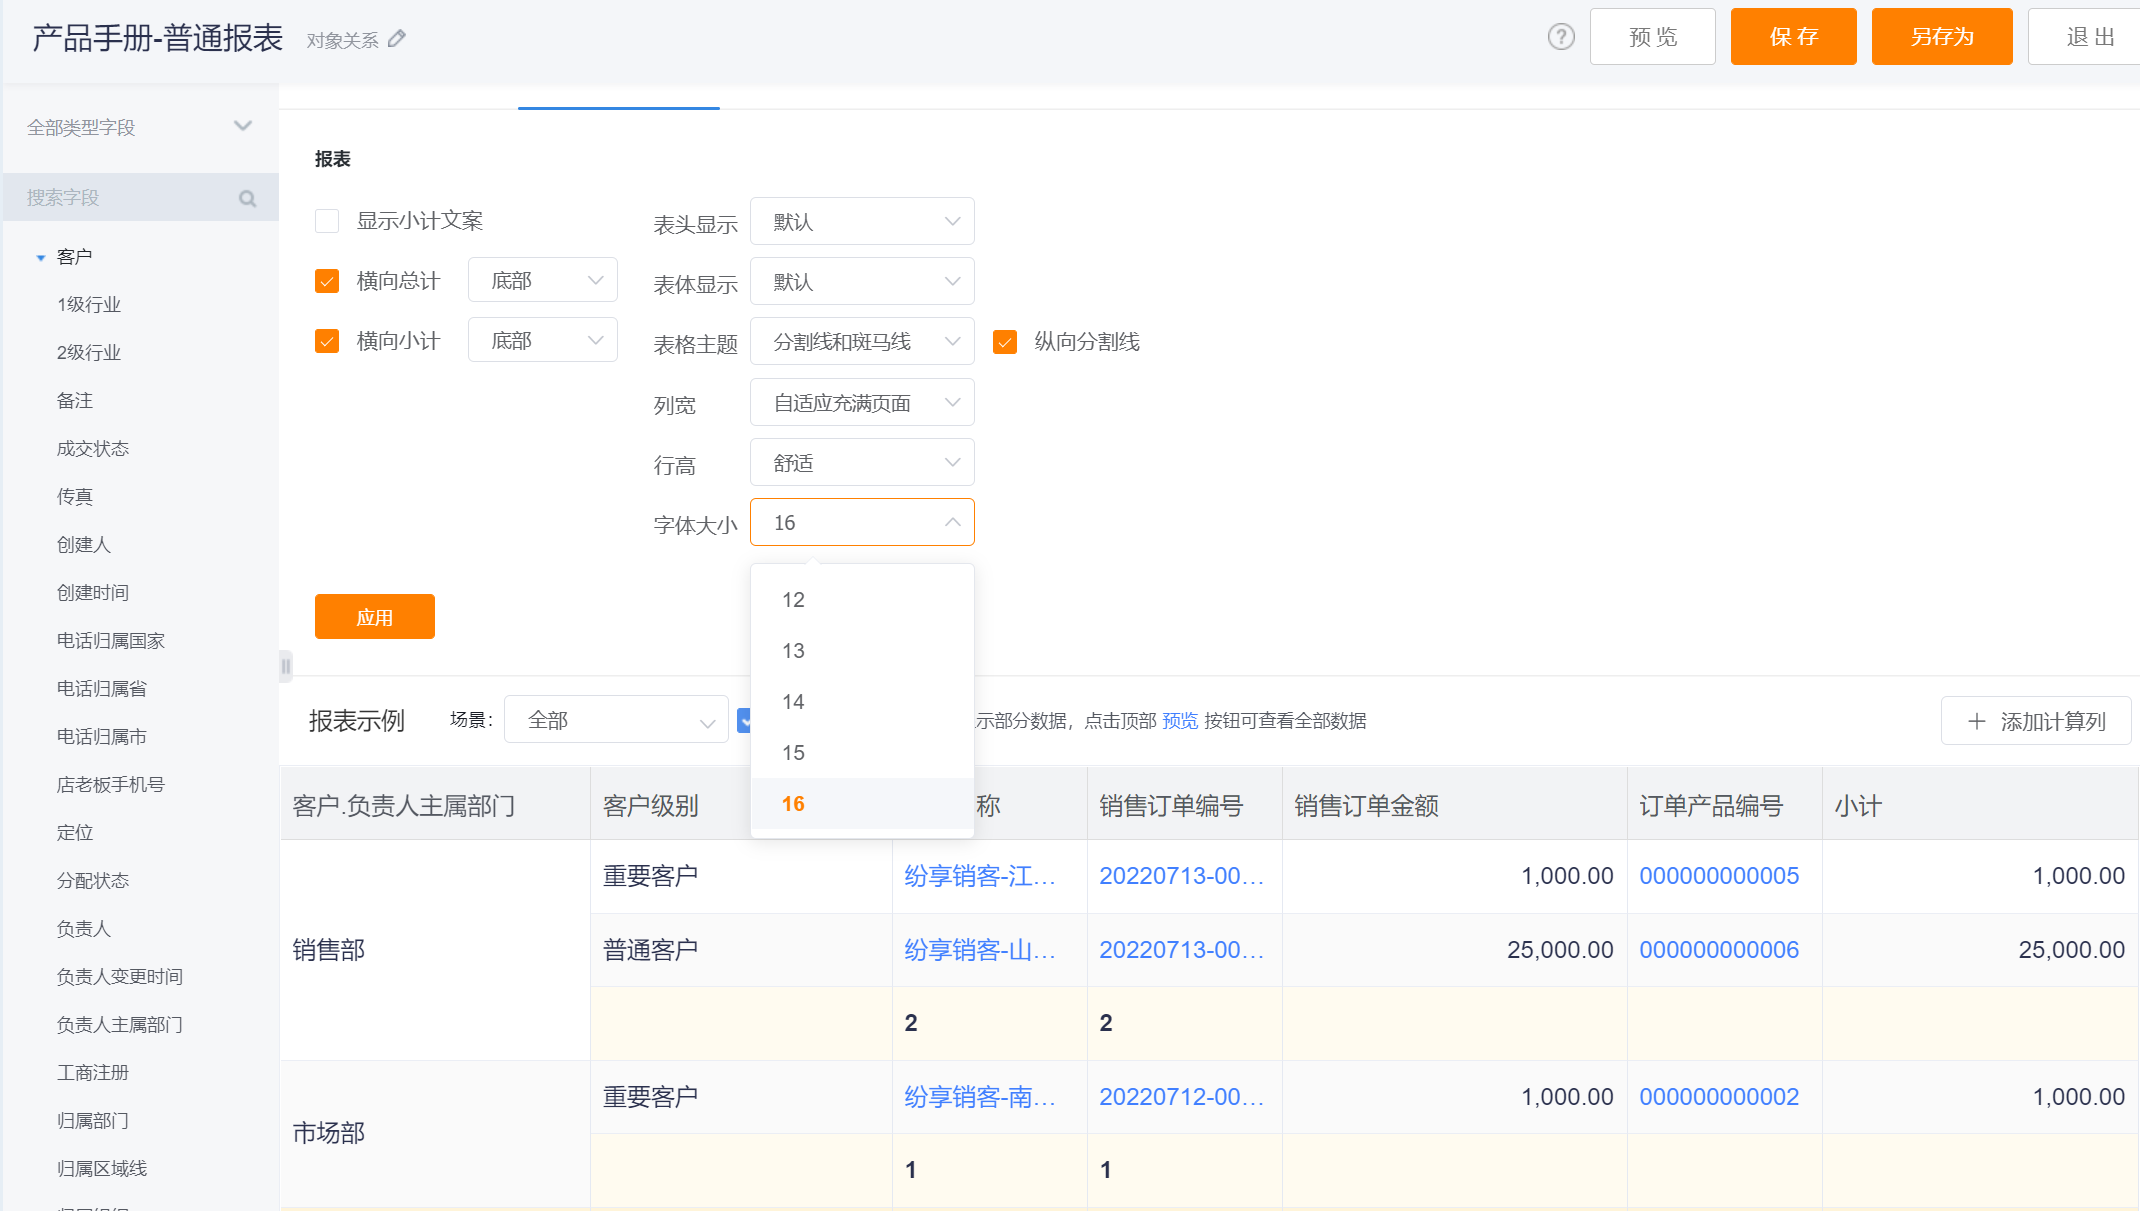
- Font Size: the default is 12, can be switched to 13, 14, 15, 16 display
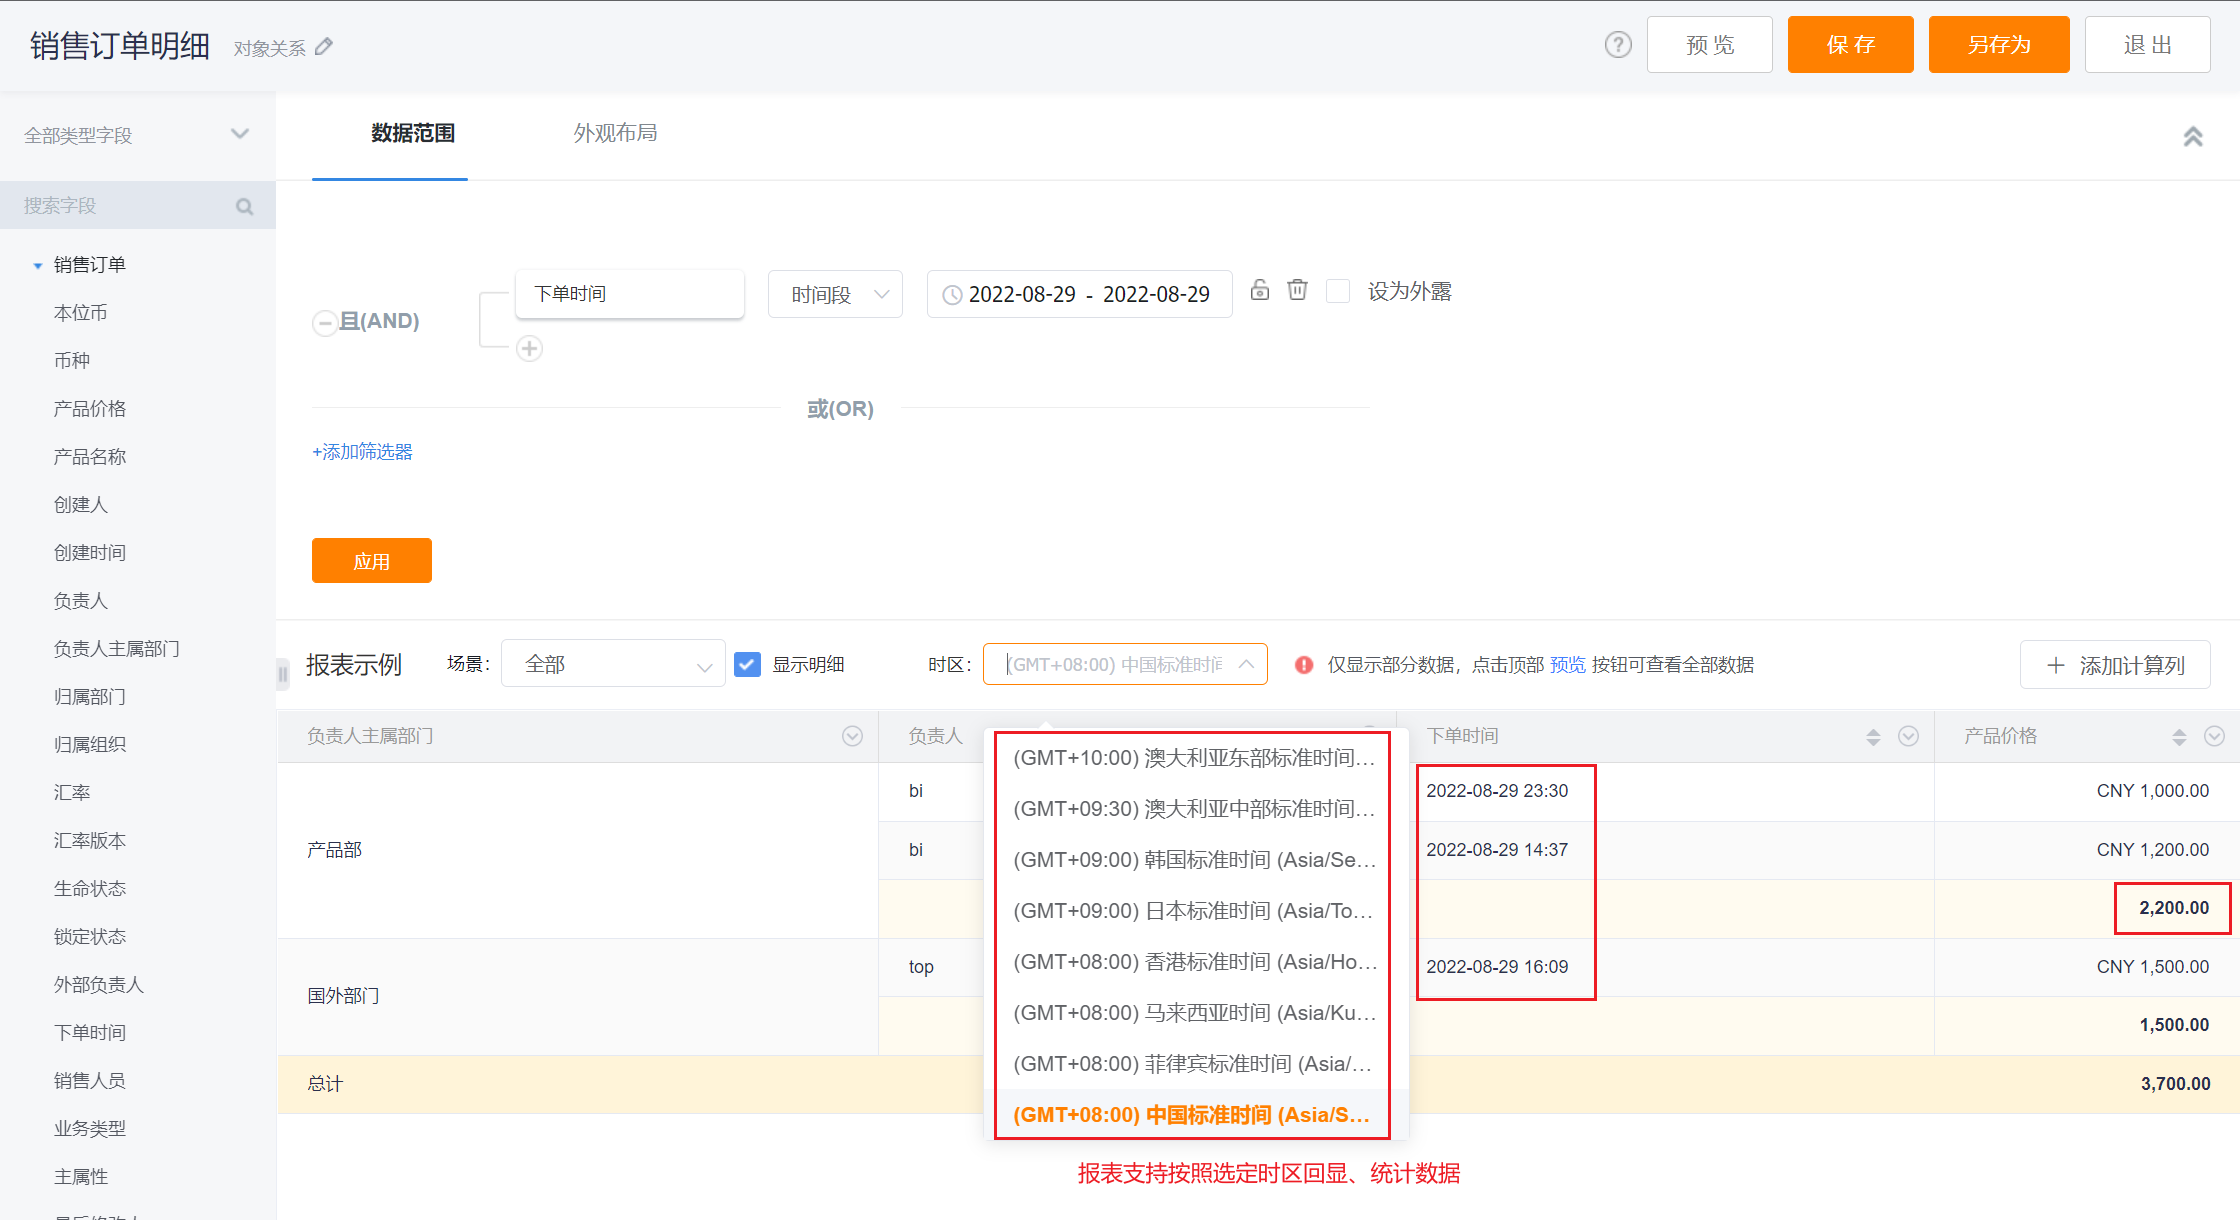
2.7 Time Zone Filter
- If the enterprise has enabled the multi-time zone function. Time zone filter is supported when editing a report. After the time zone is filtered, the report will echo and count data according to the selected time zone. If the user selects [Business Occurrence Time Zone], the data will be echoed according to the time zone in which the business actually occurred.
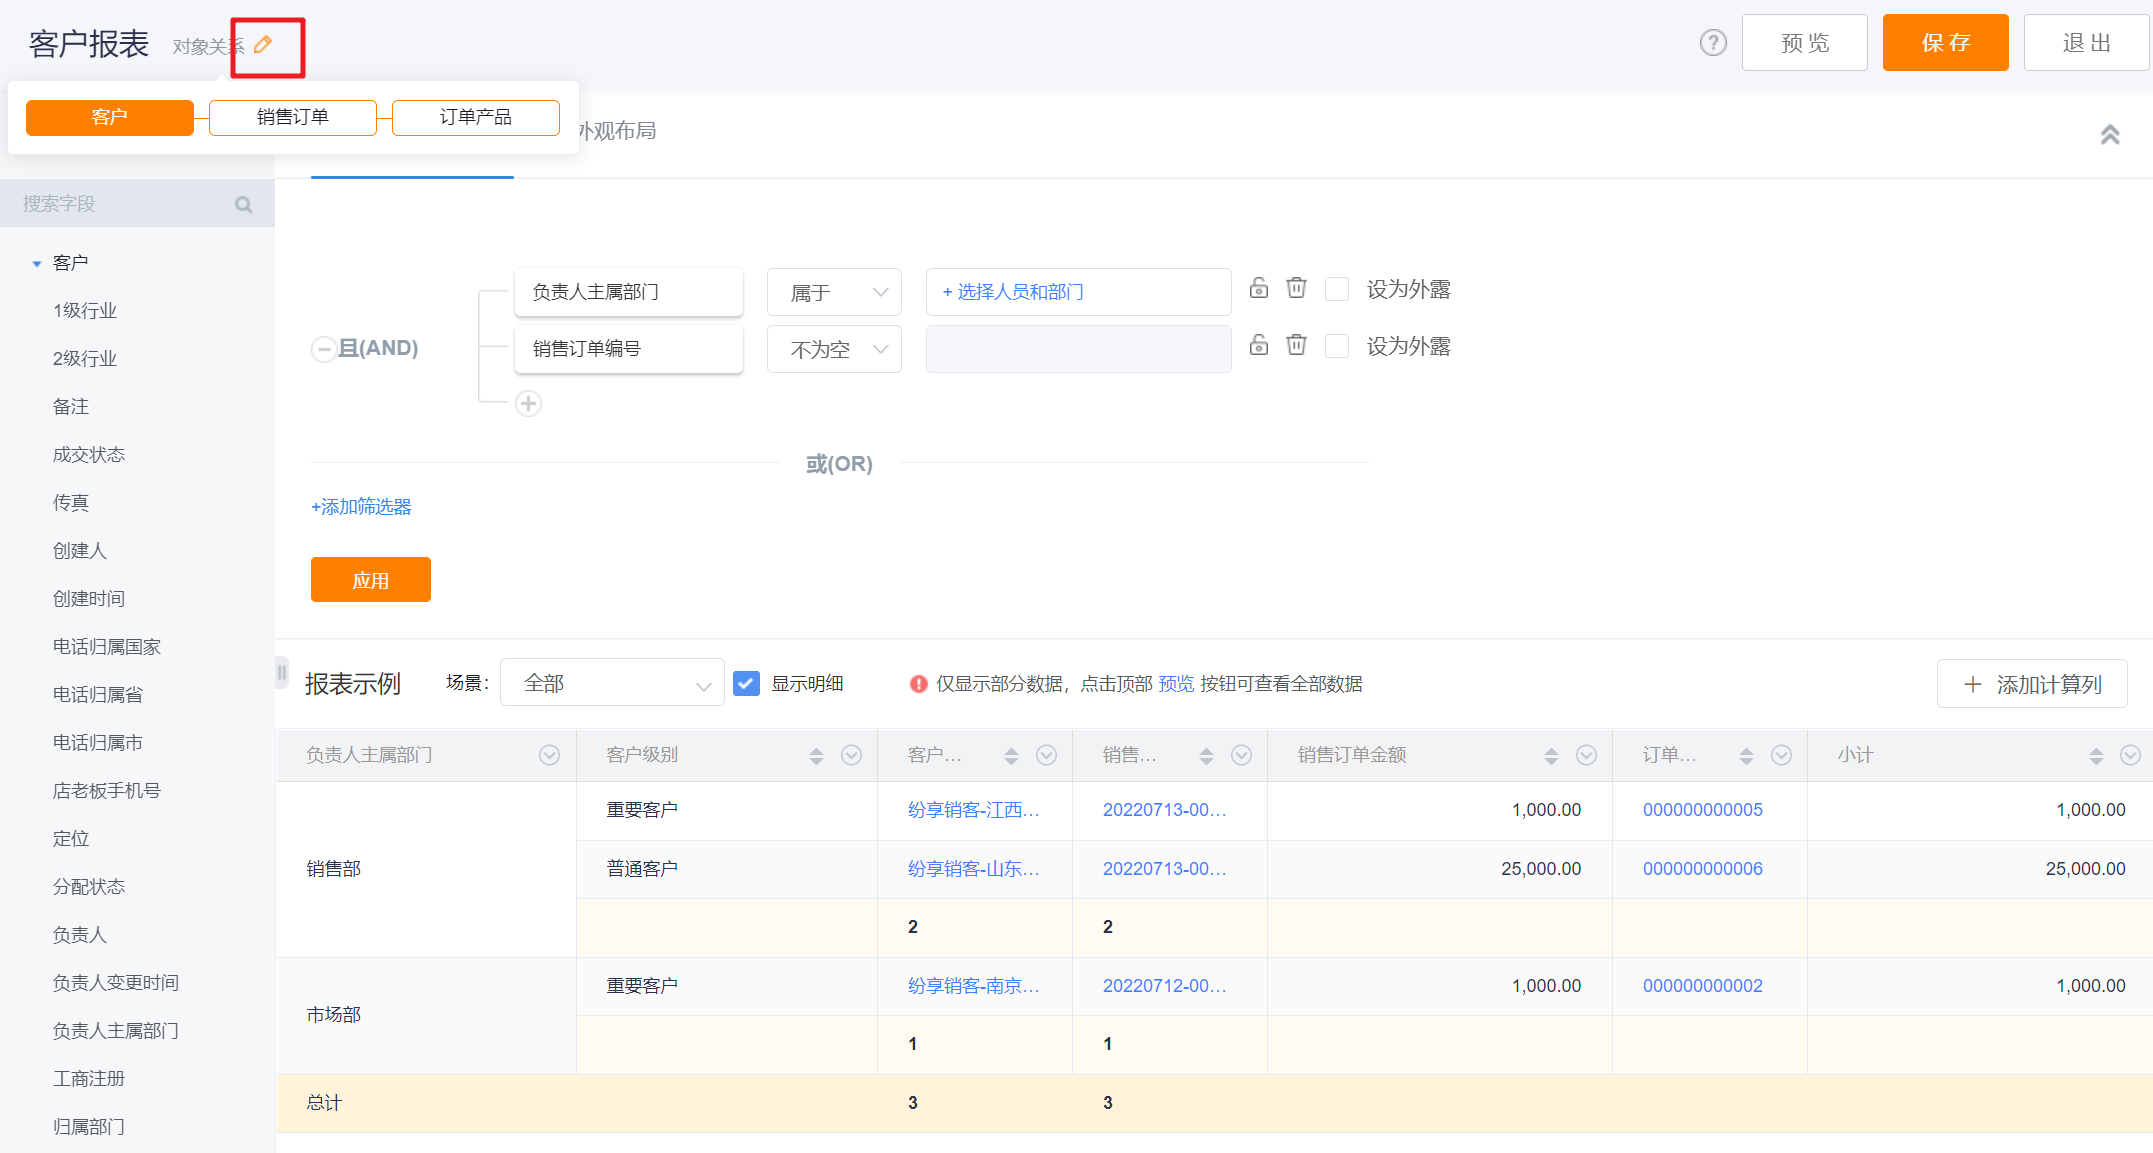
2.8 Modify Object Relationship
- The report supports modifying the object relationship in the editing state, and the user can replace the object that needs to be changed
- Applicable Roles: report administrator, CRM administrator

3. View Common Reports
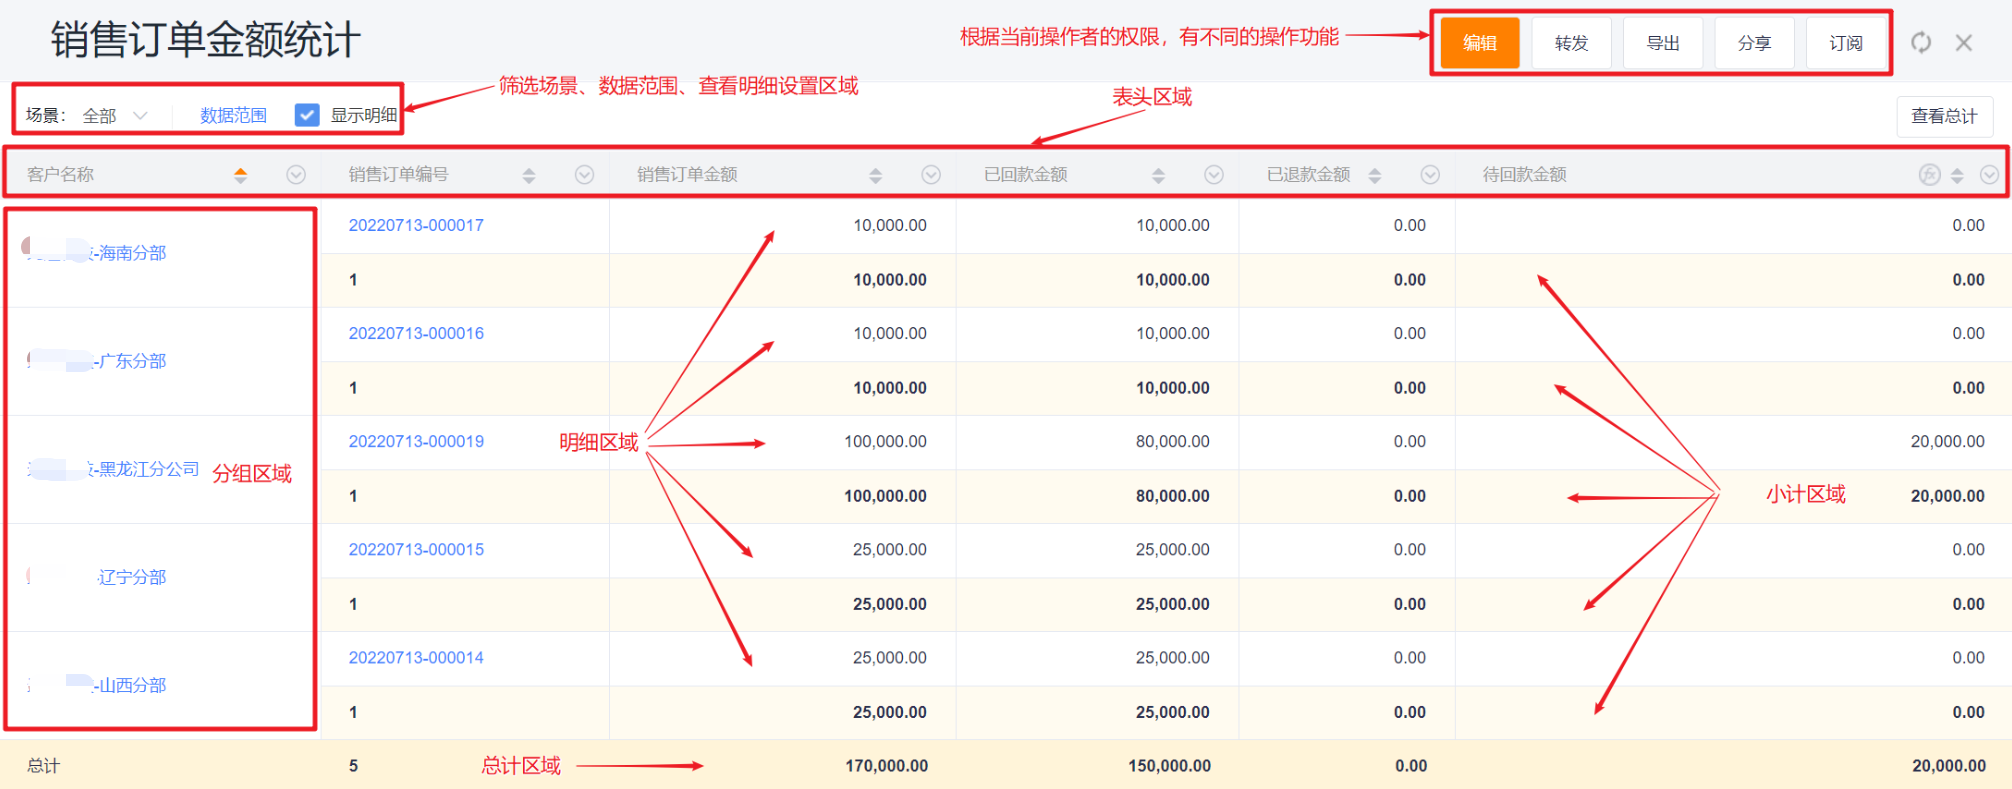
- Report Viewing Page Layout:
- Filter Scene Tag: used to switch between different scenes.
- Header Area: Sorting and data filtering can be performed for each column.
- Data Range: You can modify the preset filter conditions and adjust whether it is exposed.
- Data Display Area:
- Group Area: display all levels of grouping in a combined manner.
- Details Area: Display the detailed data in the group in the form of rows.
- Subtotal Area: carry out data statistics for groups of all levels layer by layer.
- Total Area: make overall statistics for all data.
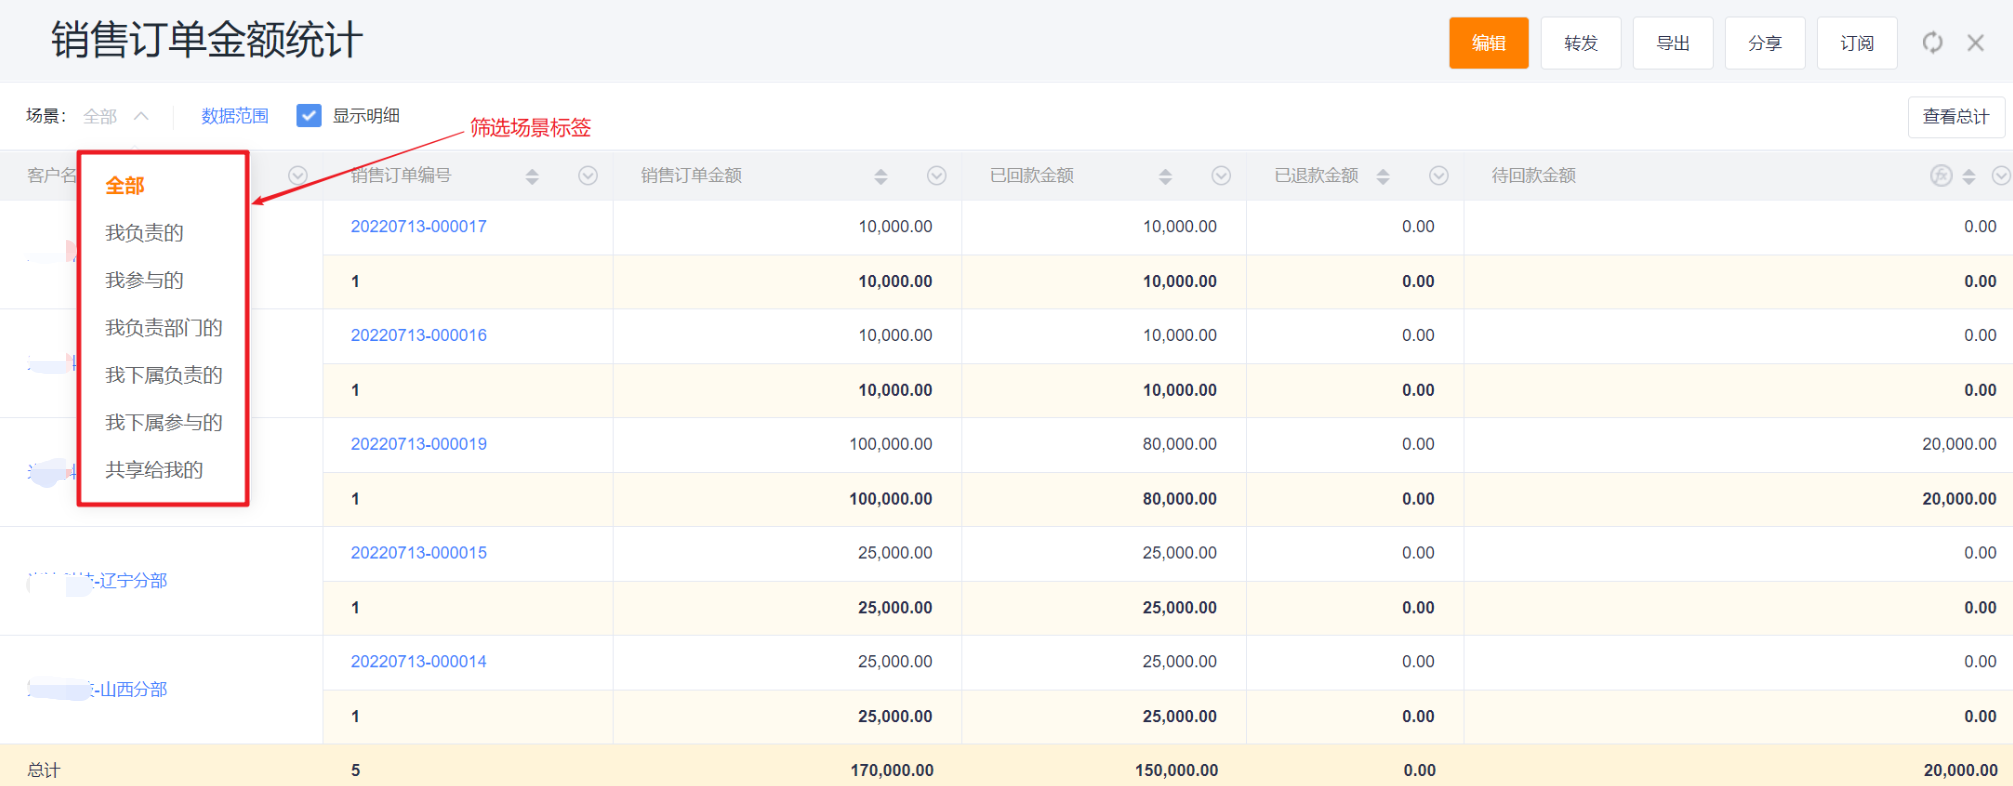
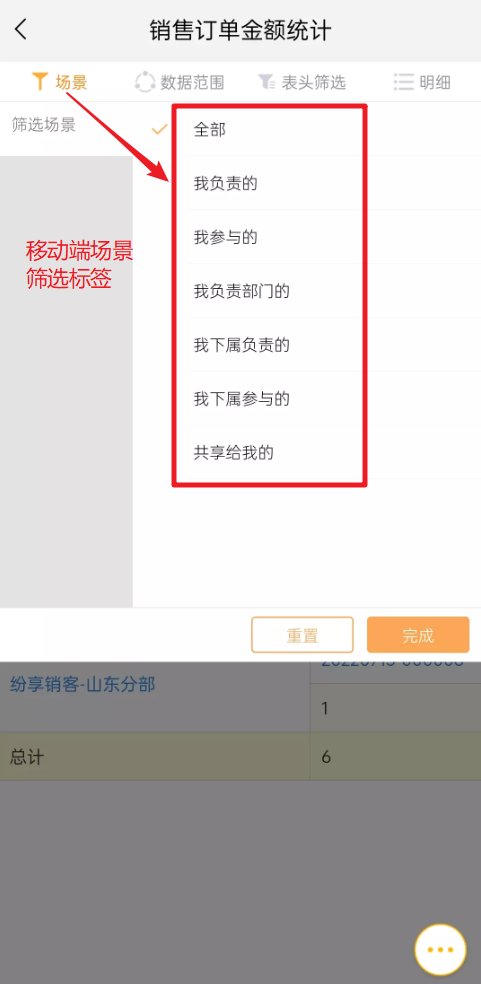
3.1 Scene Filter
- Switch scene tags to quickly view data in different scenes.
Display Effect on Web:
Display Effect on Mobile:
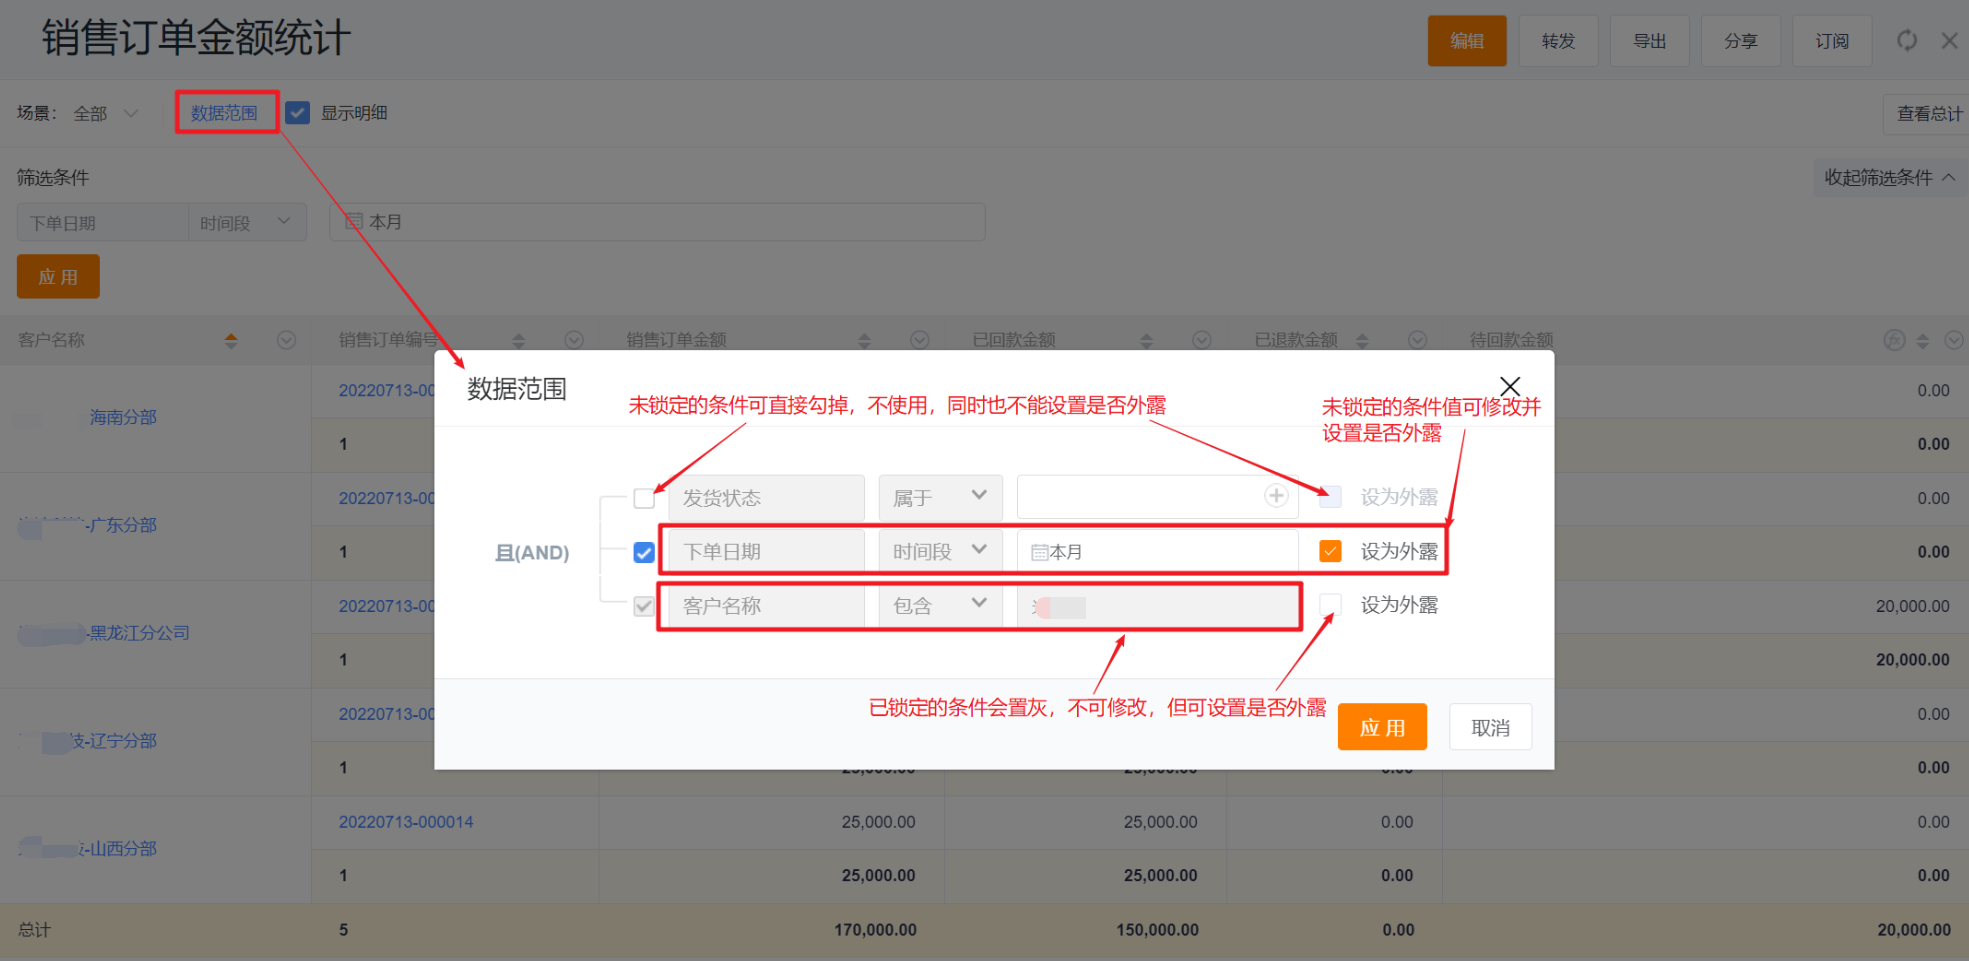
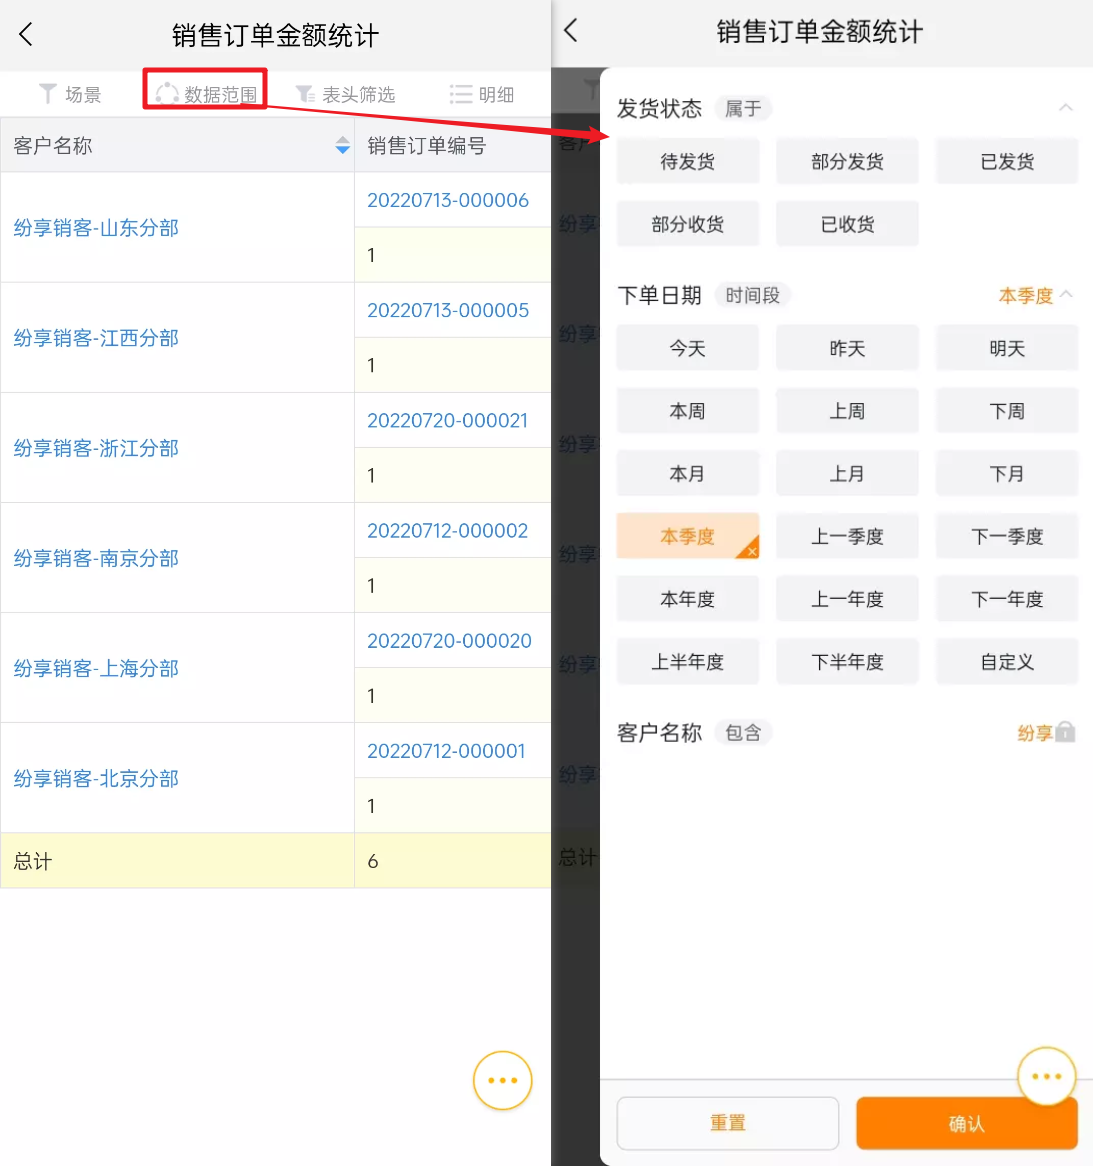
3.2 Data Range
- When viewing the report, you can modify the unlocked condition value in the data range popup and set whether to expose it.
The display effect on the web:
The display effect on mobile:
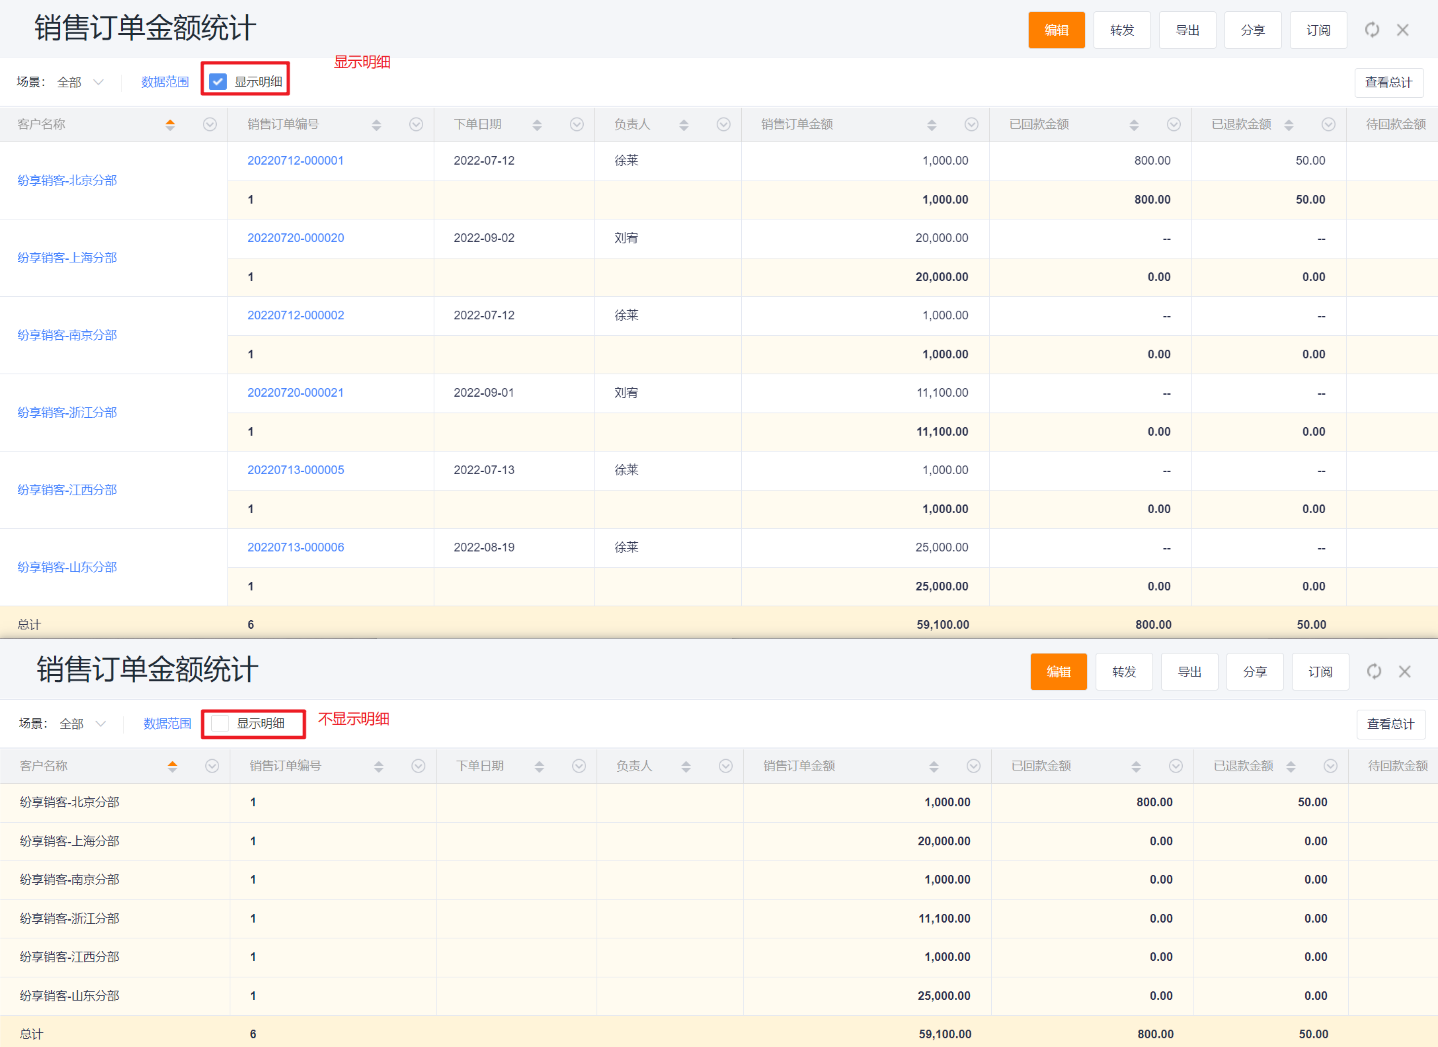
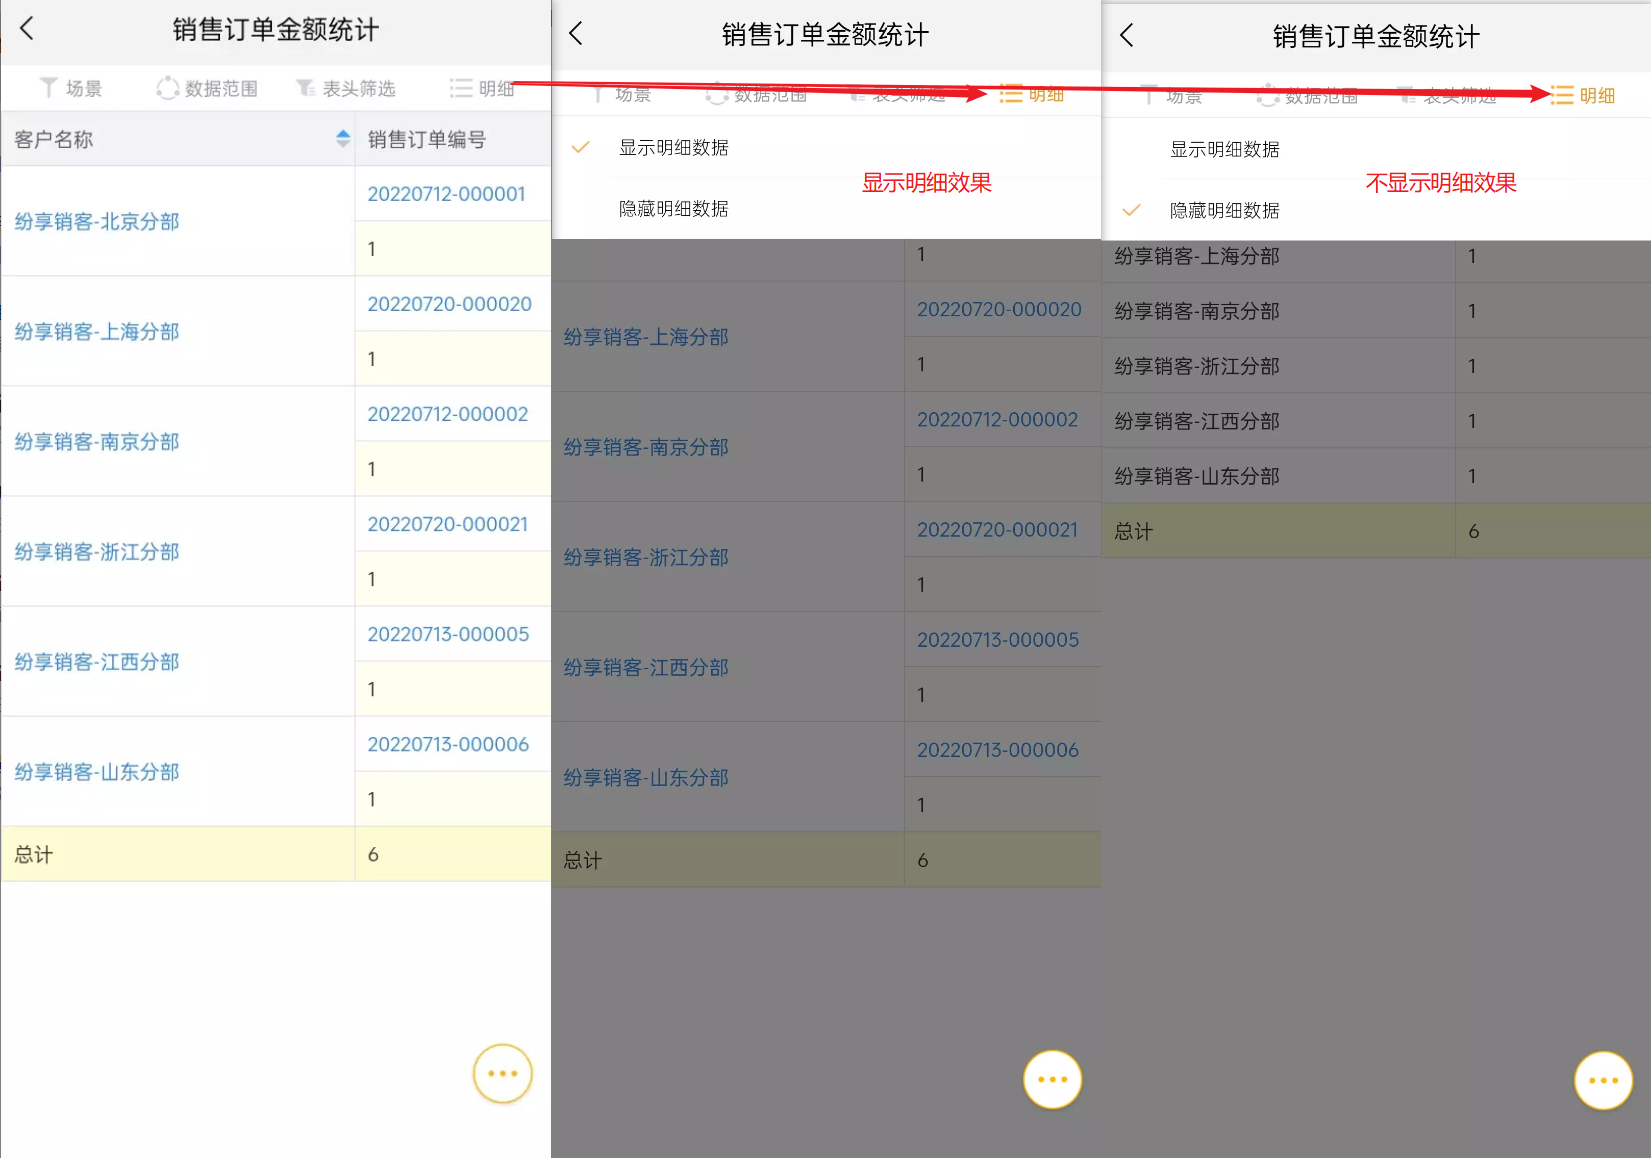
3.3 View Details
- When viewing the report, after the statistics method is set on the chart itself, you can check whether to display the details
The display effect on the web:
The display effect on mobile:
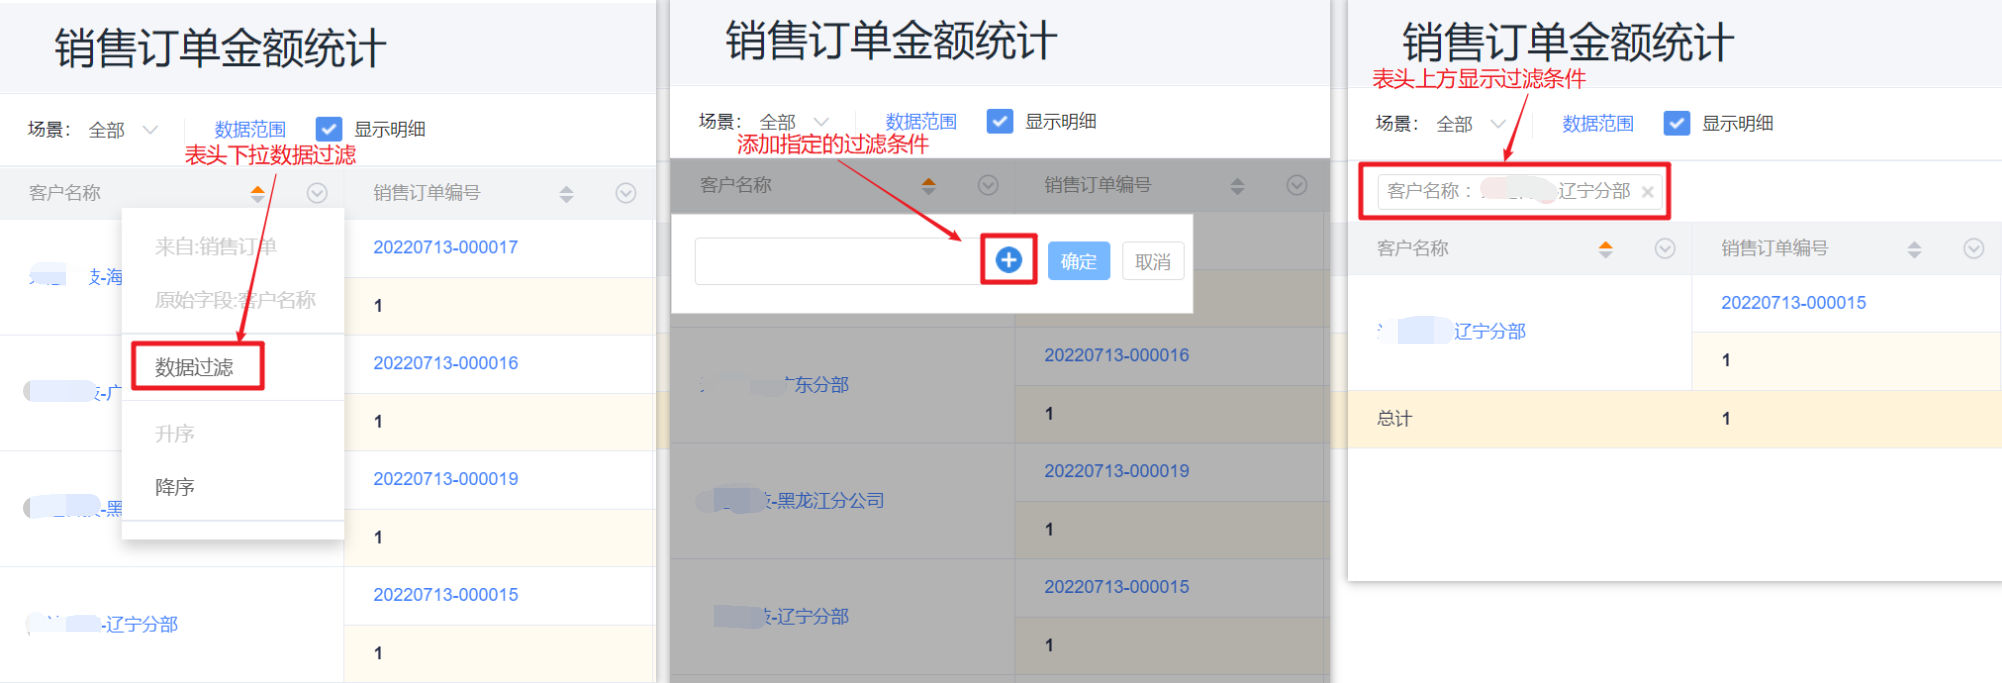
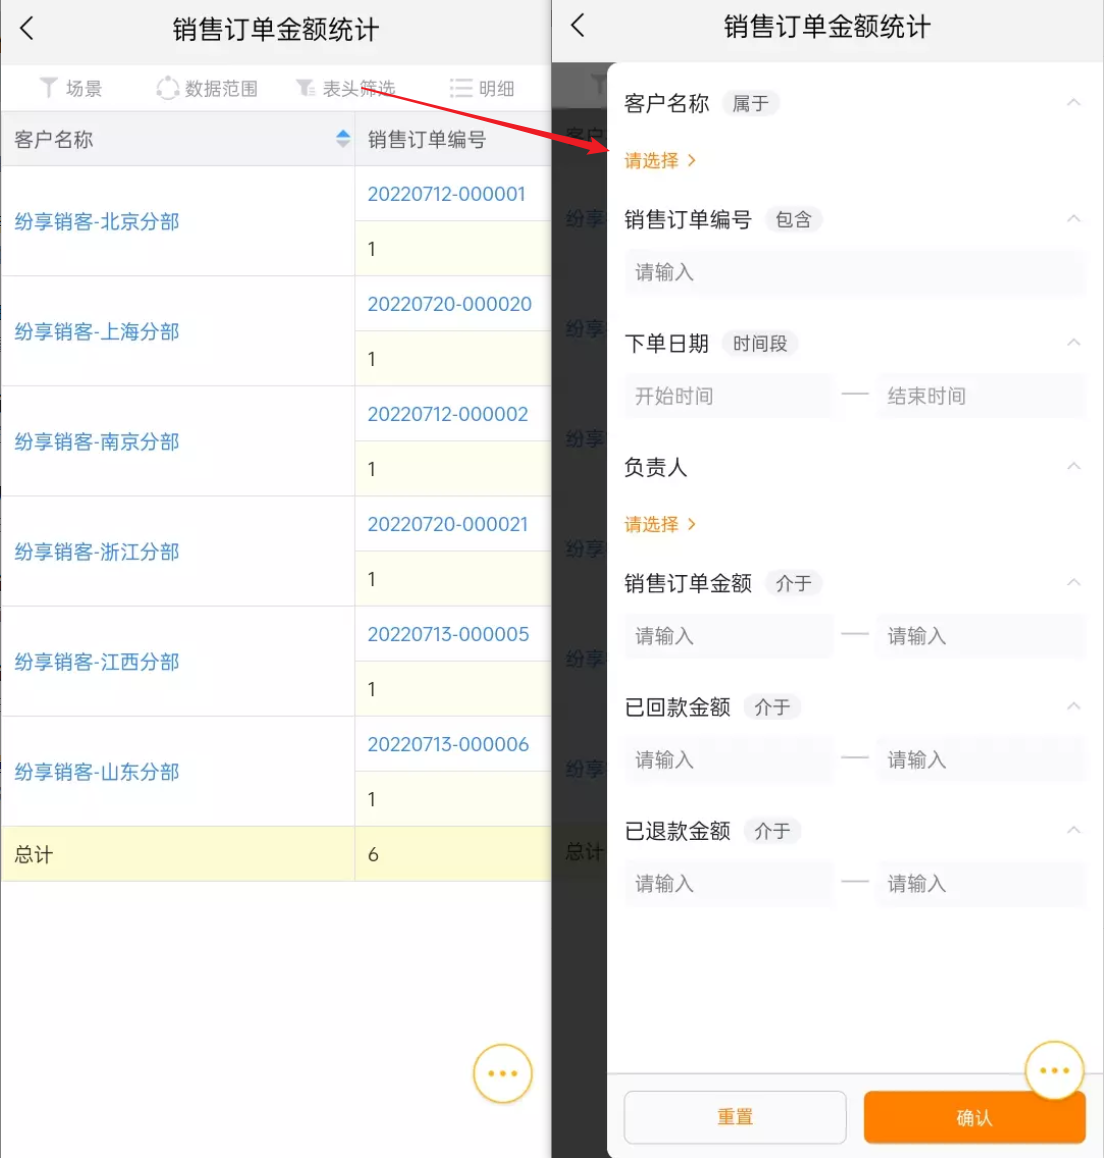
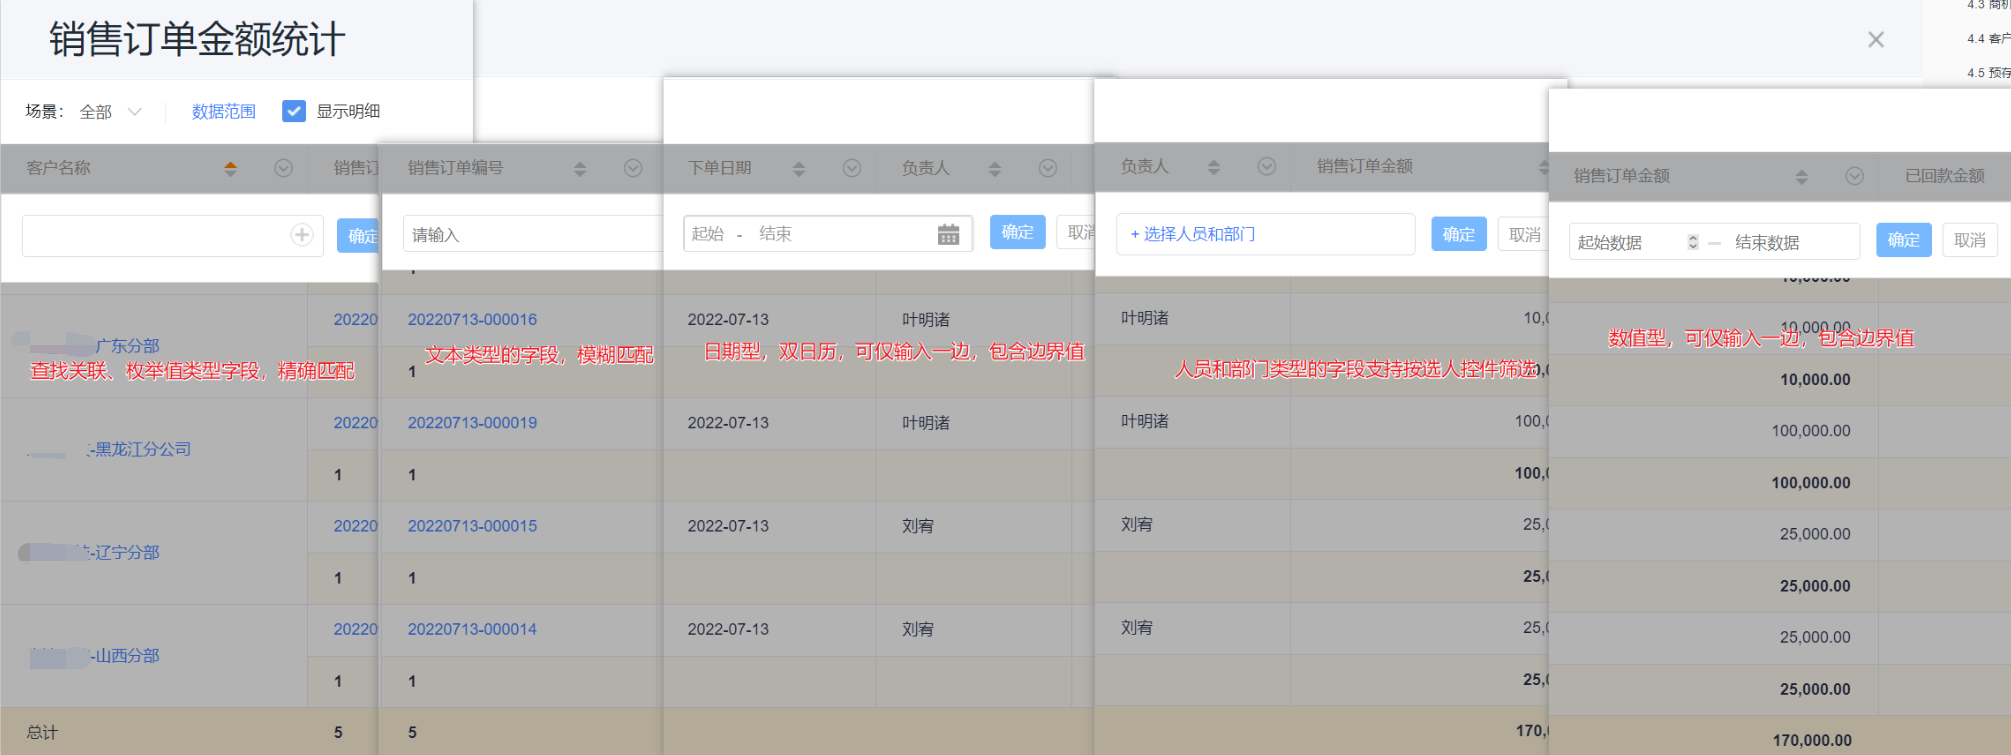
3.4 Header Data Filter
- When viewing the report, the data can be quickly filtered directly based on the table header.
- The set conditions will be displayed above the table header, click to edit, and X will delete.
- Depending on the data type of the current column, the input methods provided are also different.
The display effect on web:
The display effect on mobile: (list all header fields for filter)
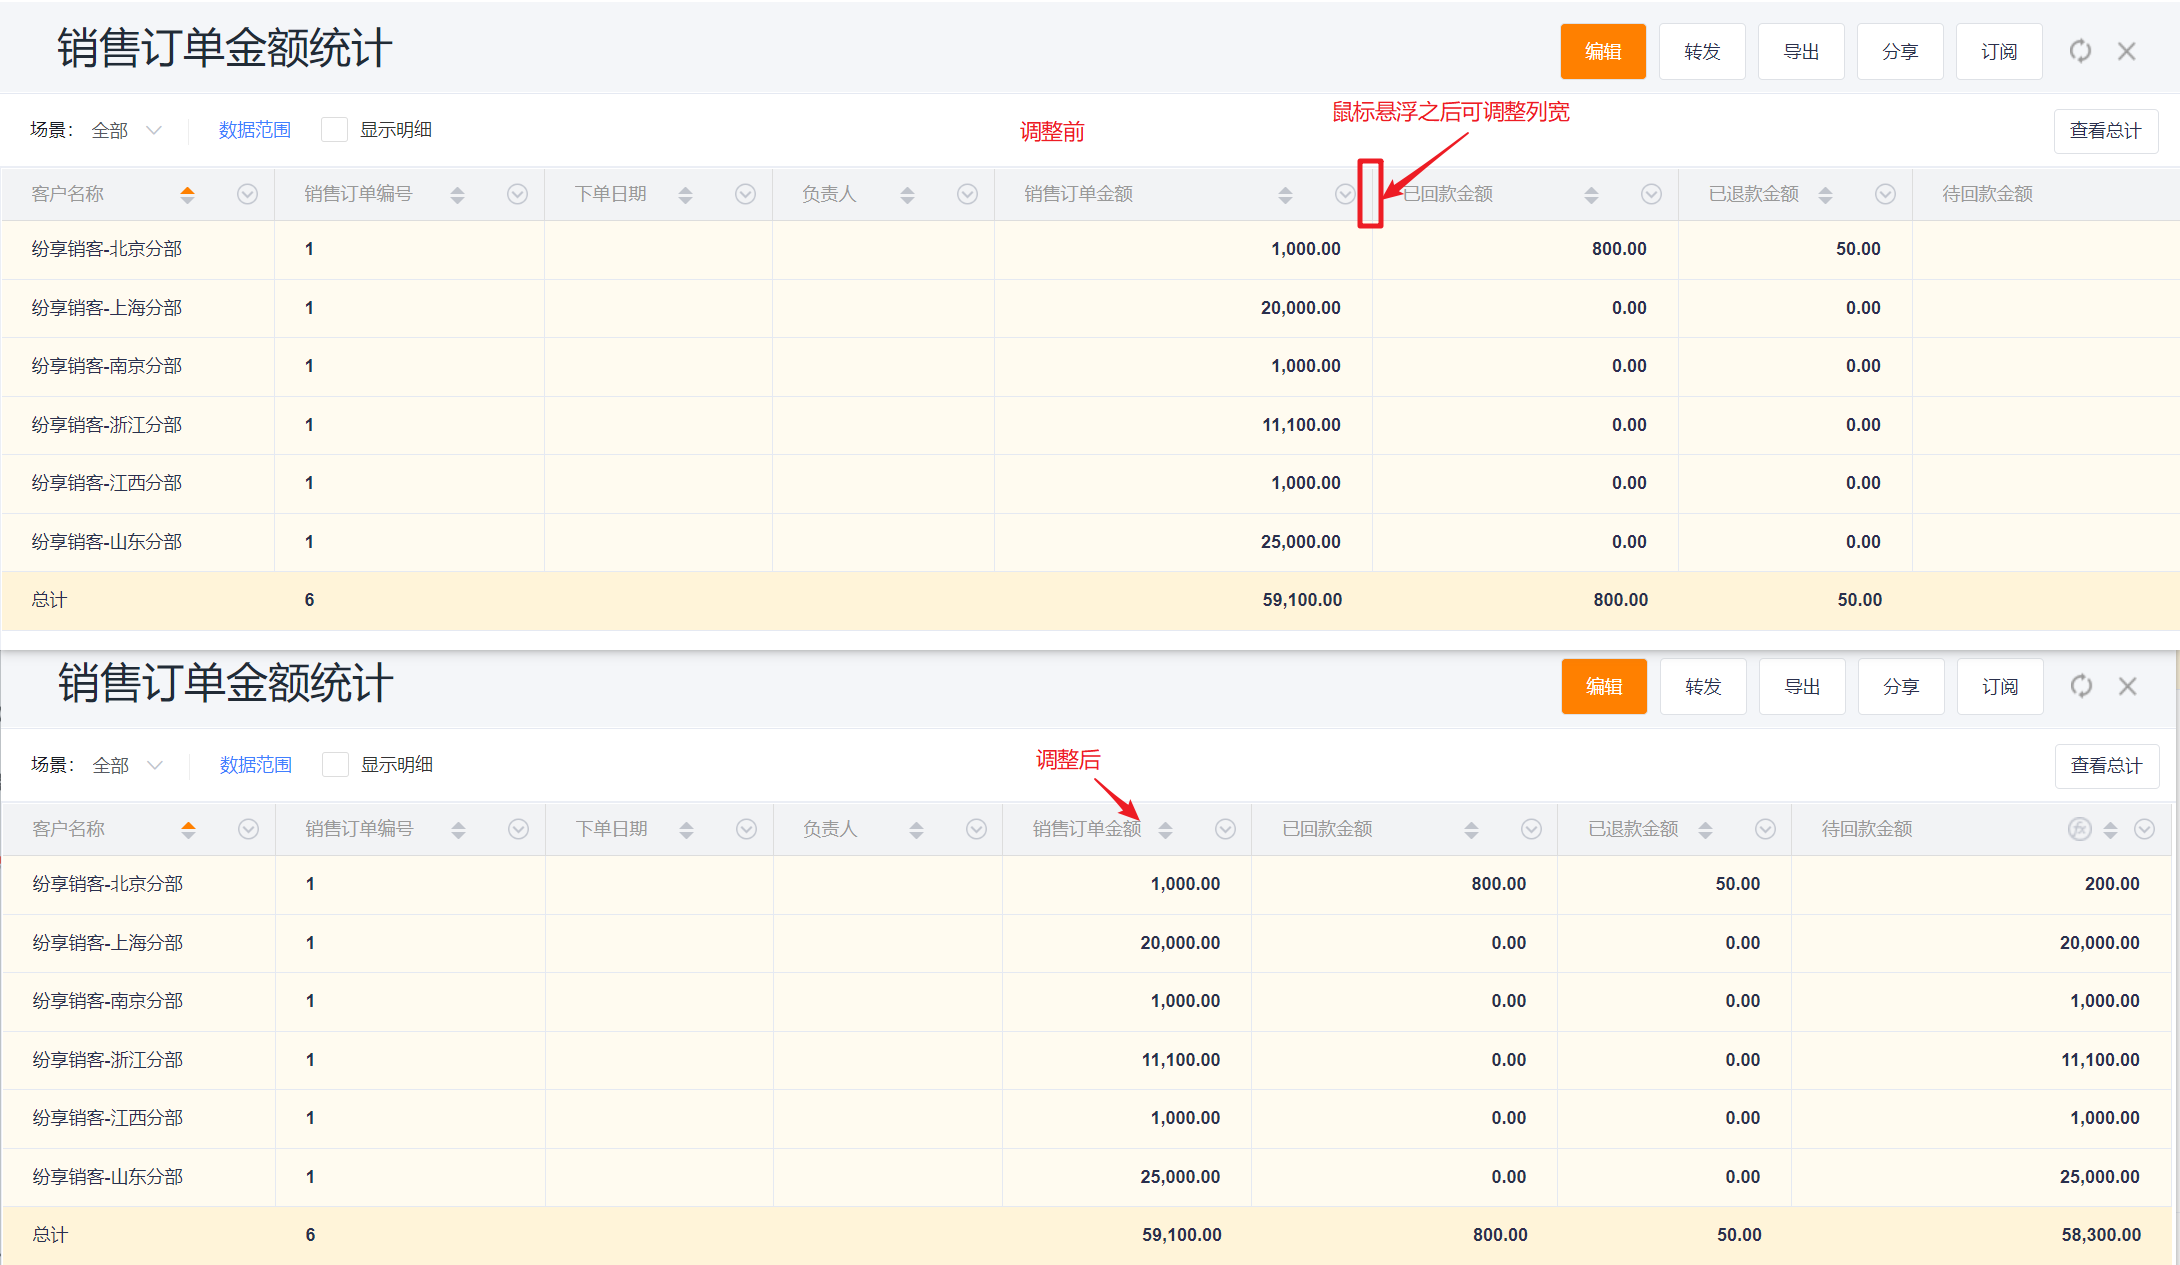
3.5 Adjust Column Width at Viewing State
- When the mouse hovers between two columns, the column width can be adjusted by dragging the mouse, which only takes effect for this viewing state
The display effect on web:
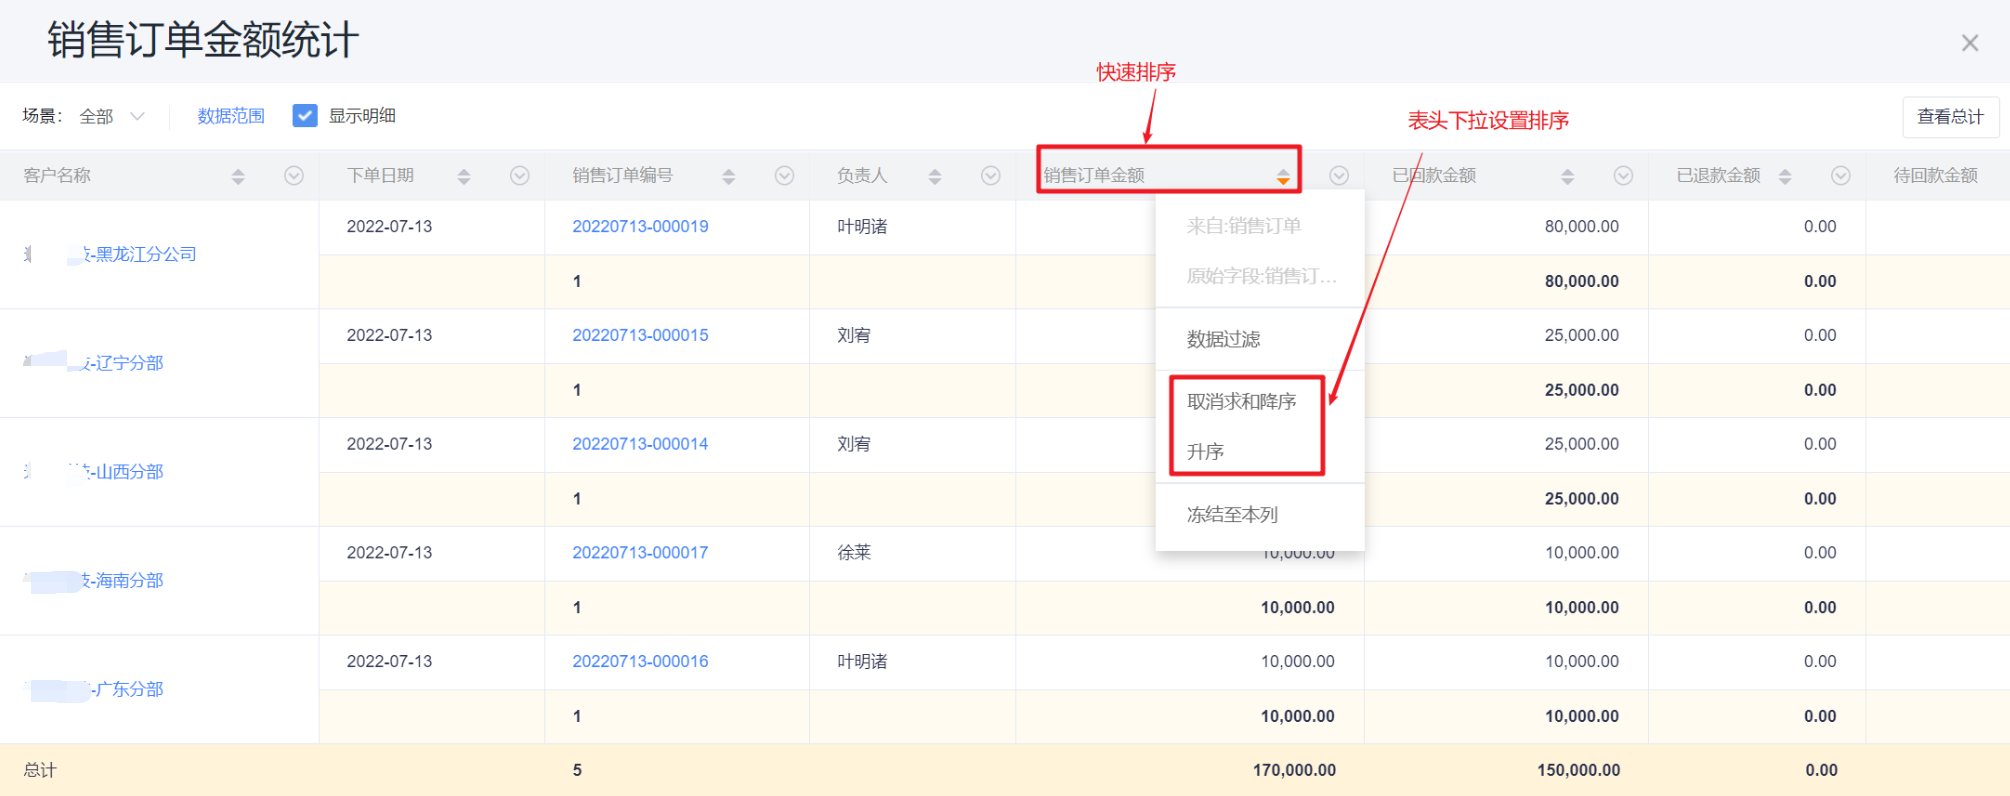
3.6 Group Field Sorting
- Use the header drop-down to set ascending, descending, and cancel sorting.
- Directly click on the header to quickly switch between ascending and descending order.
- Note: Grouping fields do not currently support unsorting, and the default is ascending.
The display effect on web:
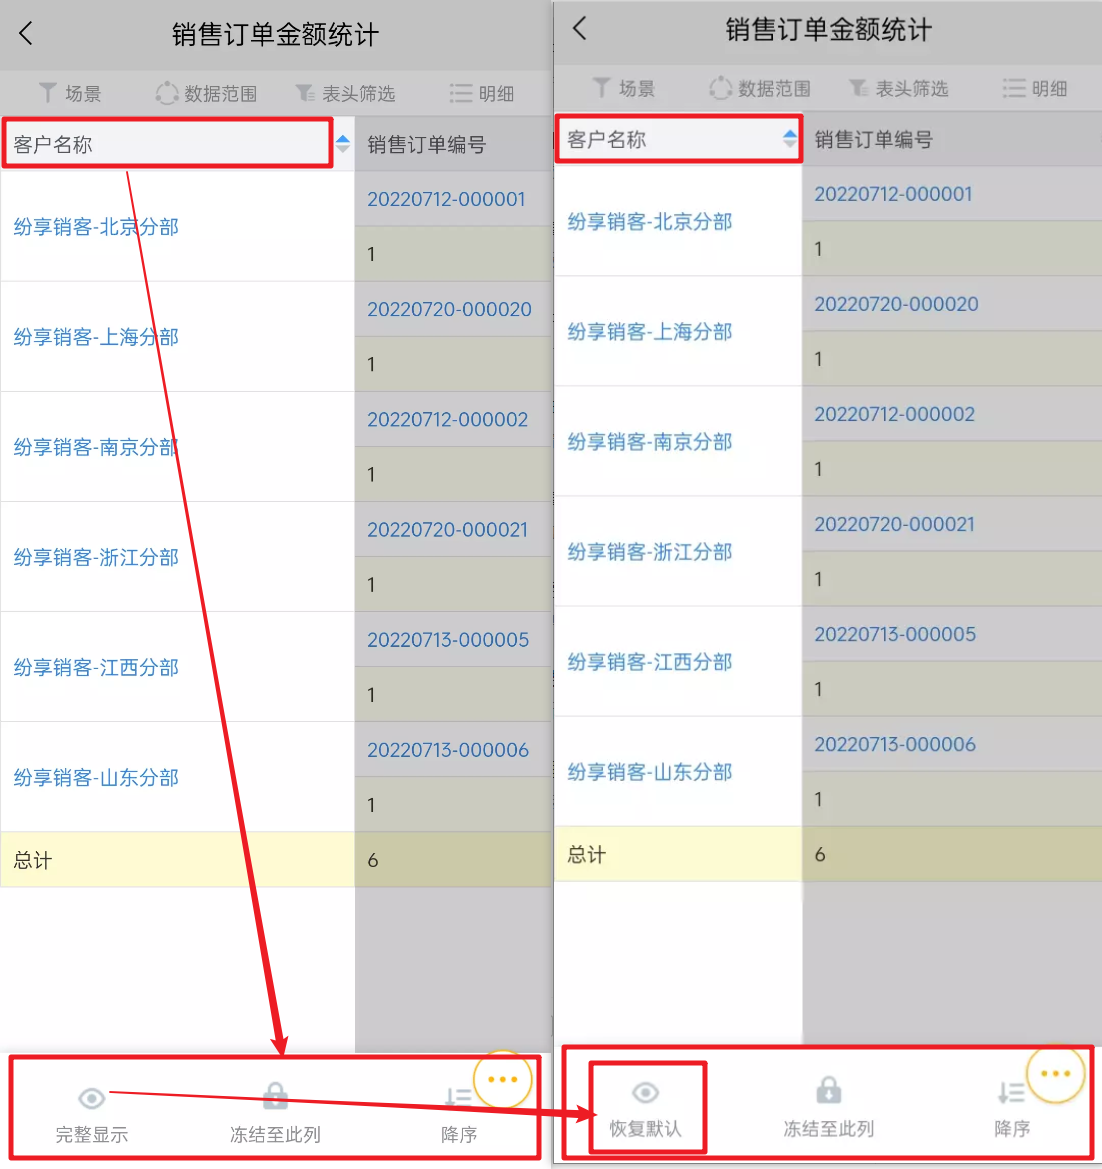
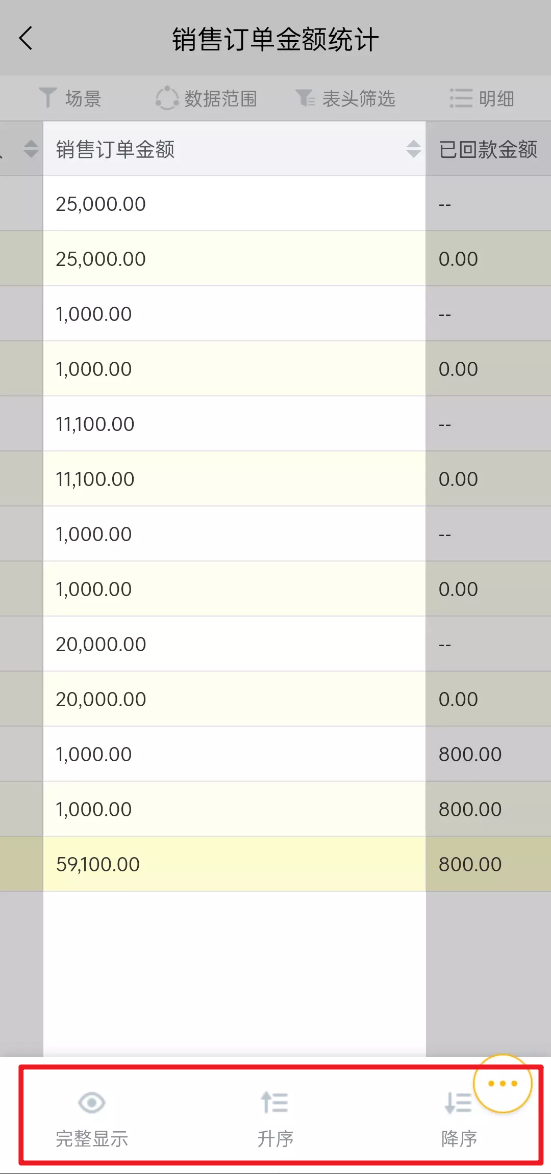
The display effect on mobile:
- Full Display/Restore Default: equivalent to adjusting the column width on web, and cannot be customized
- Freeze to This Column: Freeze to the currently selected column
- Ascending/Descending: switchable sorting
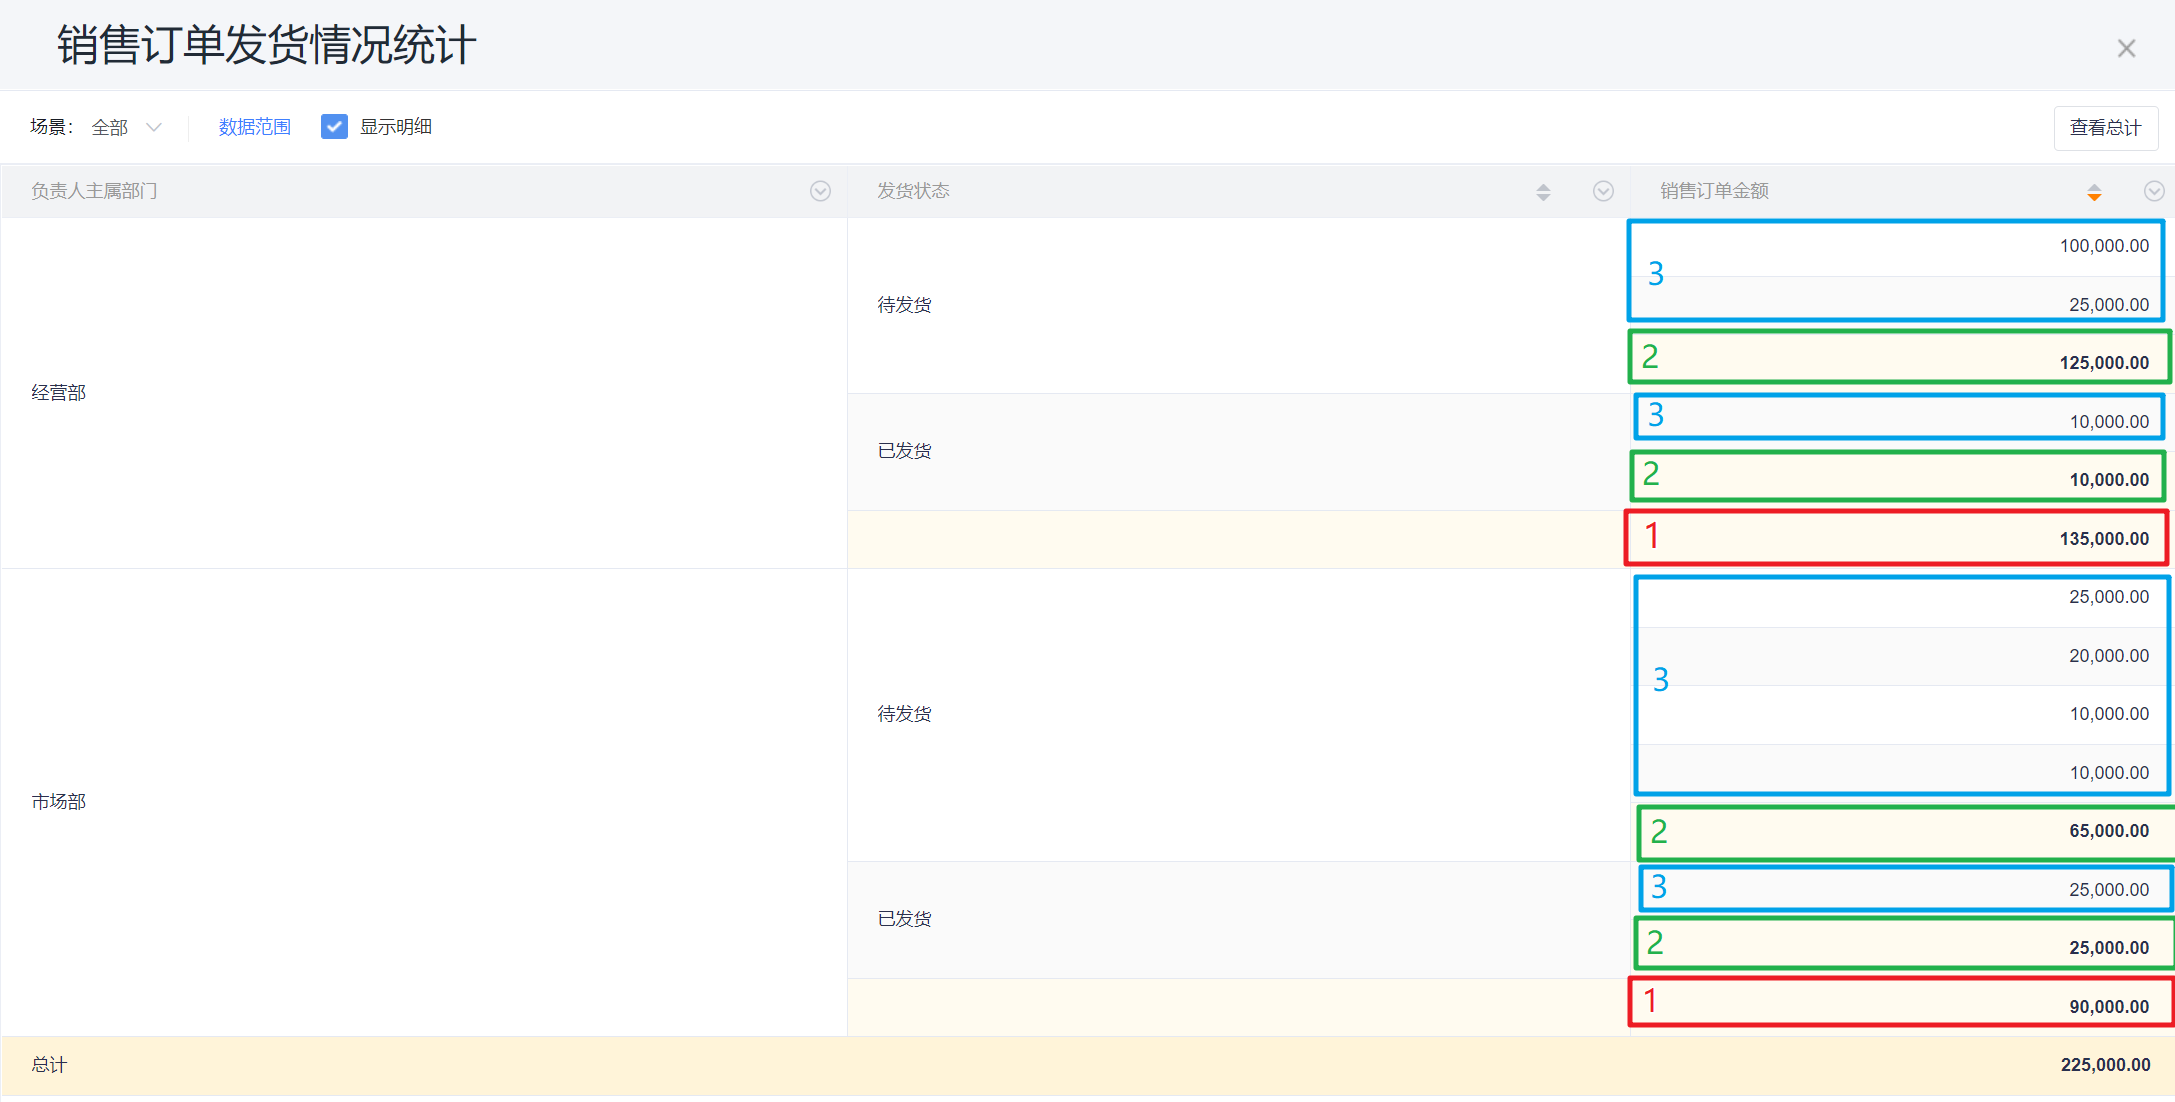
3.7 Statistical Column Sorting
- Support sorting "statistical columns"
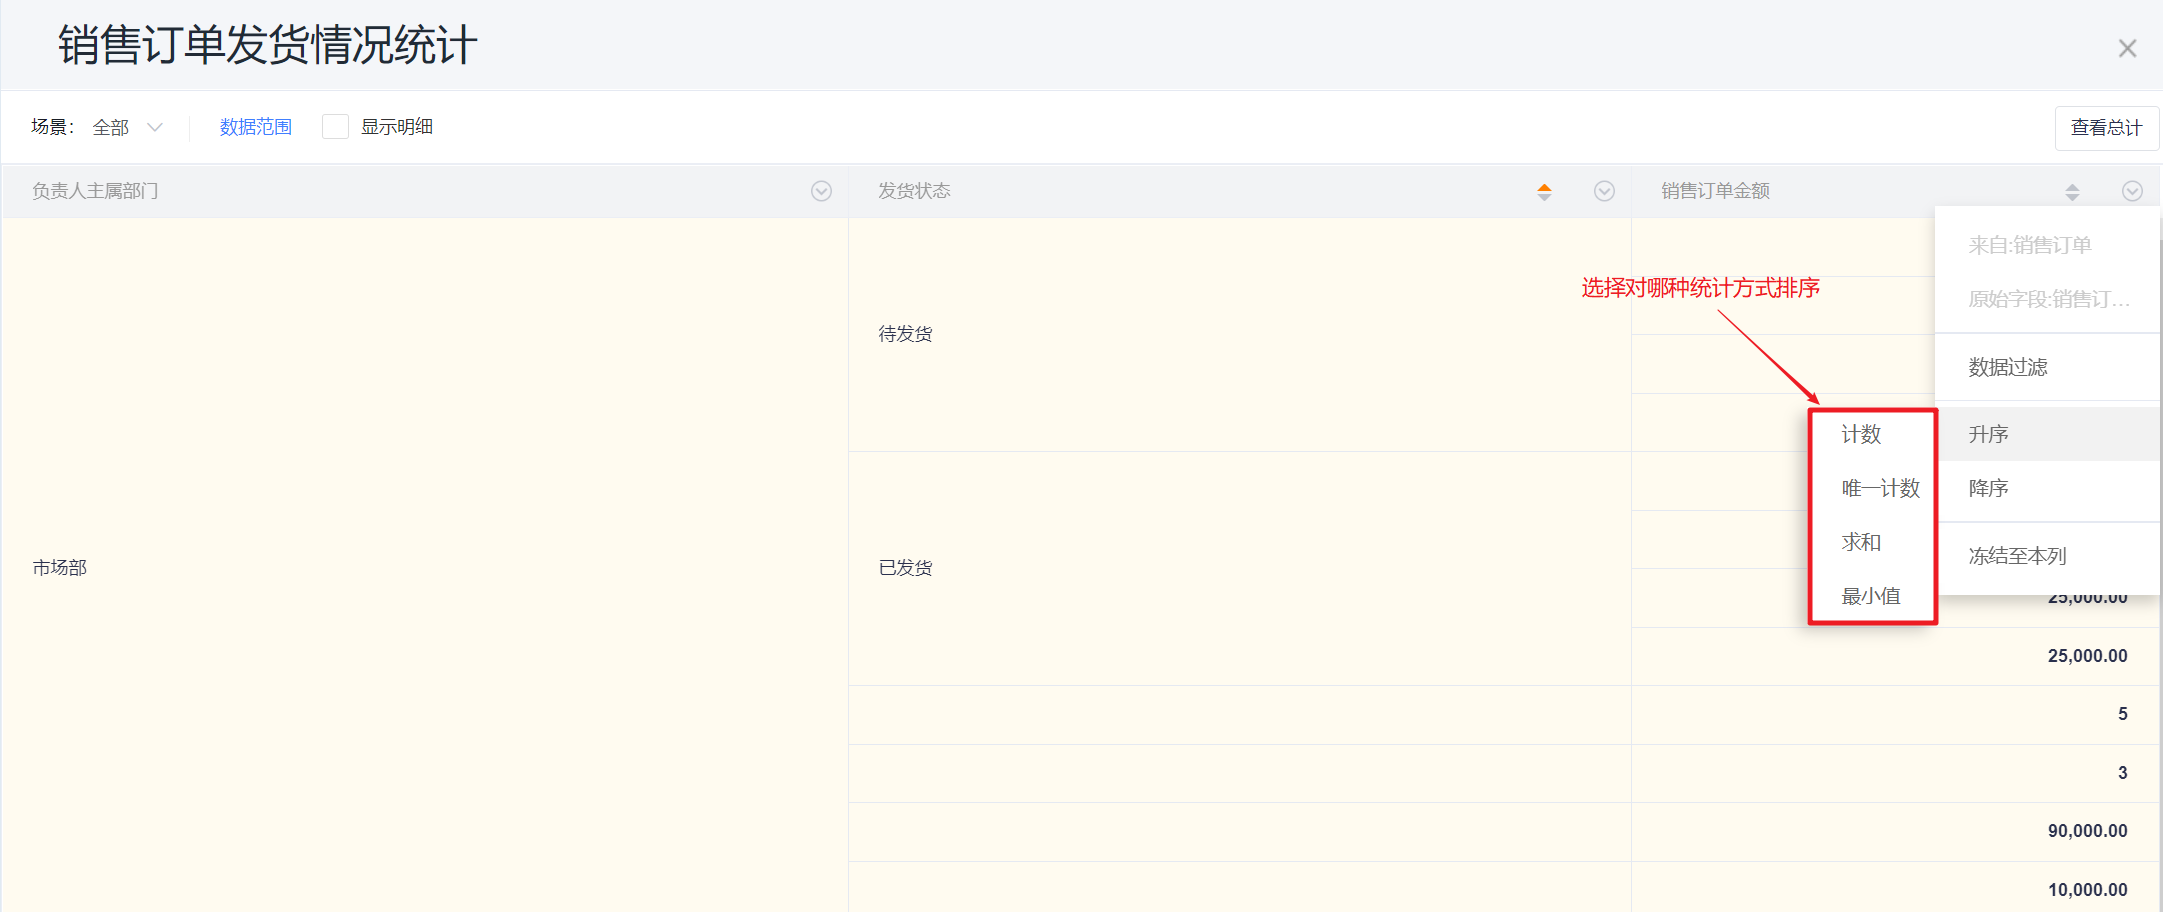
- Example: The first grouping of a report is: the main department, the second grouping is: order status, and the statistical column is: sales order amount-summation, at this time, the sales order amount-summation is sorted
The display effect on web:
- Example: The first grouping of a report is: the main department, the second grouping is: order status, and the statistical column is: sales order amount-summation, at this time, the sales order amount-summation is sorted
The display effect on mobile:
- Compared to grouping fields, there is no "freeze to this column" configuration
- Sorting Rules Description:
- First sort the subtotals of each department in the first grouping (the data in the red box above);
- In each department, sort the subtotals of the delivery status (the data in the green box above);
- Finally, in each state, sort the amount of each detailed order (the data in the blue box above);
- Statistical column sorting cannot be performed simultaneously with group sorting.
- When a statistical column has multiple statistical methods, you need to select a statistical method first when sorting, that is, only one statistical method can be sorted at a time.
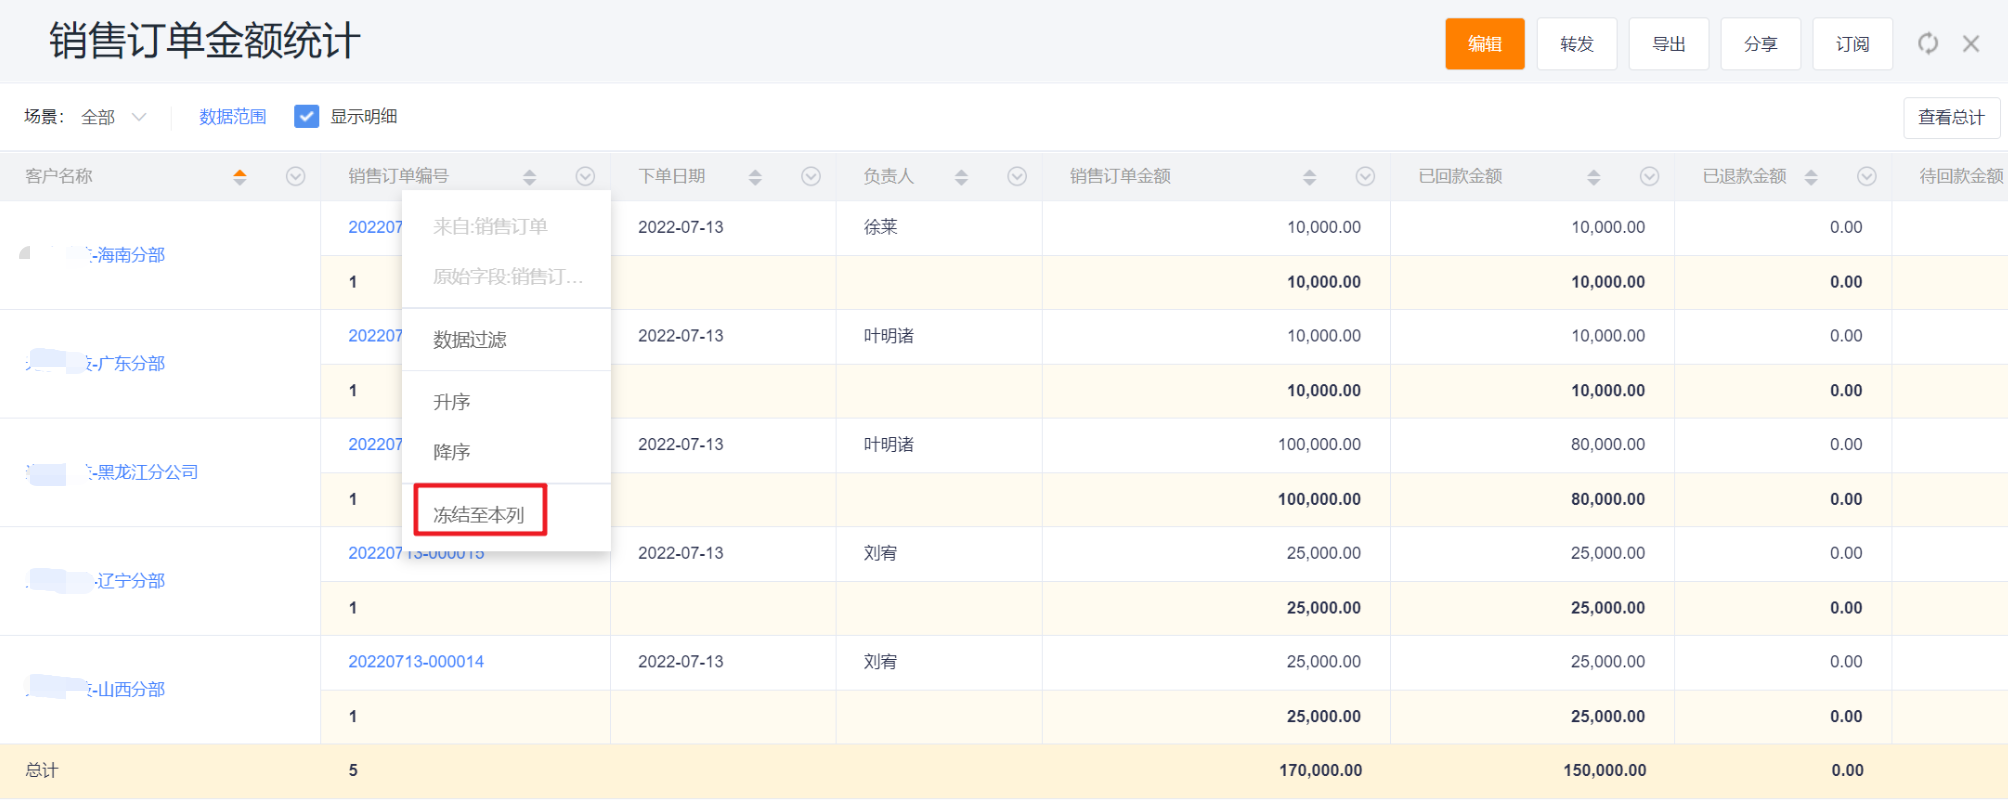
3.8 Column Freezing
*Use the header drop-down-freeze to this column to freeze this column and all columns on the left, and the remaining columns on the right can be scrolled horizontally.
- Notes: All group columns are being freezing by default.
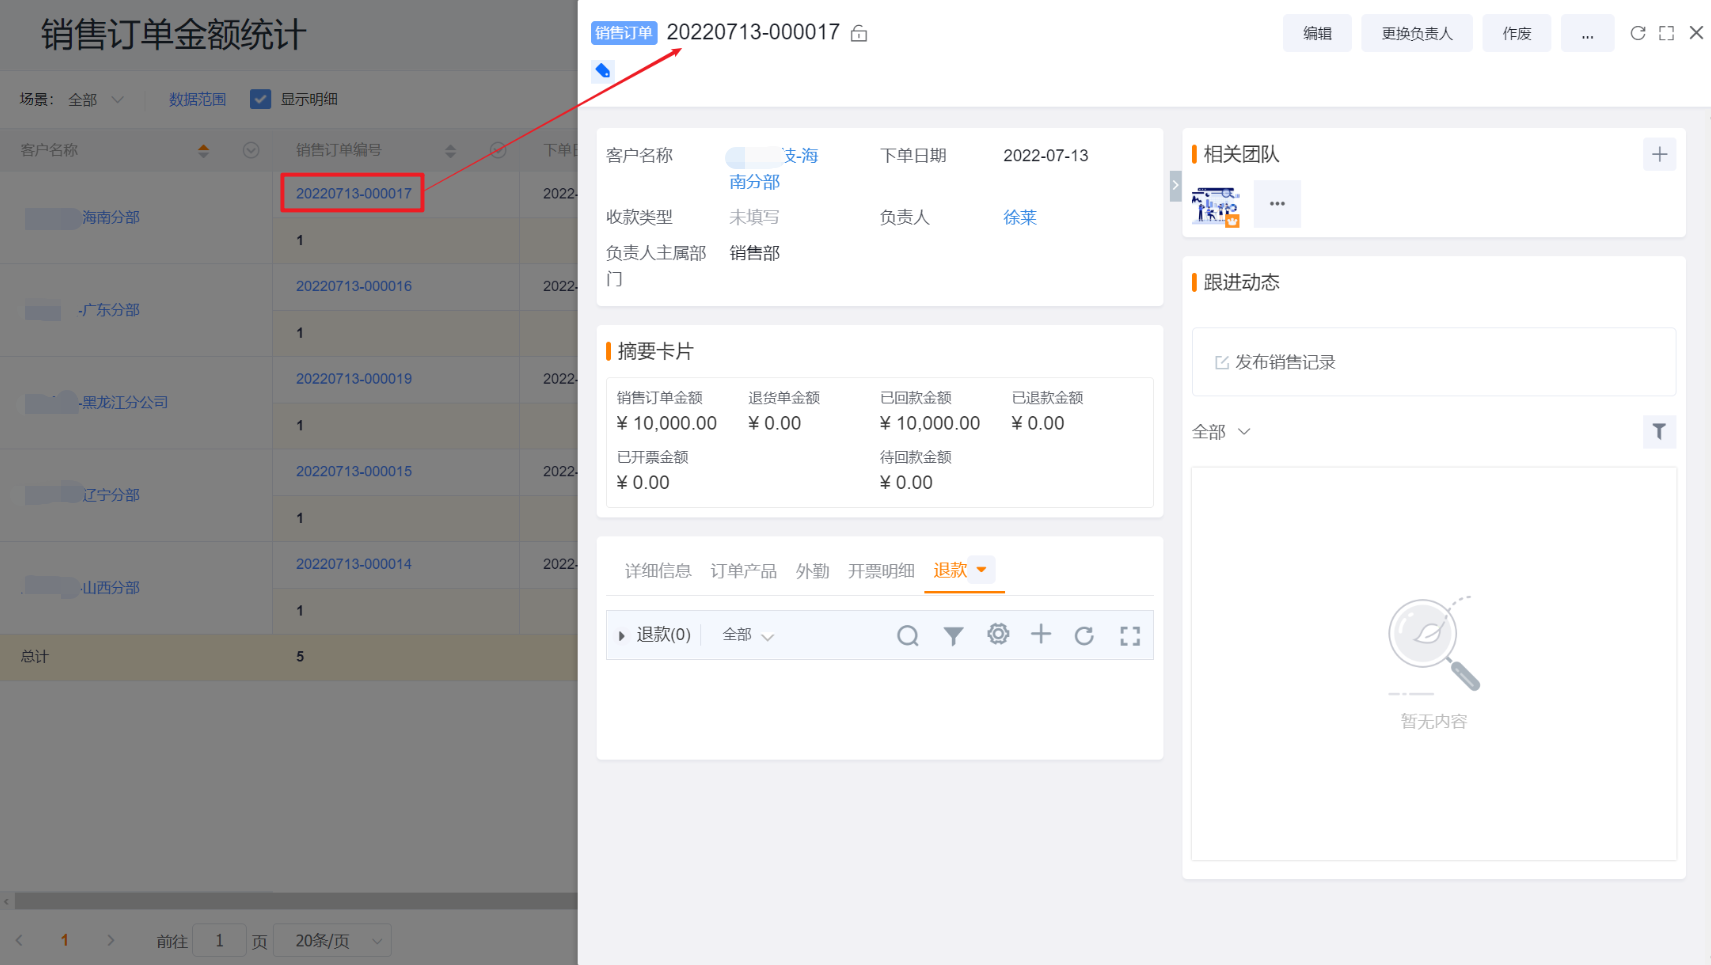
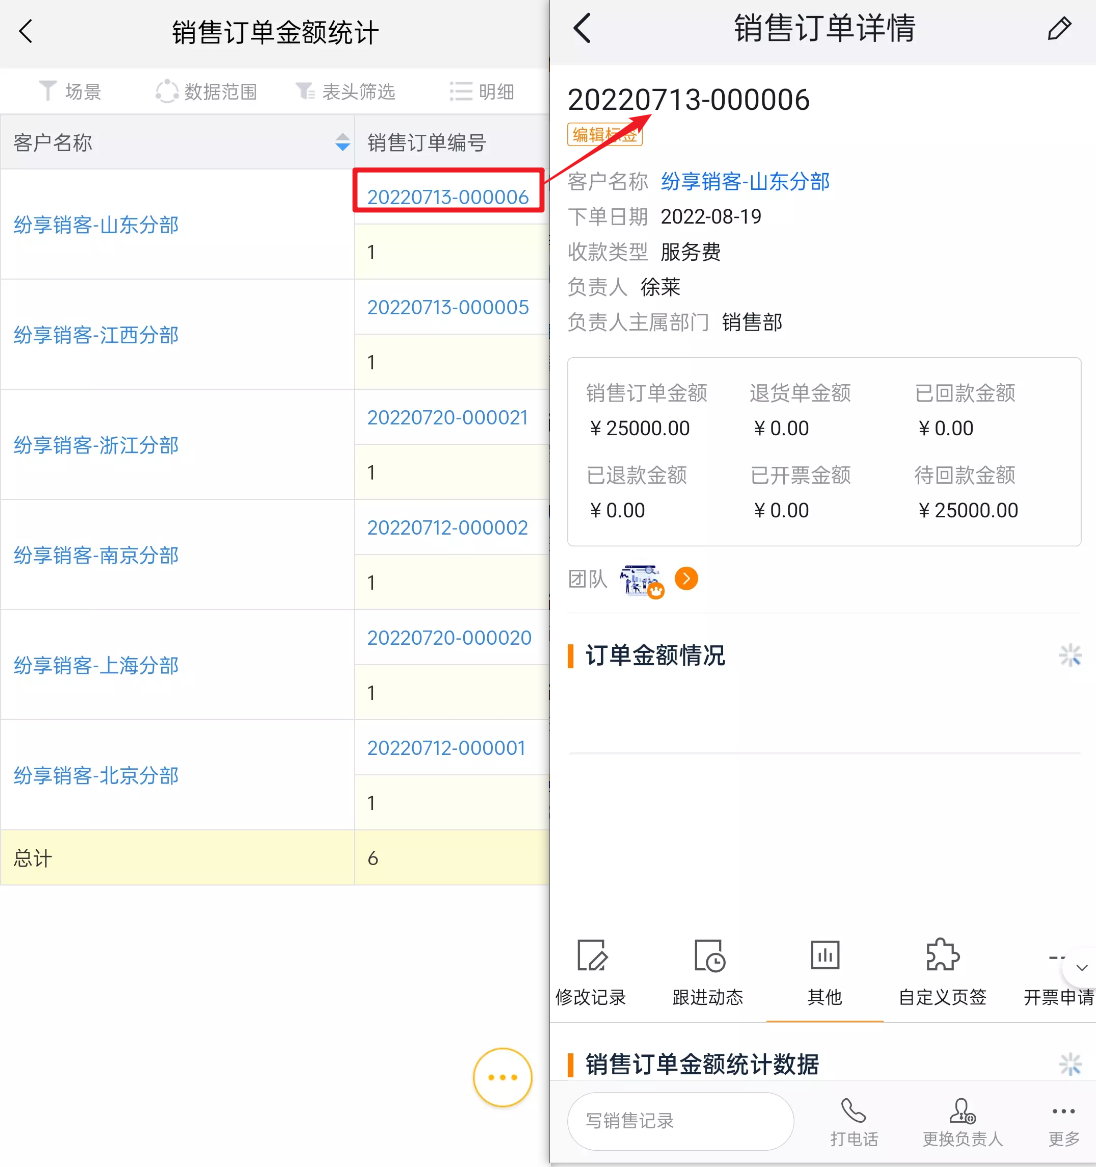
3.9 Link to CRM Details Page
- Click the main attribute of each business object in the report to link to the corresponding detail page of the object. Such as "Account Name" under "Account", "Sales Order No." under "Sales Order"
The display effect on web:
The display effect on mobile:
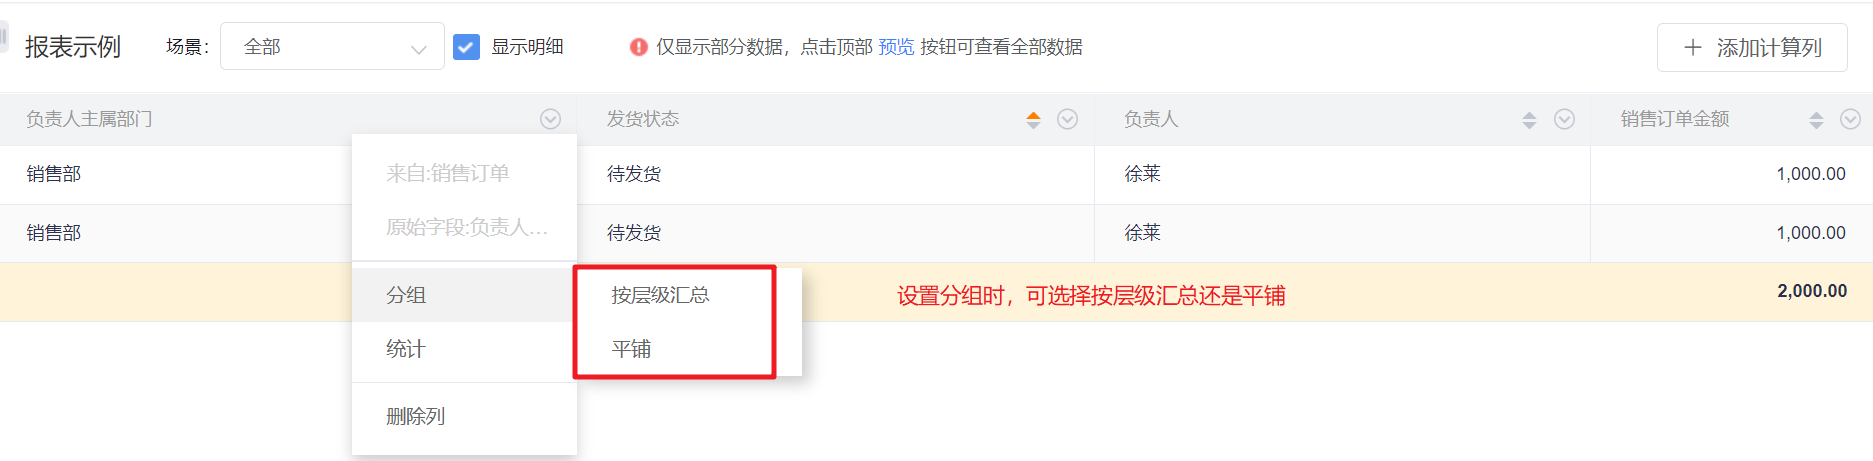
3.10 Department Field Drilldown
- When the employee department (main department, belonging department) field is used as a group field, it can be displayed in a tiled or hierarchically summarized manner according to the organizational structure:
- Tile: departments of all hierarchies are displayed at once;
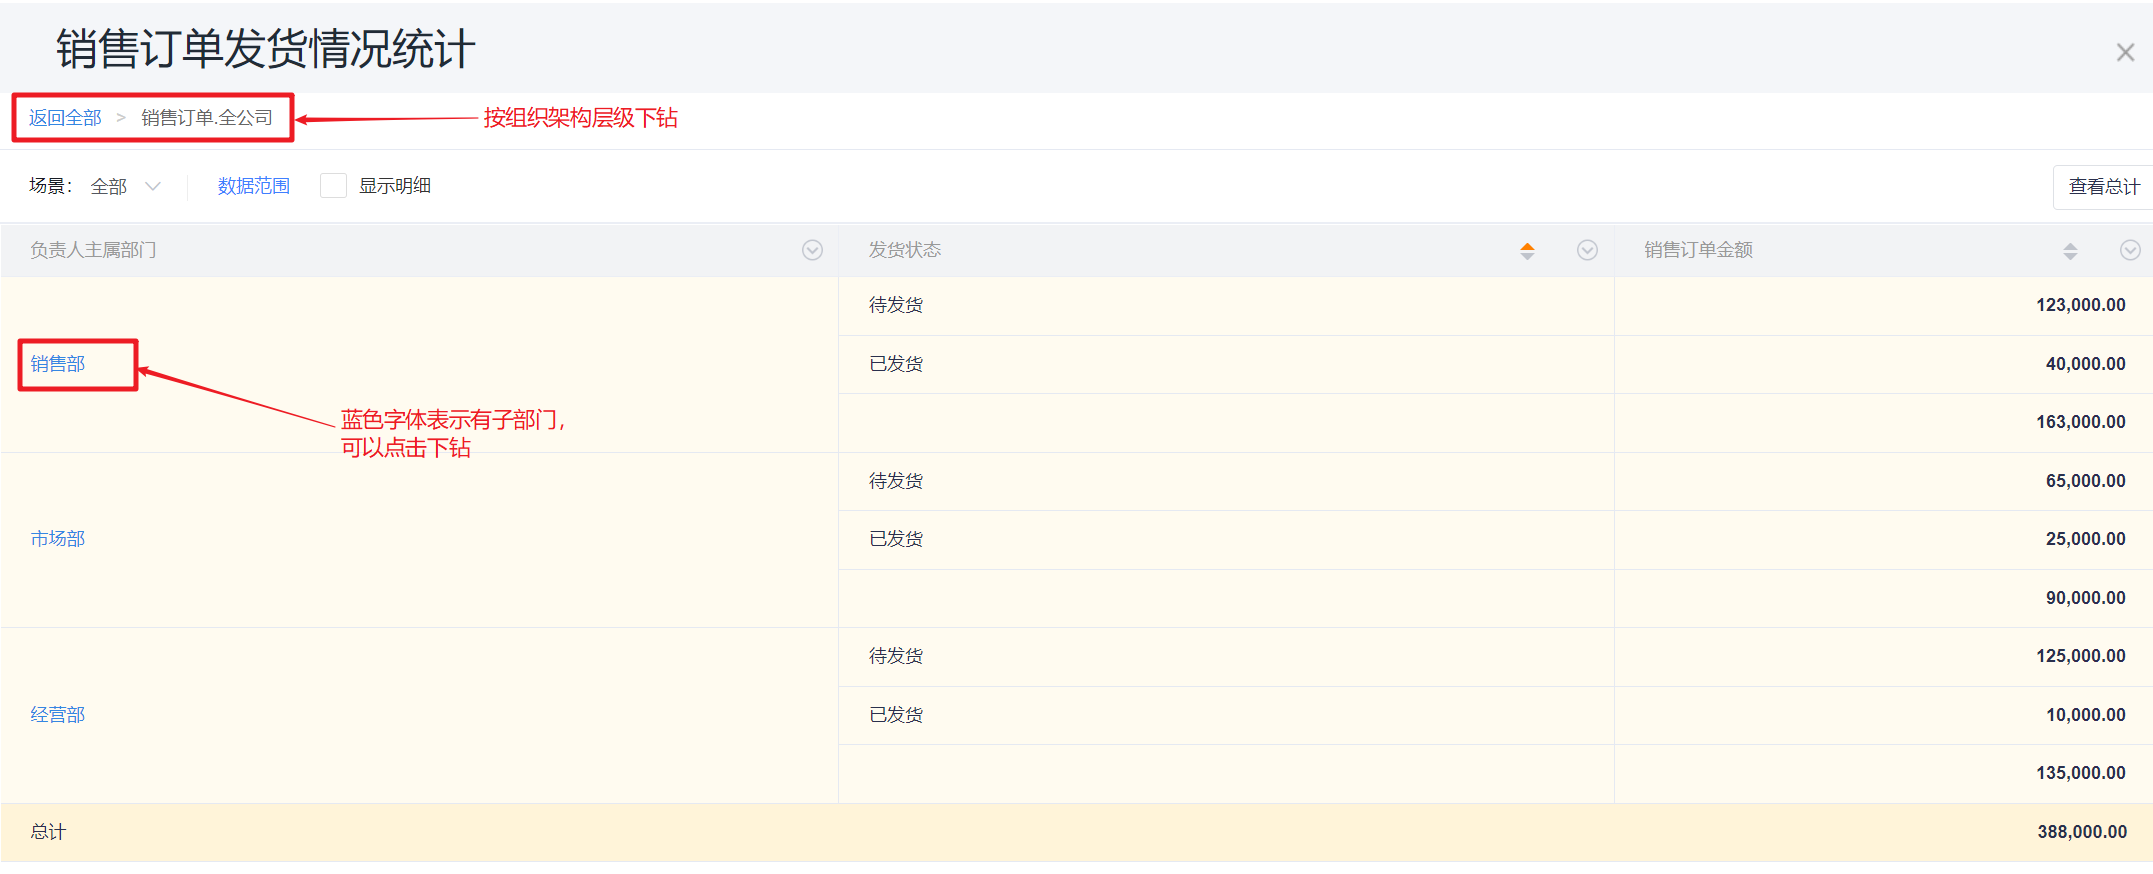
- Summary by level: Display the highest-level department within the viewing authority, and display blue words when there are sub-departments at the level, click to drill down to the next level, and the drill-down path is displayed in the header.
- When creating a new report, drag the department (main department, belonging department) field to the header. If it is not used as a group field, it will display the employee's main department or department. If it is used as a group field, it will be summarized by level:
- The main department displays the entire company. You can click on the preview and details pages to drill down to the next level. Click in turn to view the details according to the organizational structure. Drilling down to individuals will stop. Click the drill-down path at the top of the report to return Go to any level displayed in the drill-down path;
- Belonging department shows the highest level of the current employee's department.
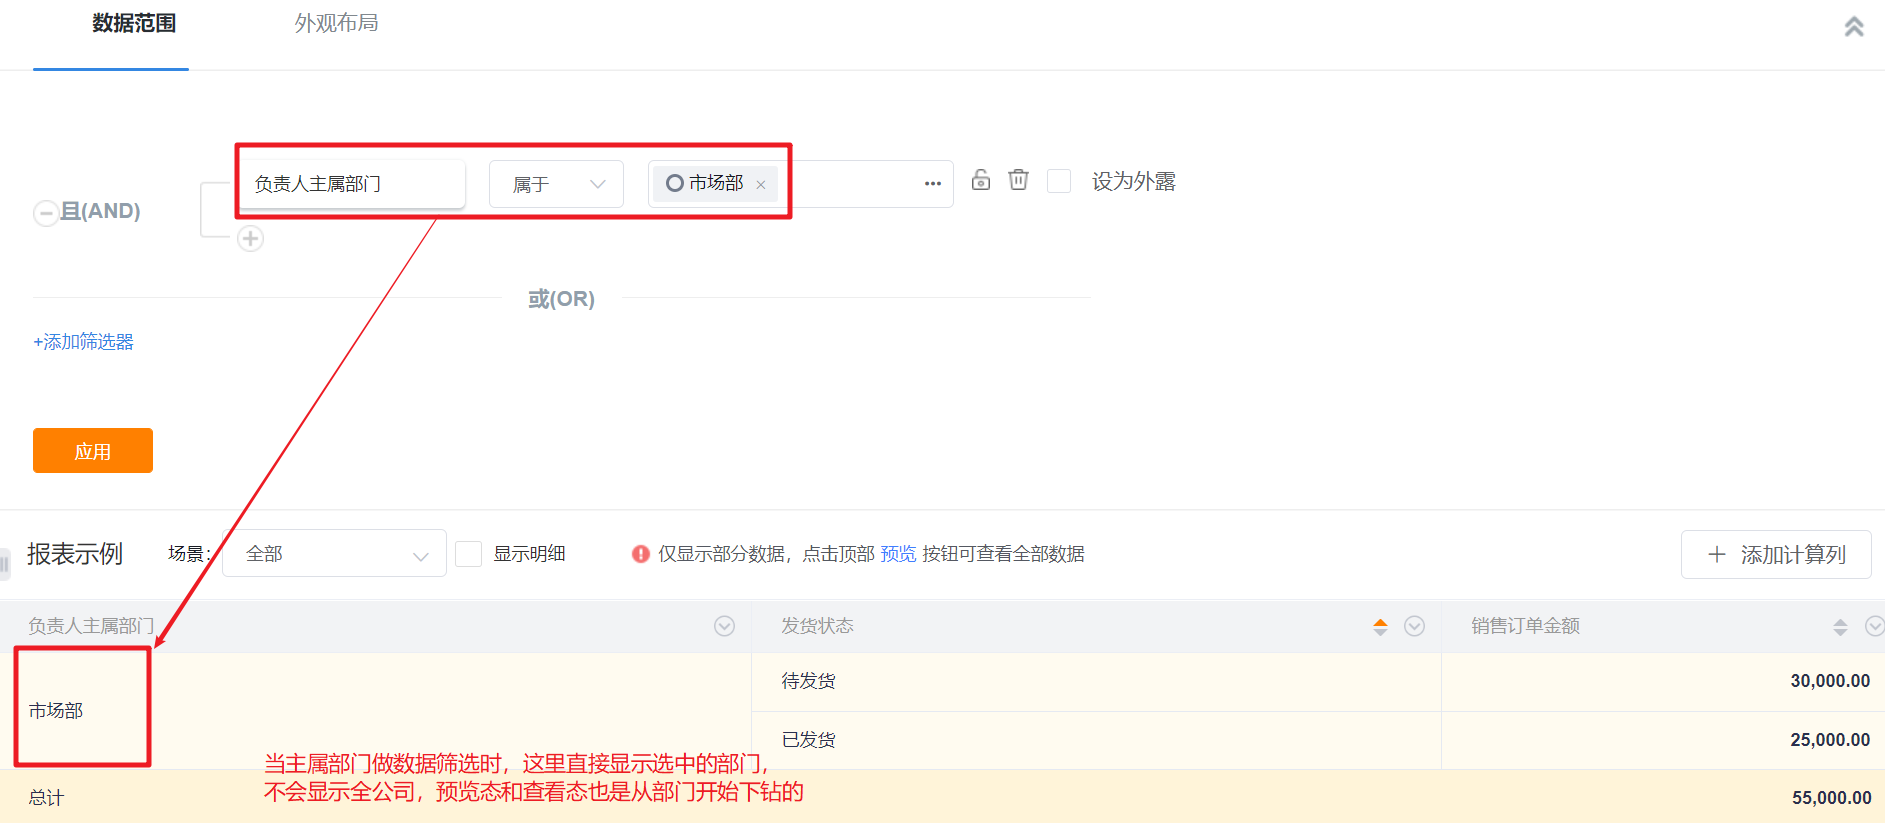
- When using departments in the data range to filter departments (main department, belonging department), you can choose the whole company or specific departments, for example, set the responsible department in the data range as the operation department and market Department, the two departments are directly displayed under the main department of the person in charge of the report, and the drill-down on the preview page also starts from the department.
Notes: Currently, the customized department field only supports tiling, and the display effect is consistent with the tiling display effect of the main department and the affiliation department.
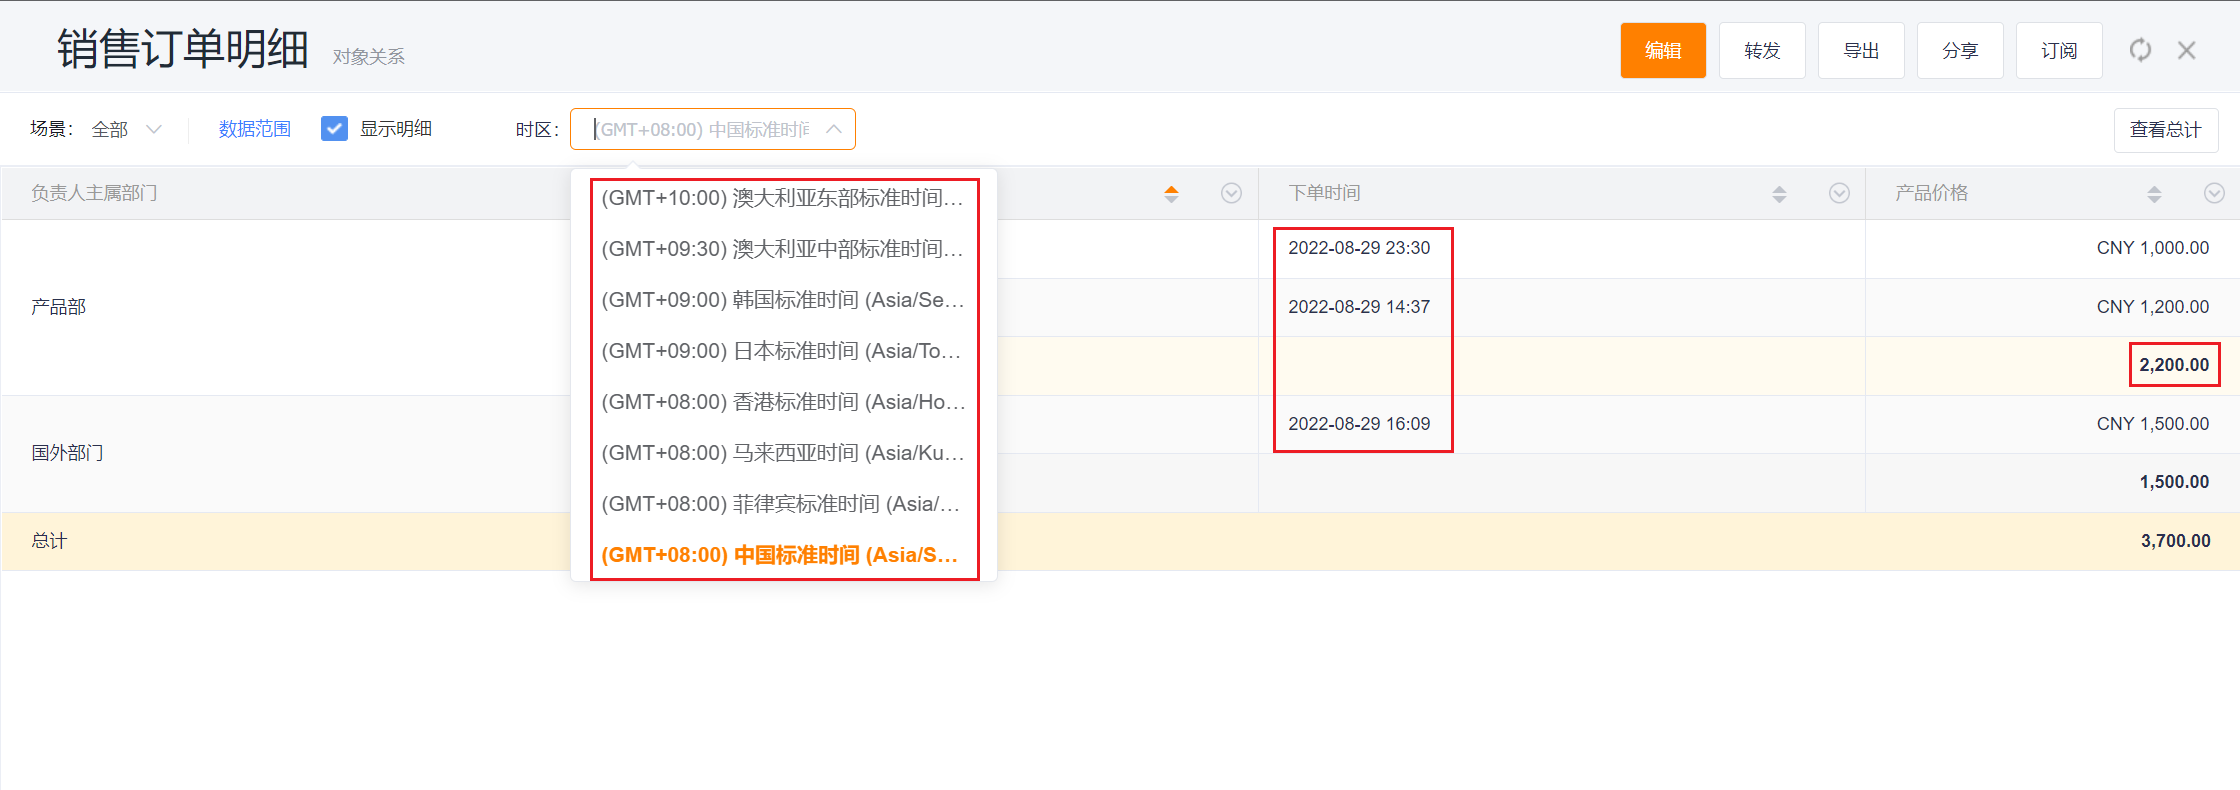
3.11 Switch Time Zone
- Enterprises that have enabled the multi-time zone function can switch time zones when viewing reports. After the time zone is switched, the report echoes statistical data based on the latest time zone.
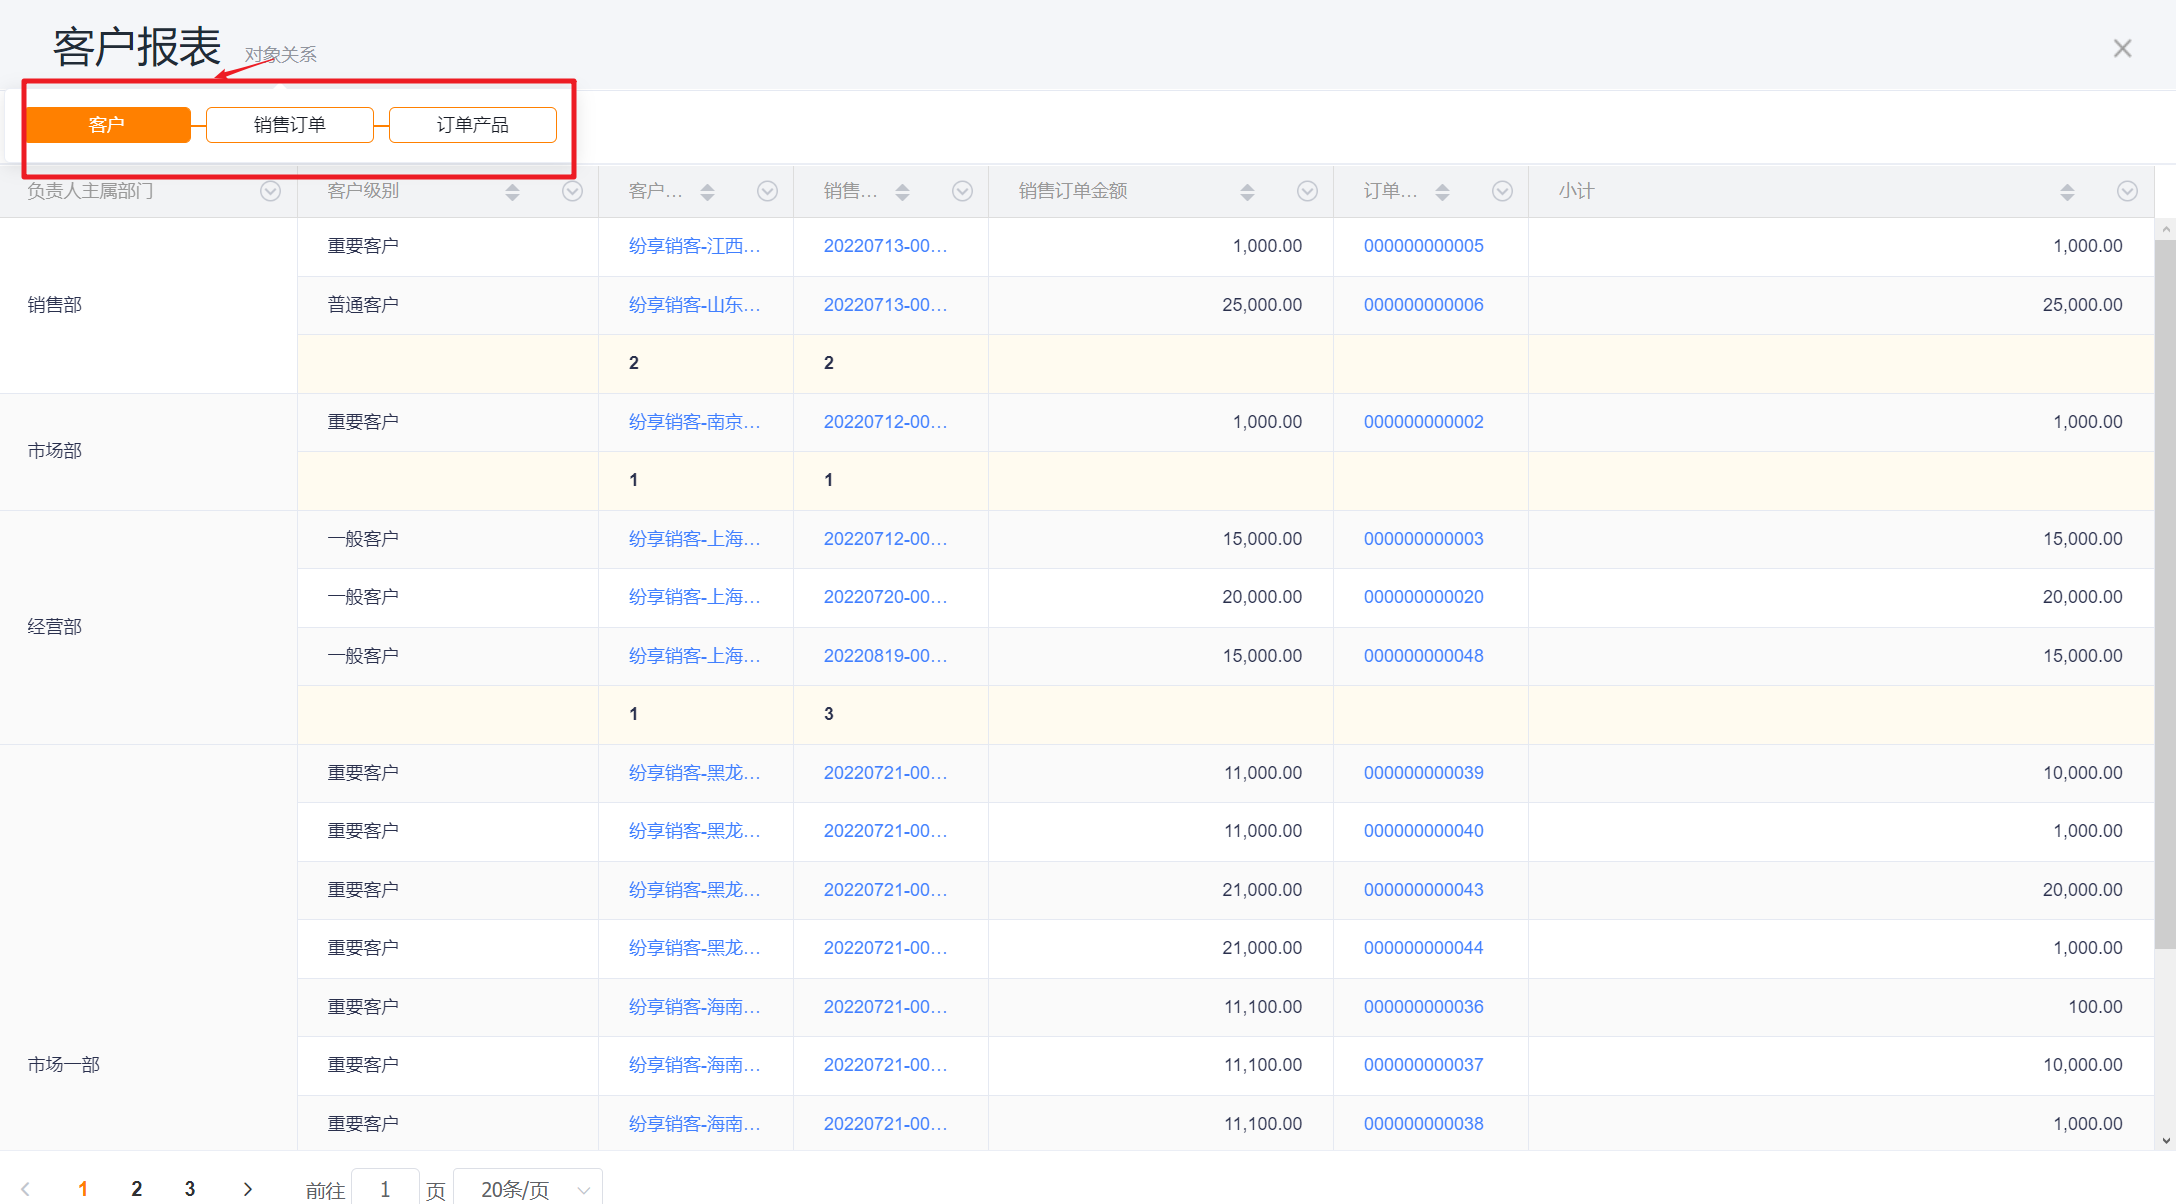
3.12 View Object Relationship
- The report supports viewing object relationships in the viewing state and preview state. When the mouse hovers over the "object relationship", you can view the objects and object relationships used in the current chart.
3.13 Others
- Forward: When forwarding the report to other users, what other users see is the data within their permission;
- Share: Sharing the report is to share the report in the form of an Excel sheet, and other users in the visible range will see the same report;
- Export: When viewing the report page and exporting, it will bring the filtering scene, data range and data filtering conditions set in the current page to ensure that the exported data is consistent with the currently viewed data;
- When exporting in the operation bar of the report list, the default filtering scene and data range will be used;
- Subscribe: The subscription report received by each user is the data within the scope of their own permission, and the subscription report will not expand the scope of his visible data.
Notes: The filter scenarios, data ranges, and data filter conditions set when viewing the report are all one-time and will not be saved. To save, please enter the report designer to modify.