
1. Create Cross Report
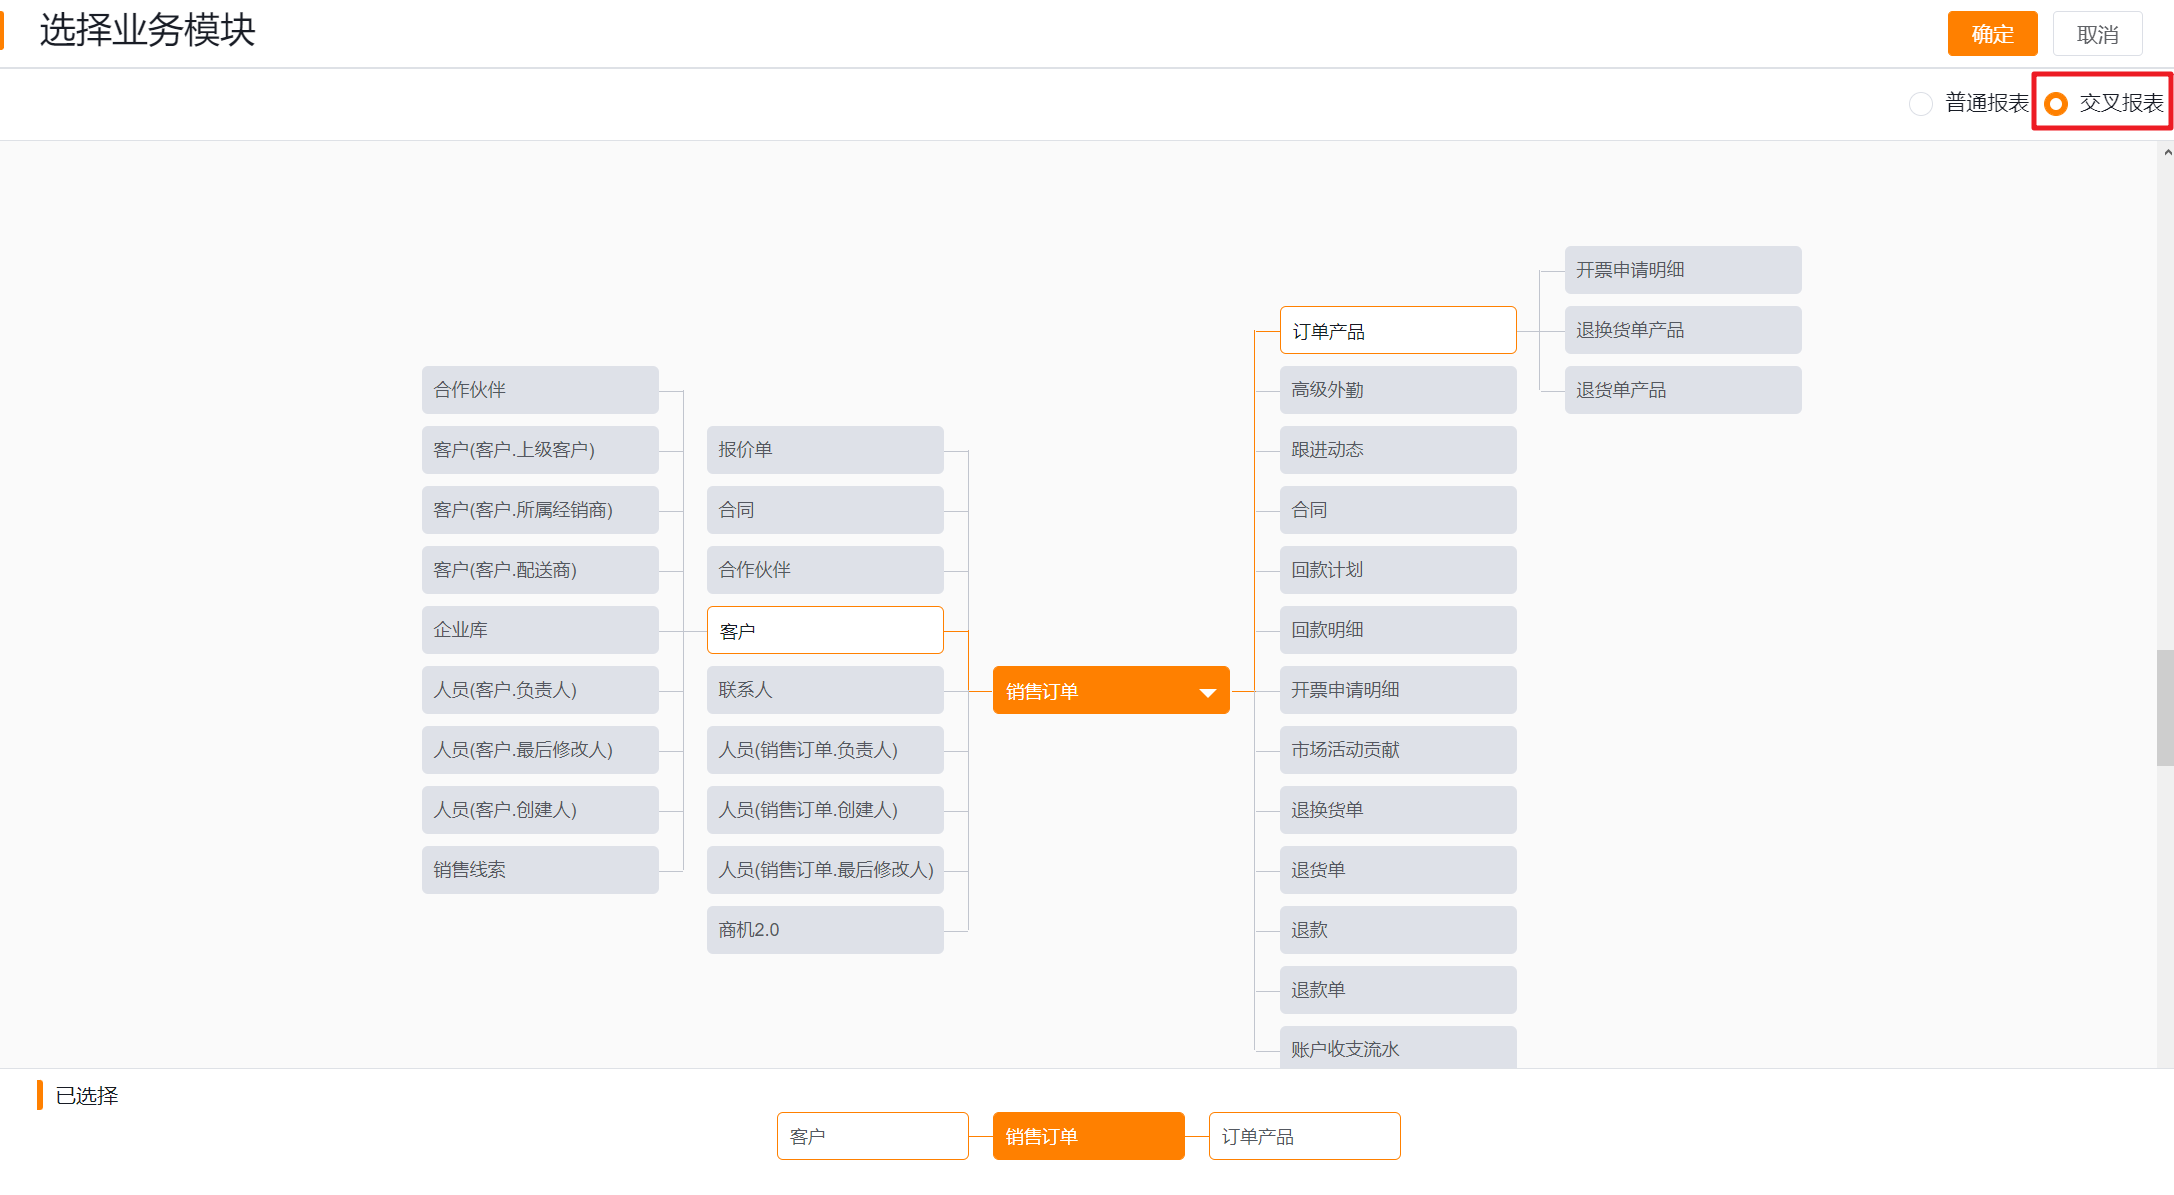
- Enter from the new report, select a blank template, and you can analyze the custom object. Switch the report type to a cross report. First, you need to select the main object. After the selection, it will automatically bring up its associated objects. You can customize the selection according to your needs.
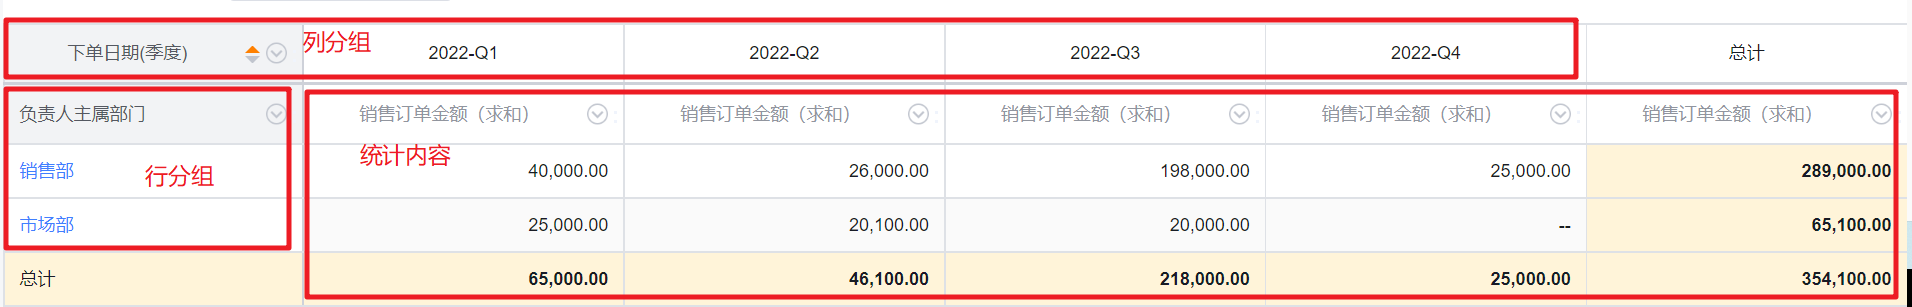
- The cross report supports row grouping and column grouping at the same time. The column grouping is on the left side of the data table, and the row grouping is on the upper part of the data table. The intersection of rows and columns can perform various summary calculations on the data, such as counting, summing, average, maximum, minimum, etc.
2. Edit Cross Report
- It is mainly illustrated by examples of specific scenes. Cross-reports can simultaneously count data from multiple dimensions:
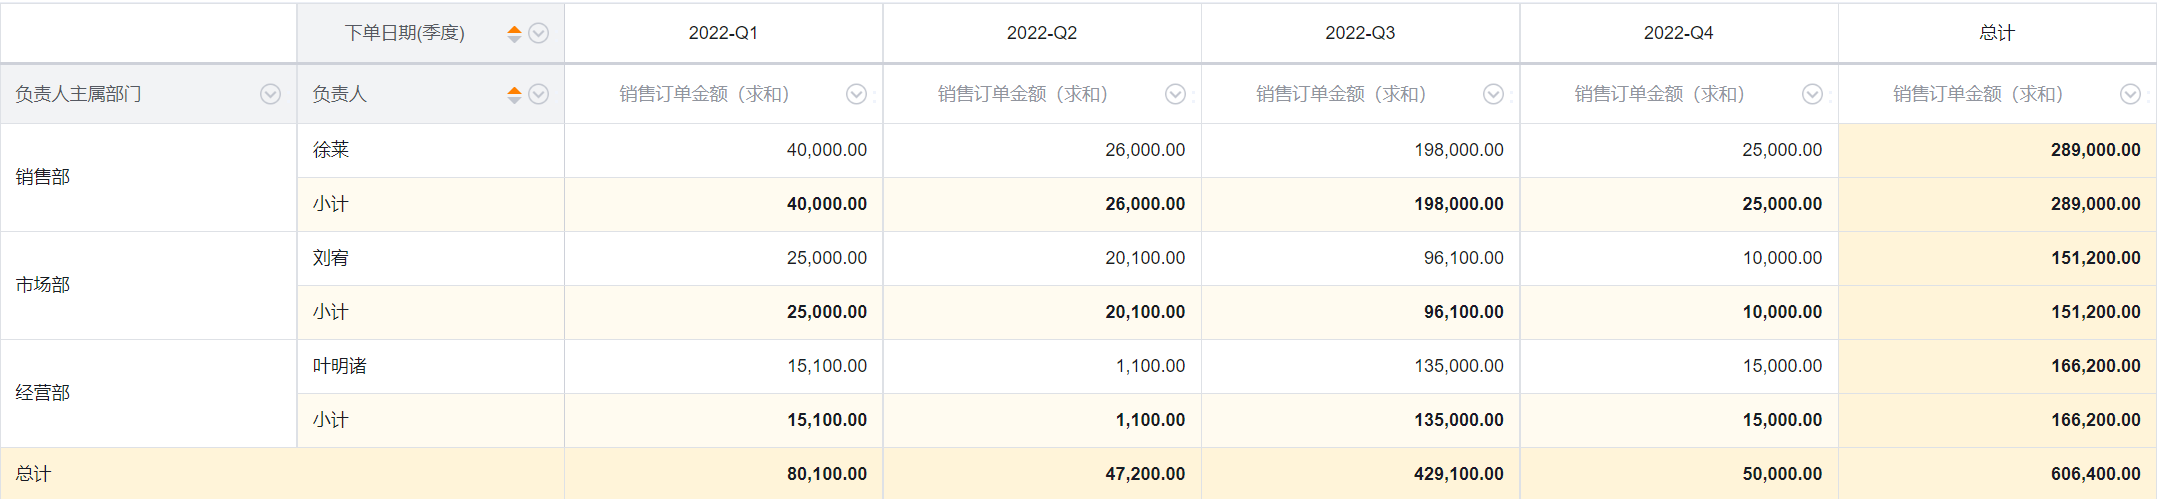
- Scene 1: Statistics of sales of various departments and quarters in 2022
- Row Field: main department; column field: order date - quarter; statistical field: sales order amount (yuan) - sum.
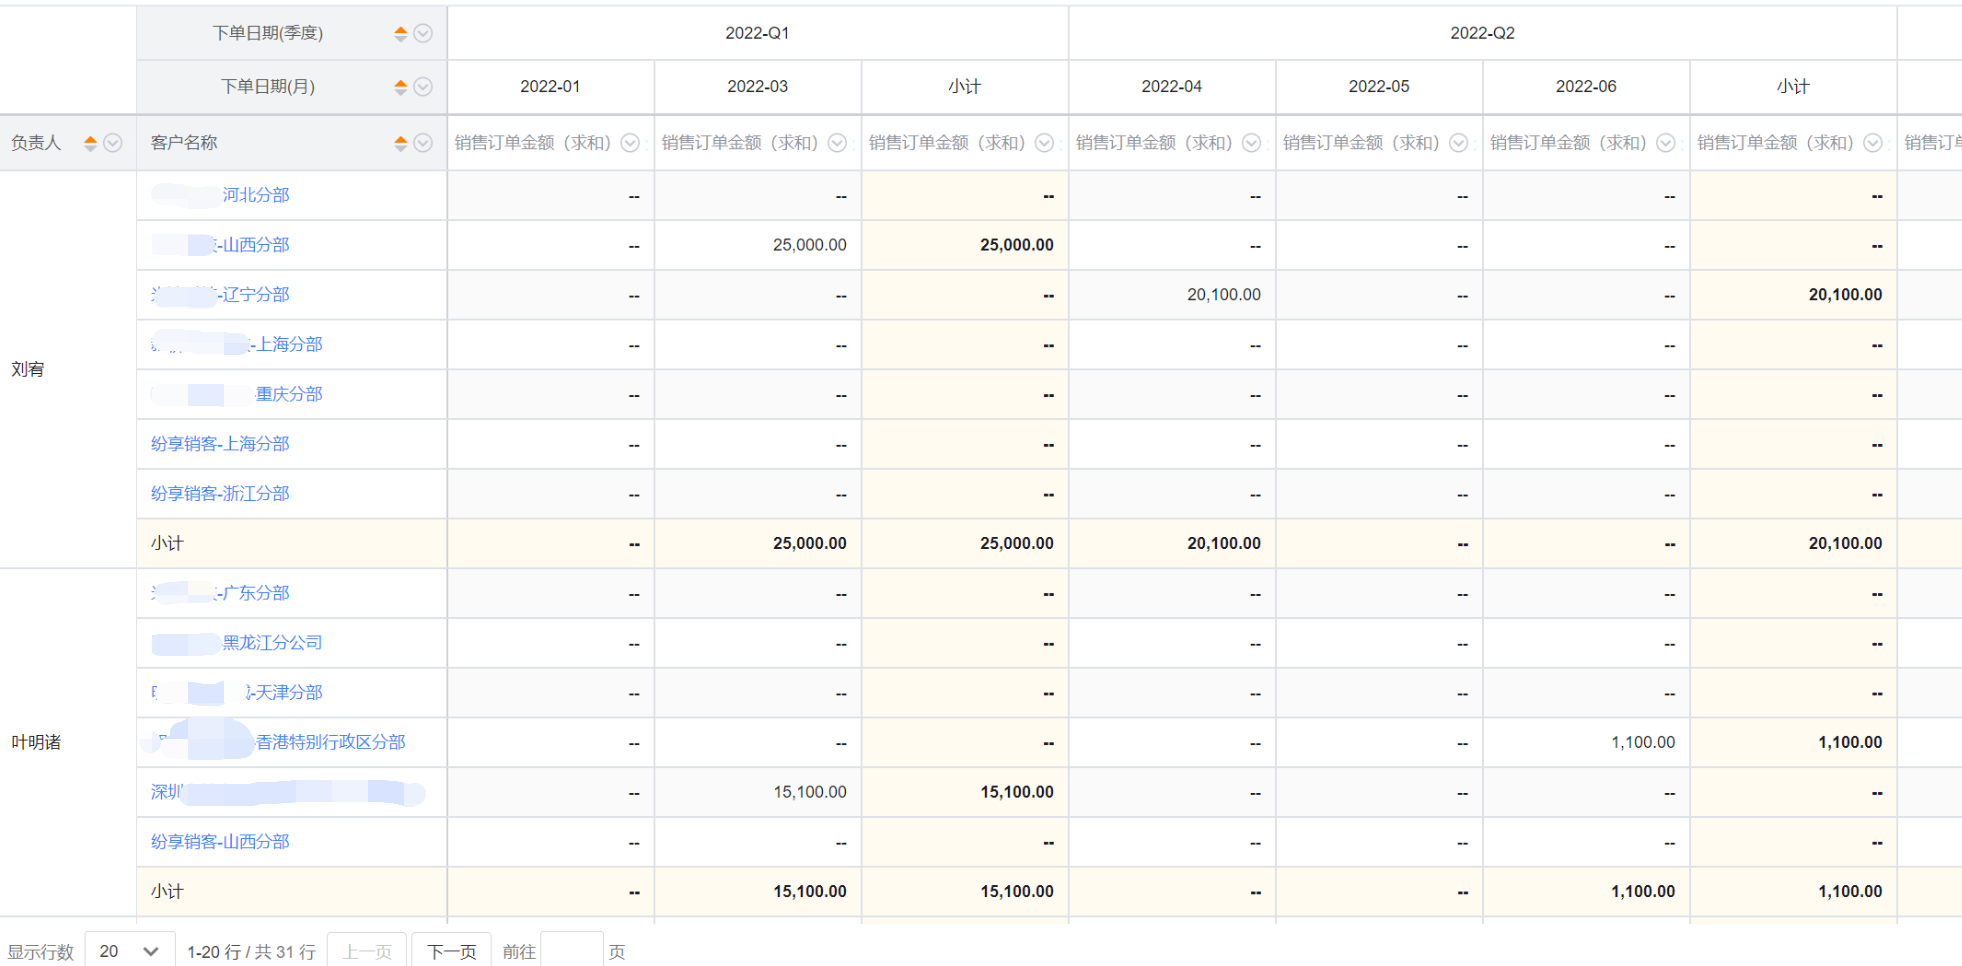
- Scene 2: Statistics of the sales of accounts responsible for each employee in each quarter and month of 2022
- Row Field: owner, account name; column group: ordering date-quarter, ordering date-month; Statistics Field: sales order amount (yuan)-sum
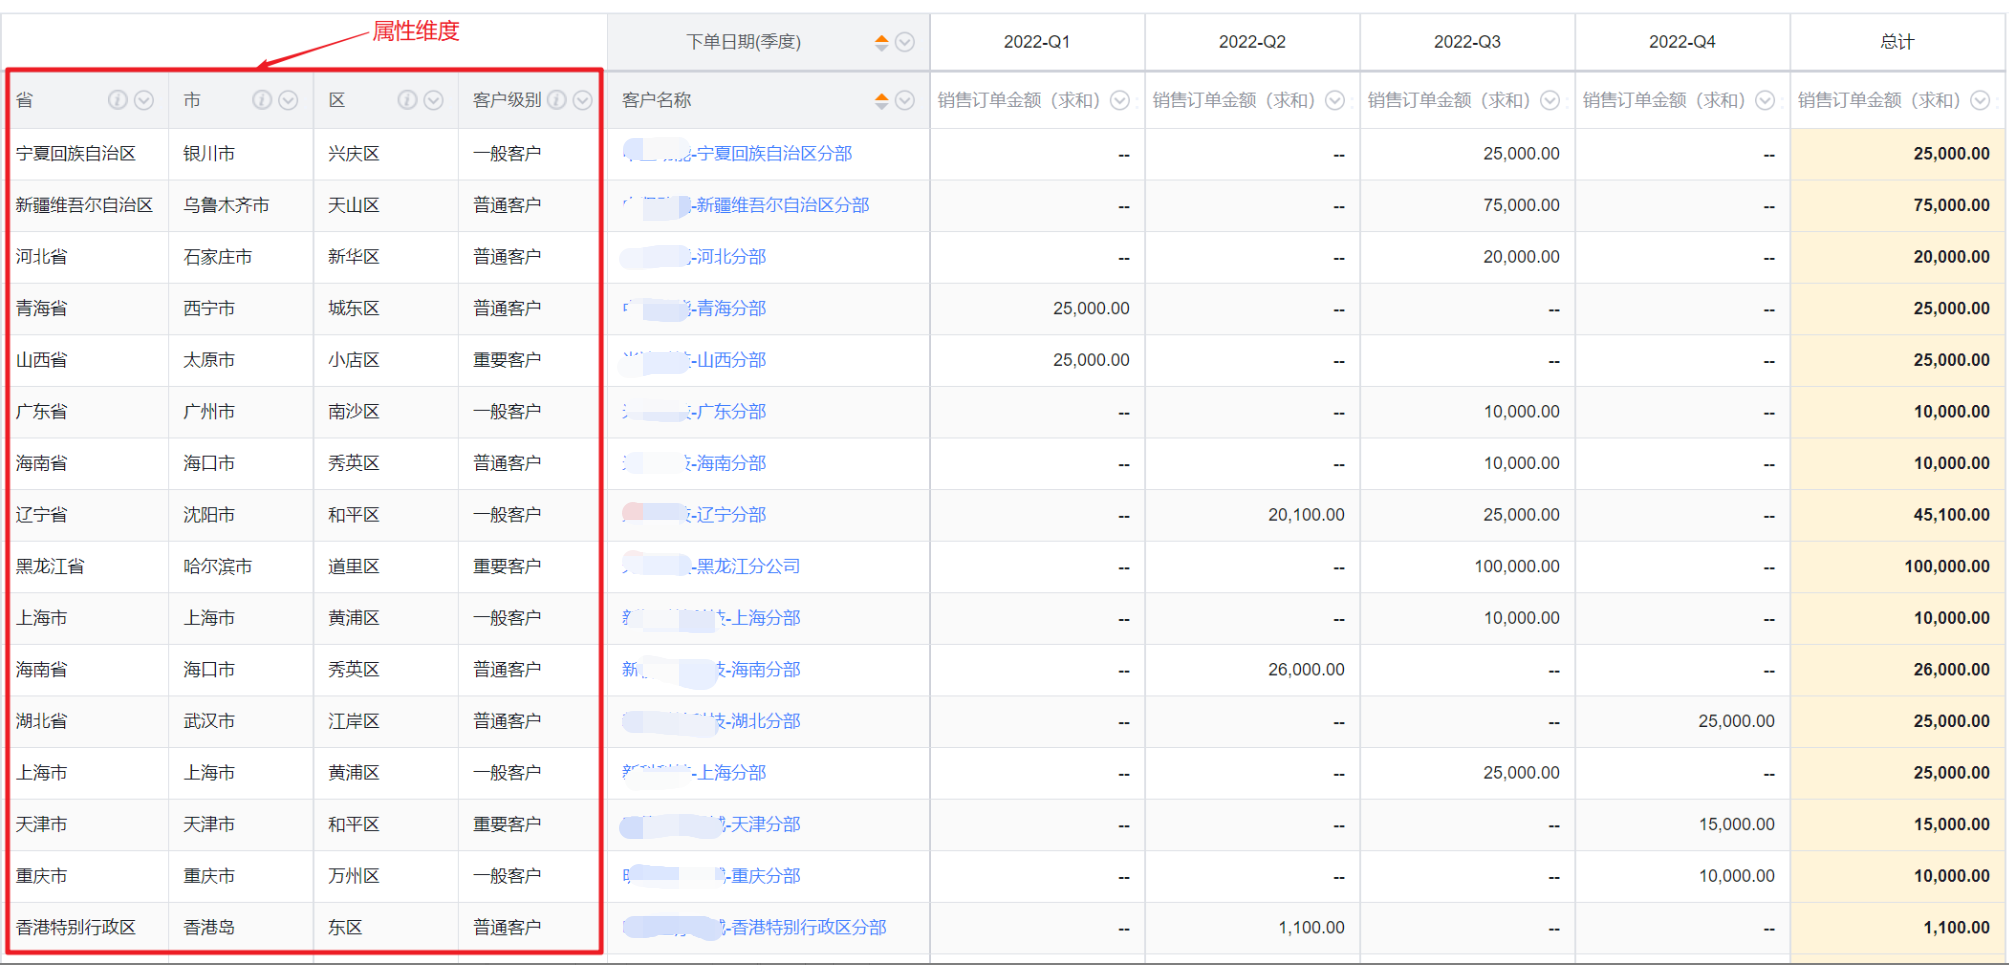
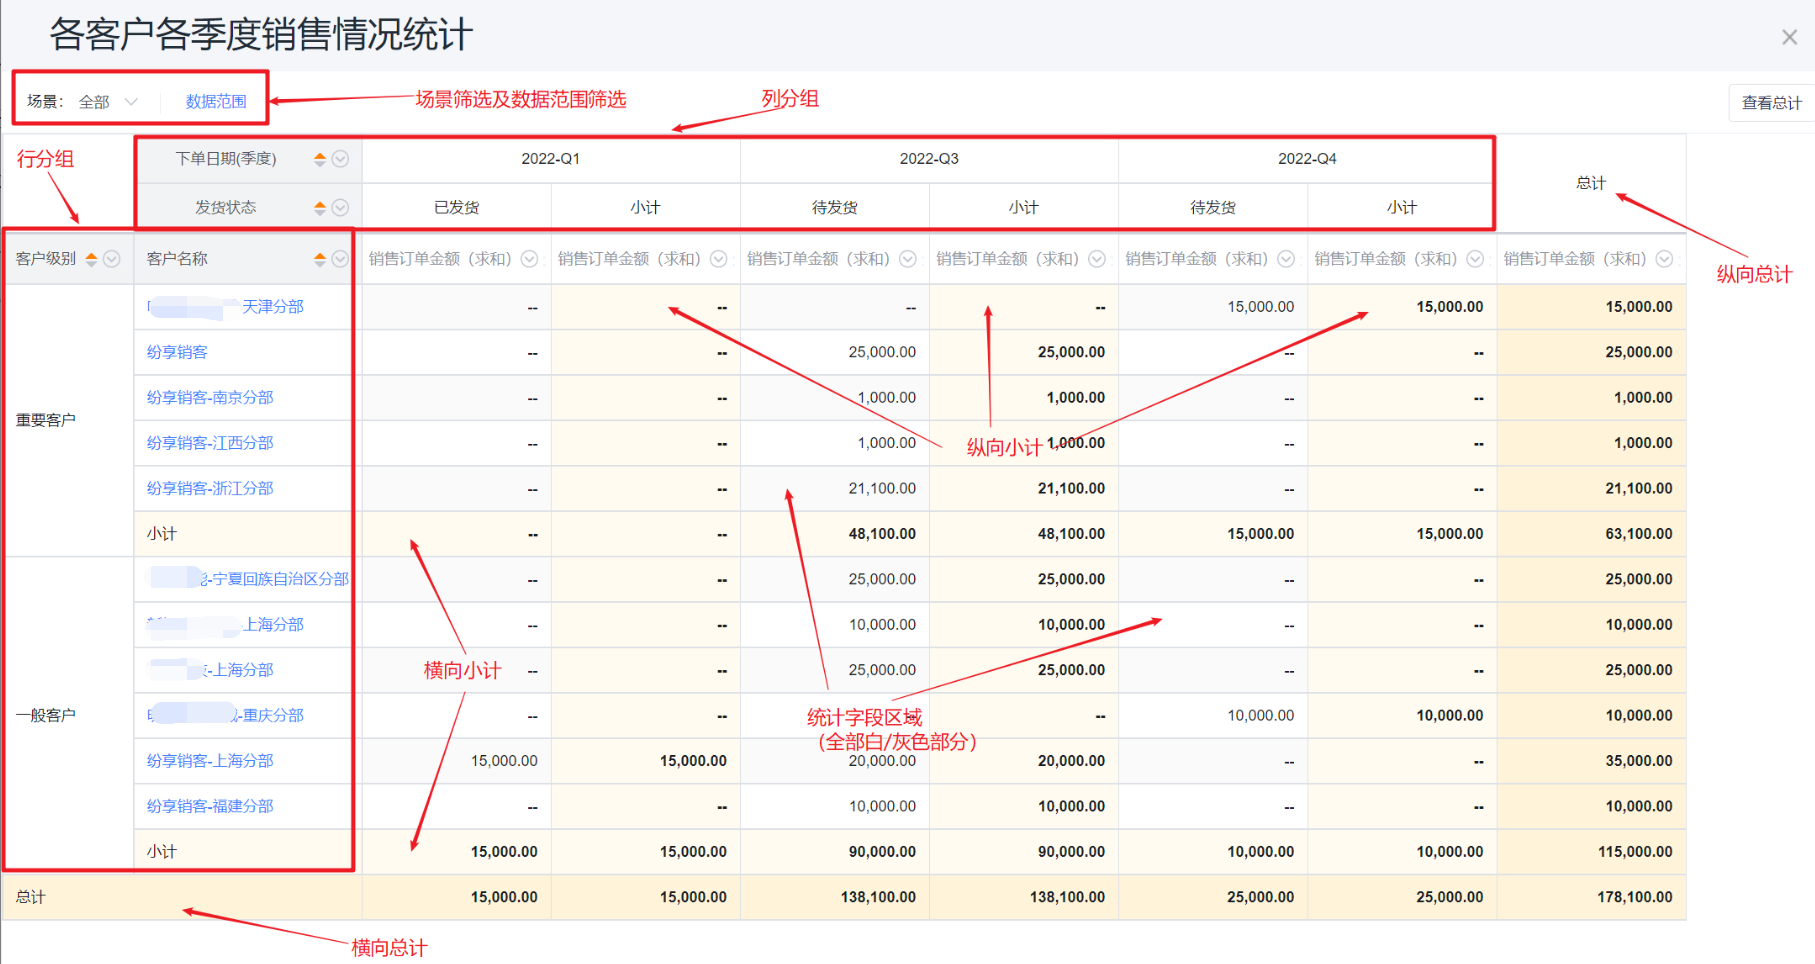
- Scene 3: Count the sales of each account in each quarter of 2022, and check the provinces, regions, and level information of each account at the same time
- Row Group: account name; column group: ordering date-quarter; statistics field: sales order amount (yuan)-sum; attribute dimension: province, city, district, account level
- Notes: When there is a "Primary Attribute" field in the row group for grouping, drag other fields under the object to the row group, the default is the attribute column, you can drop down and use the "Group" operation to change it to grouping; after canceling the grouping, change it again It is an attribute column; the main attribute field does not support being an attribute column (that is, the main attribute field cannot be ungrouped)
- Row Group: account name; column group: ordering date-quarter; statistics field: sales order amount (yuan)-sum; attribute dimension: province, city, district, account level
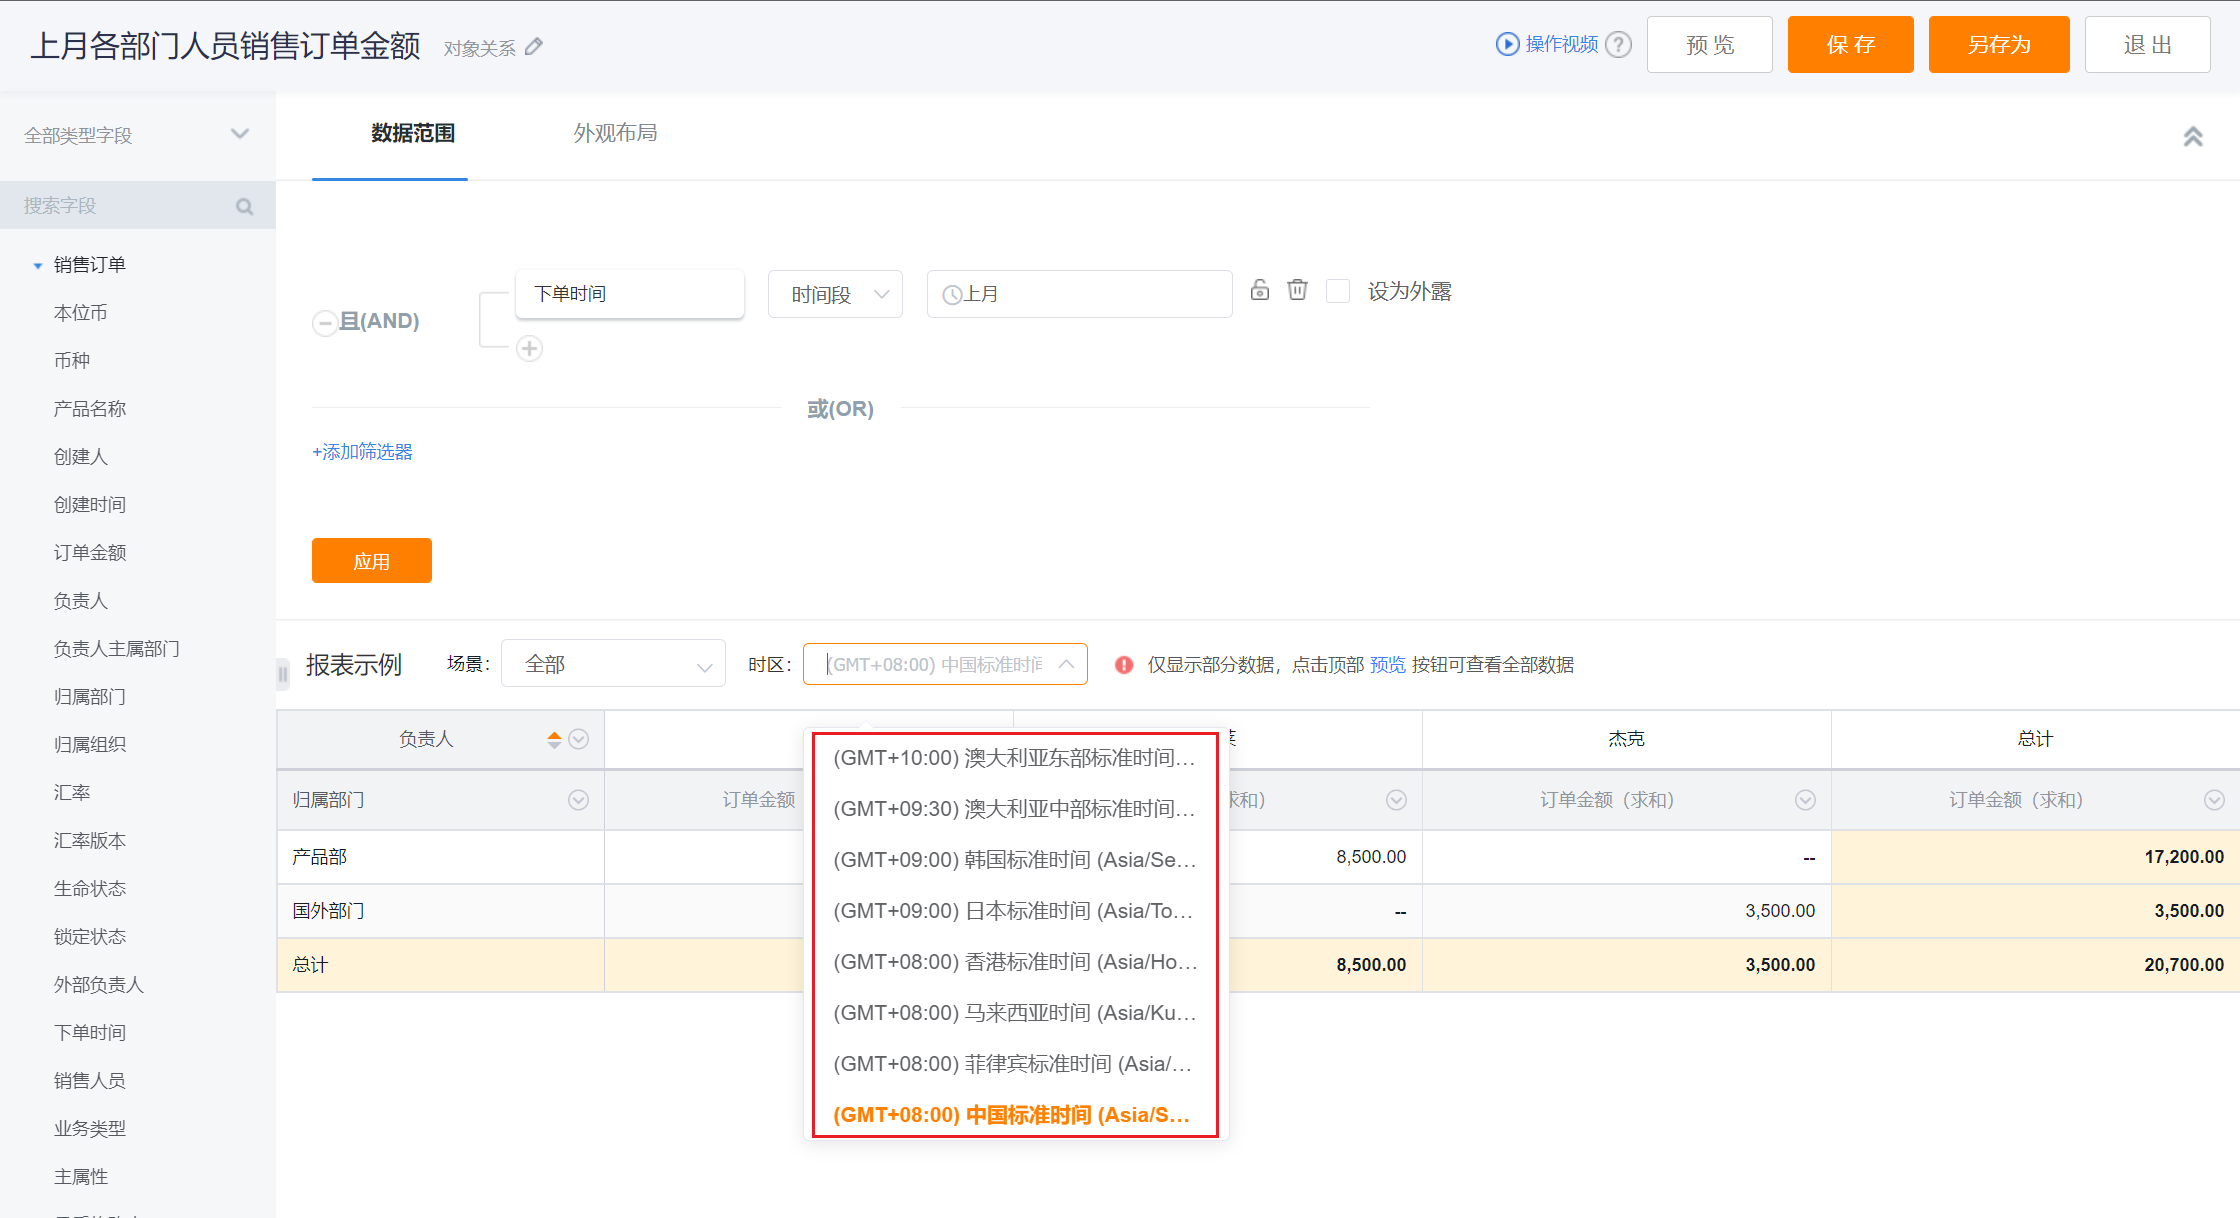
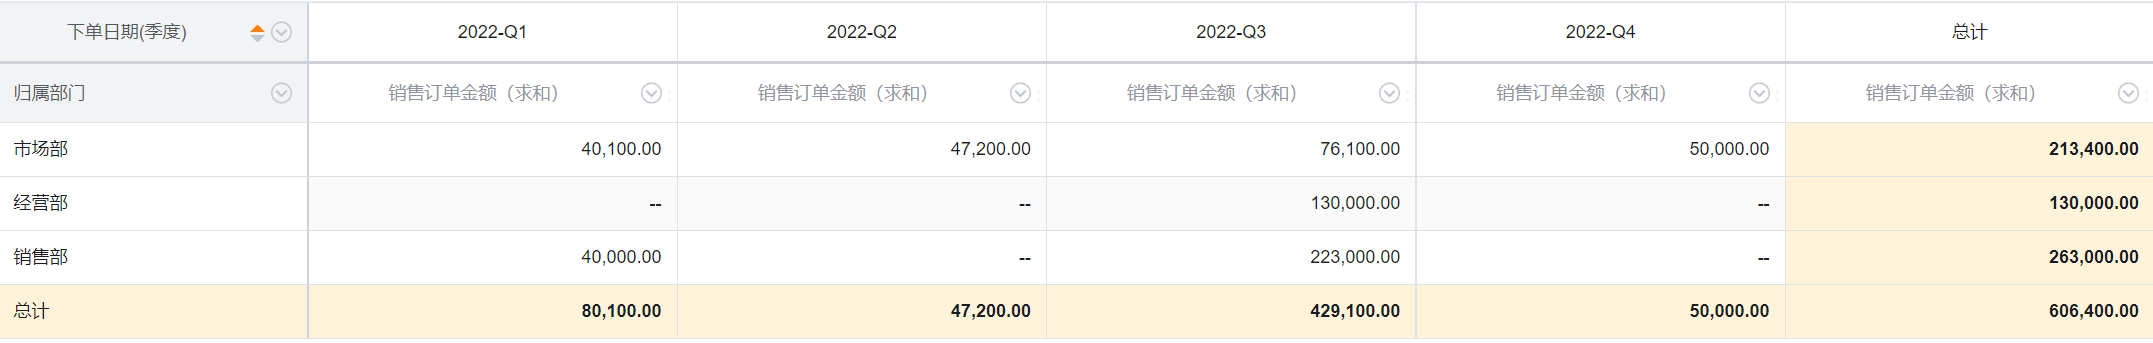
- Scene 4: If the enterprise has enabled the multi-time zone function, calculate the sales order amount of each department personnel in the East Eighth District in August 2022.
- Row Group: belonging department; column group: owner; statistics field: order amount (yuan) - sum; time zone: East Eighth District
- Notes: The cross-tab editing mode supports switching time zones. When East Eighth District is selected as the time zone, the order amount of personnel in each department will be counted according to the echo of East Eighth District. If the order date is a field attribute that does not use multiple time zones, the user selects [Business Occurrence Time Zone], and the data will be echoed according to the real business occurrence time zone. In this case, the data will be echoed according to the East Eighth District
- Row Group: belonging department; column group: owner; statistics field: order amount (yuan) - sum; time zone: East Eighth District
- Function Description:
- Supports multiple row and column groupings, up to 5 groups in total;
- Support up to 5 statistical columns;
- Support date & date time types grouped by year, quarter, month, day level;
- Display row and column subtotals and totals, and support setting whether to display, and horizontal totals support configuration placement;
- Statistics, subtotals, and totals all support clicking to view details;
- Support grouping field sorting and data range filtering;
- Support forwarding, exporting, sharing, subscribing.
The configuration content related to other cross reports is the same as [General Report] (http://help.fxiaoke.com/2615/5df2/cc9a/8394), click to view
3. View Cross Report
- Report Viewing Page Layout:
- Scene Tag: used to switch between different scenes.
- Header Area: It can be sorted for row grouping and column grouping, and all data in the header area can be filtered.
- Data Range: You can modify the preset filter conditions and adjust whether it is exposed.
- Data Display Area:
- Group Area: Display each row and column grouping in a combined manner.
- Statistics Area: Display the statistical data within the group in rows.
- Subtotal Area: Perform data statistics on rows and columns at all levels layer by layer.
- Total Area: Perform overall statistics of rows and columns for all data.
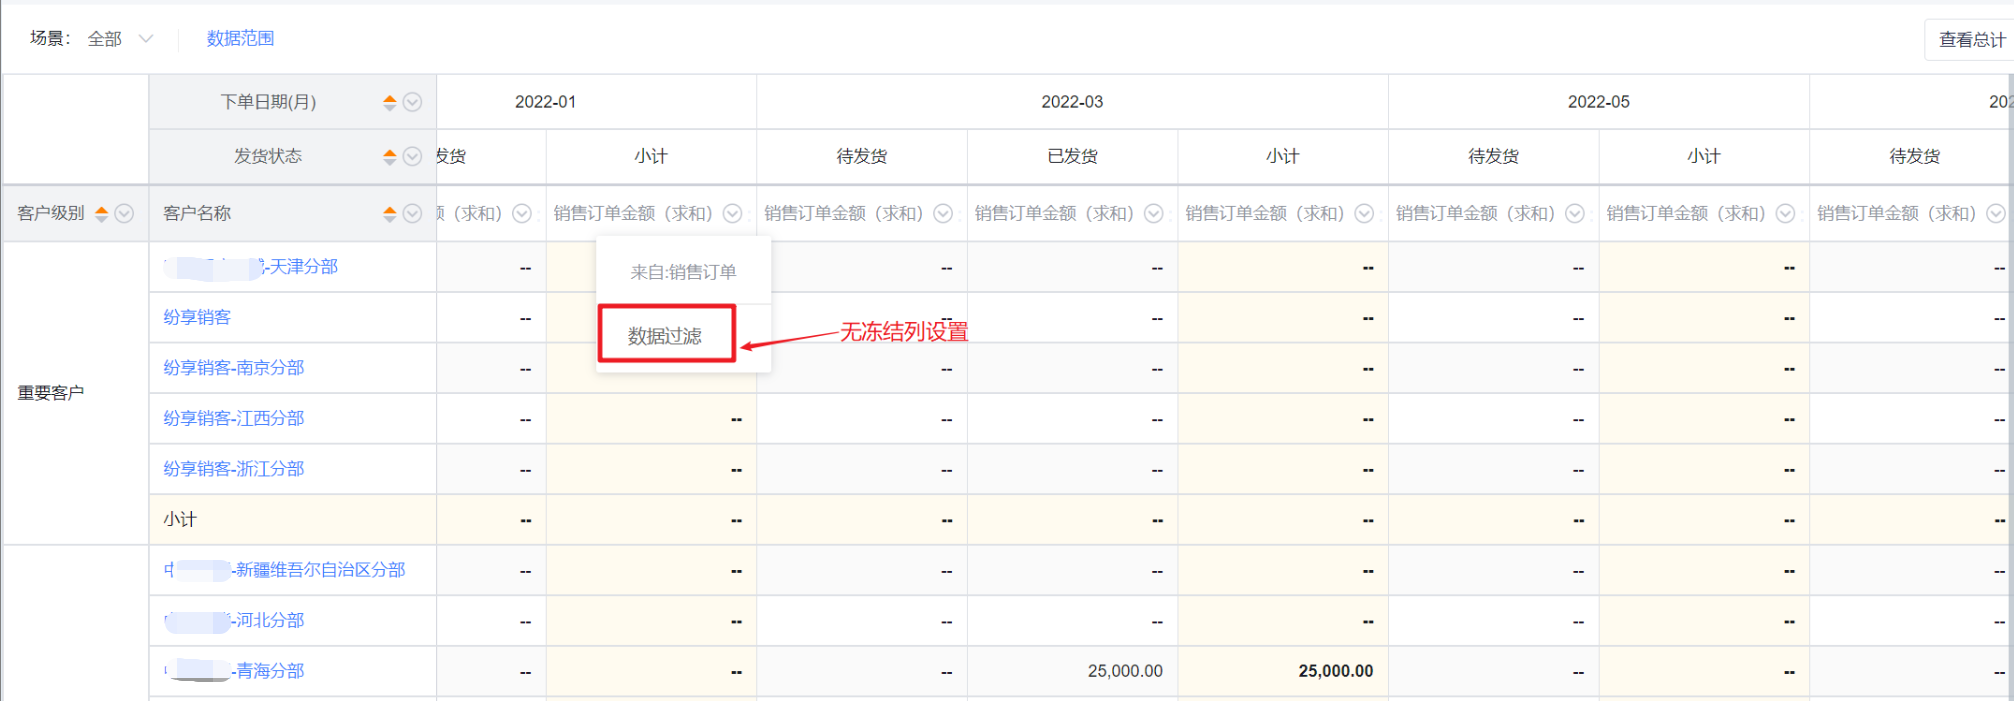
3.1 Freezing of Cross Report
- Cross-report group fields are frozen by default, statistics fields do not support freezing settings
3.2 Display & Drill of Department Field
When different types of department fields are grouped in the cross-report, the degree of support and the display effect are also inconsistent:
- Main Department: When only the main department is grouped, it will be displayed in a summary by default. After clicking, the next level will be expanded until it is finally displayed as owner
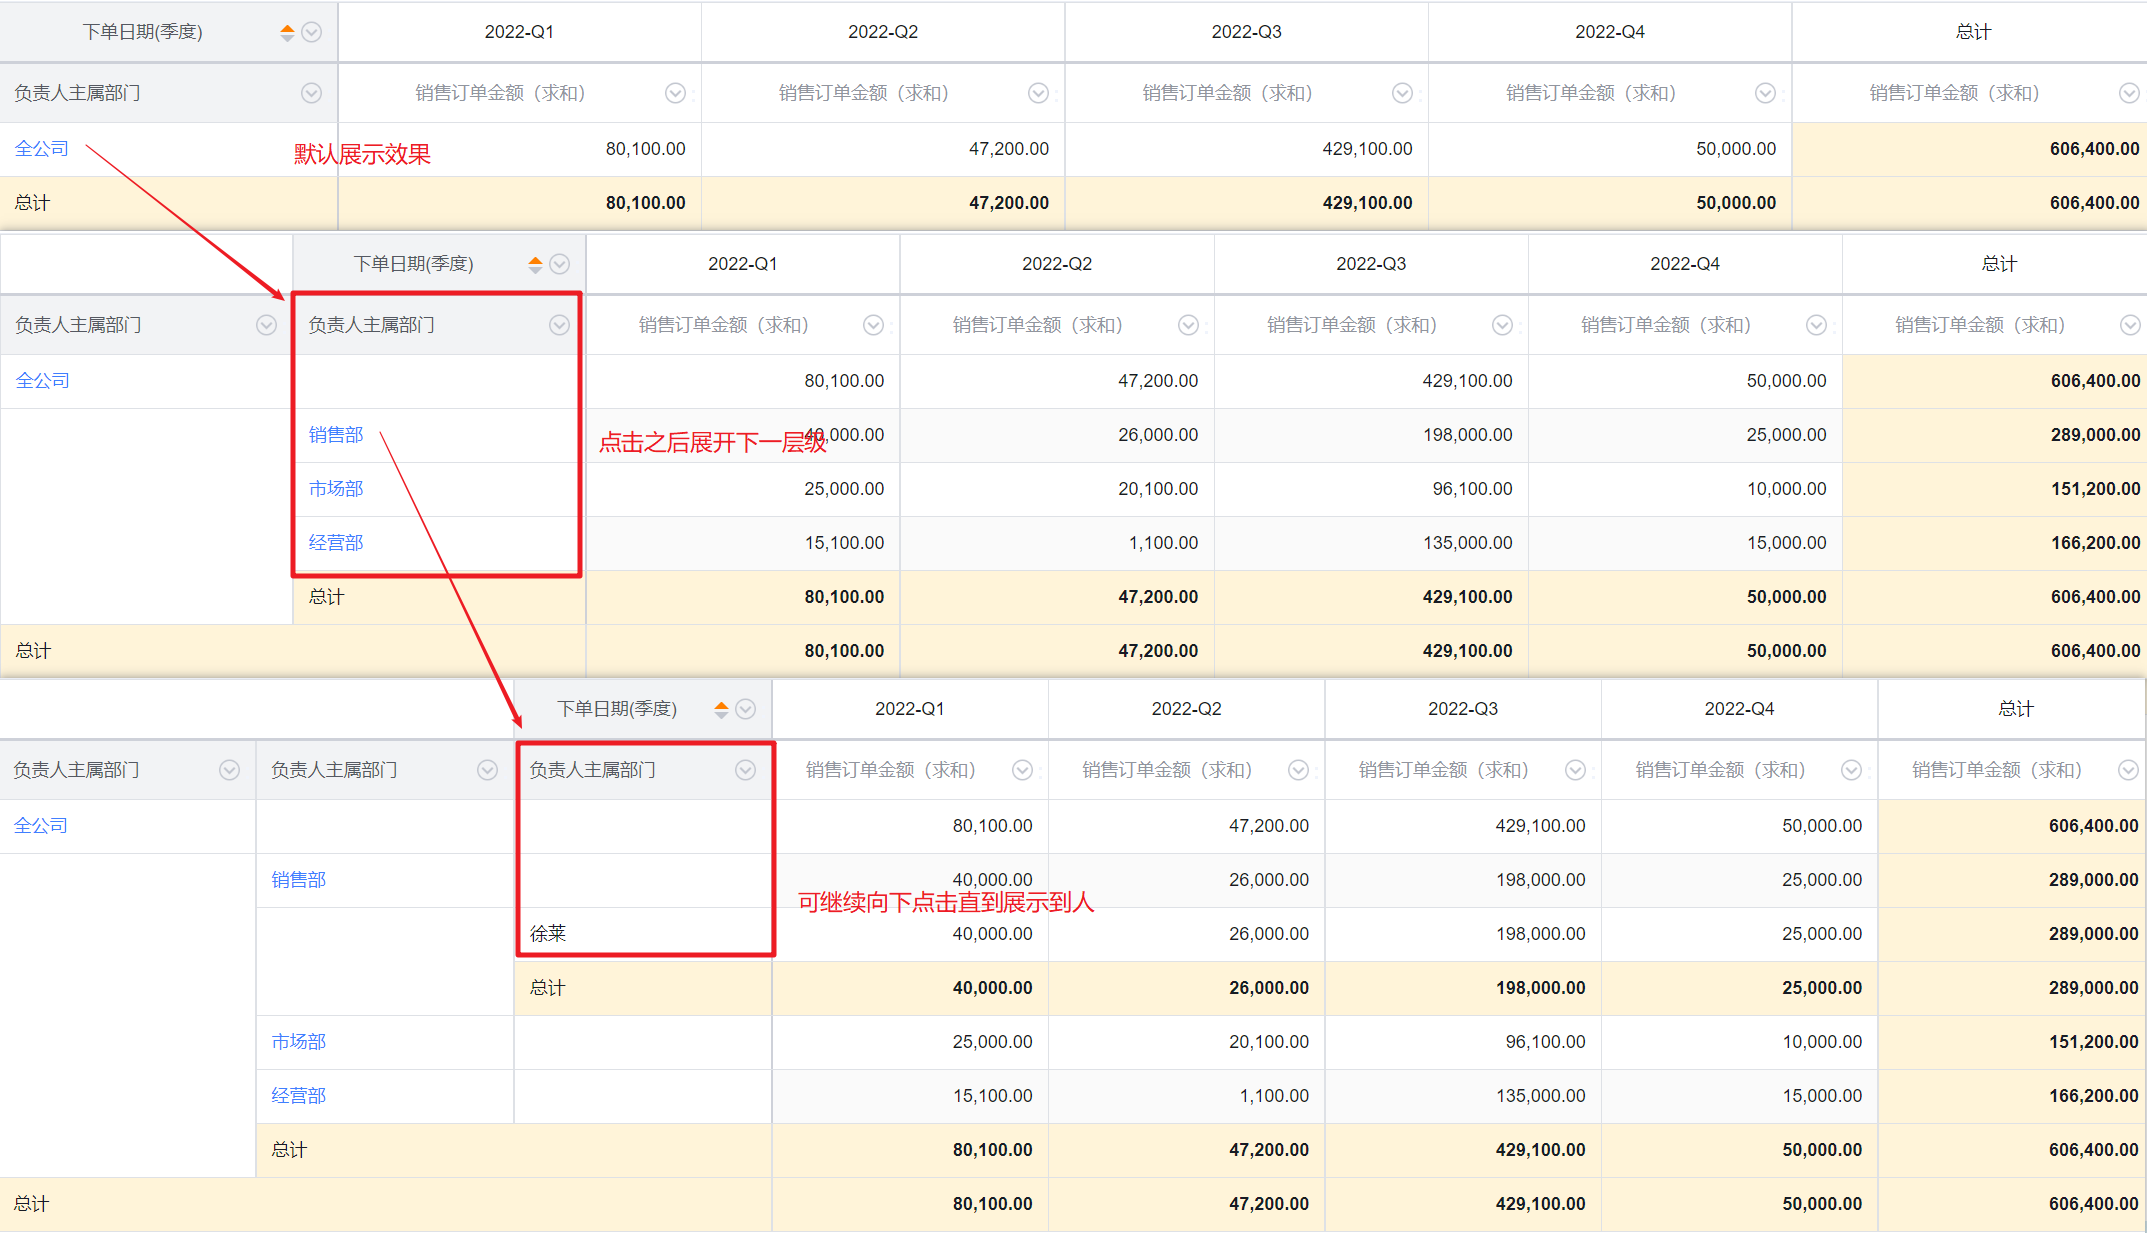
- Main Department: when there are both the main department and owner being as group, it will be displayed in a tiled manner, and drill-down is not supported
- Belonging Department & Custom Department: it's tile display by default, and does not support drill-down
Notes: For details of scene filter, data range, header data filter, group field sorting, link to CRM details pages, switch time zone, please refer to Common Report