1. Scene
For the convenience of customers, the product itself provides a variety of chart styles, including: reports, crosstabs, column charts, line charts, pie charts, funnel charts, statistical tables, dual-axis charts, KPI cards, dashboards, maps ( Heat), Map (Bubble), Stacked Column, Stacked Line, Heat, Bubble. If the customer needs a special display interface, the statistical data is obtained through the BI function, and the display interface is customized through the PWC. For more information on PWC, please refer to: custom plug-in, Custom components.
2. Typical case
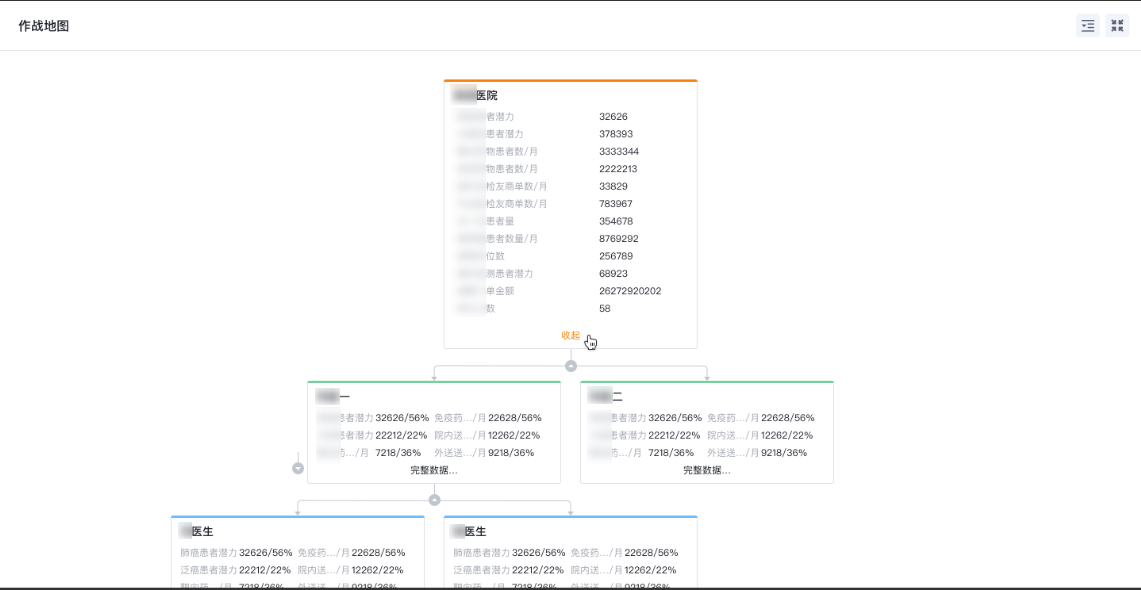
2.1 Battle Map
2.2 Mobile App View